Amd Fair Value Gap Pro
- Indicatori
-
Andrei-marius Mircea
 I’m a trader, EA and indicator developer focused on creating practical tools for MetaTrader 5. My goal is to help traders analyze the market more clearly, identify opportunities, and make better-informed decisions.
 - Versione: 2.0
- Attivazioni: 5
AMD FAIR VALUE GAP PRO
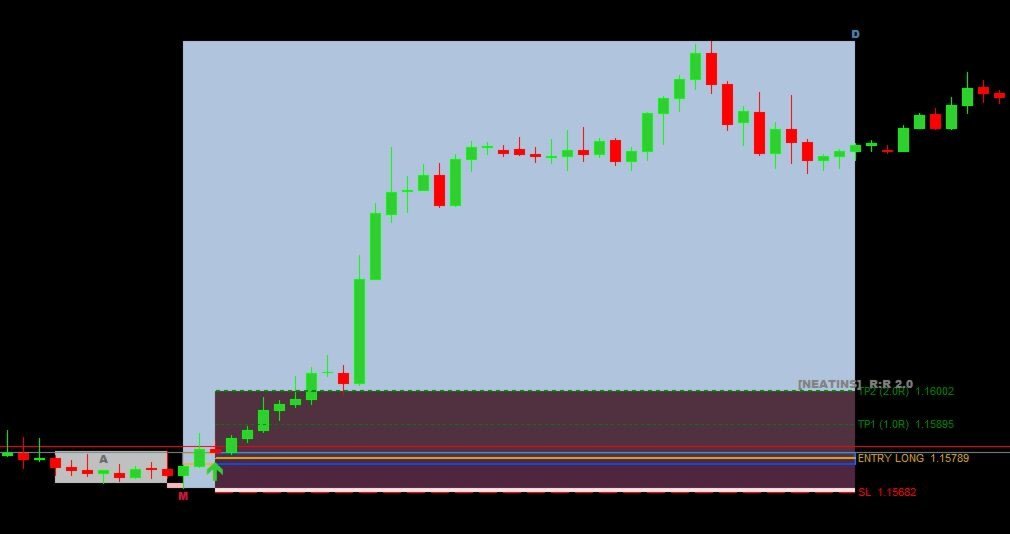
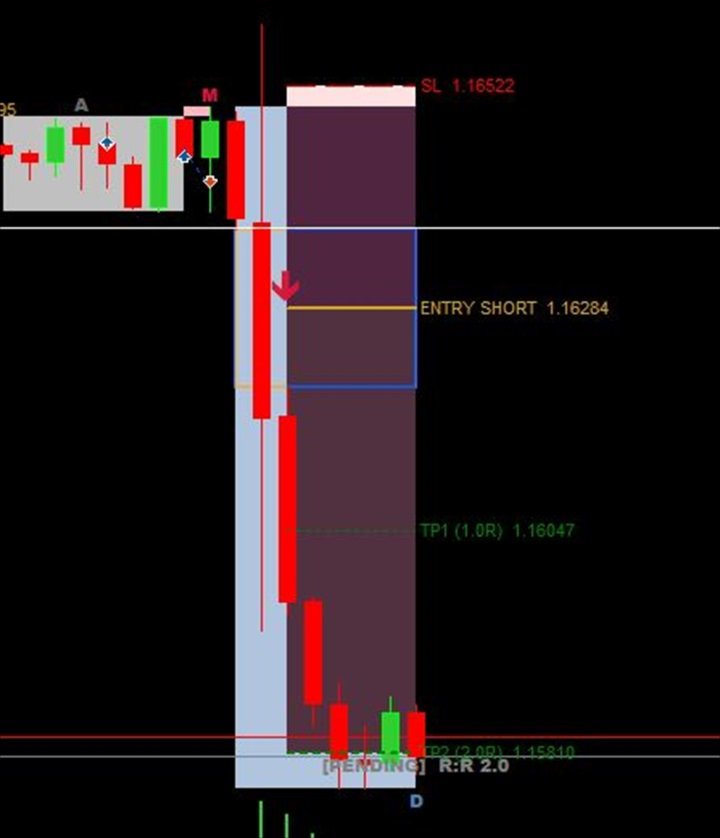
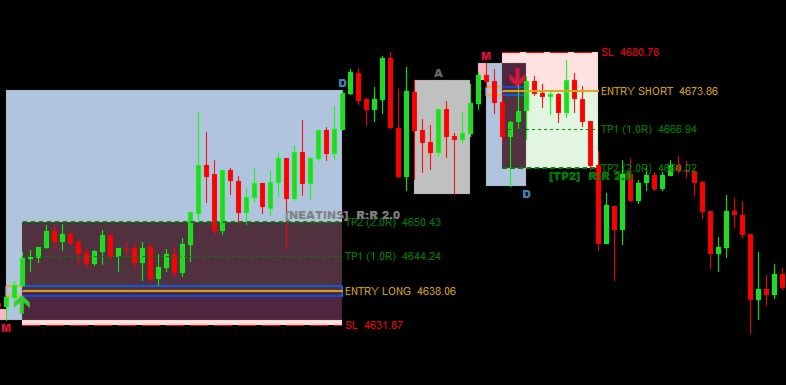
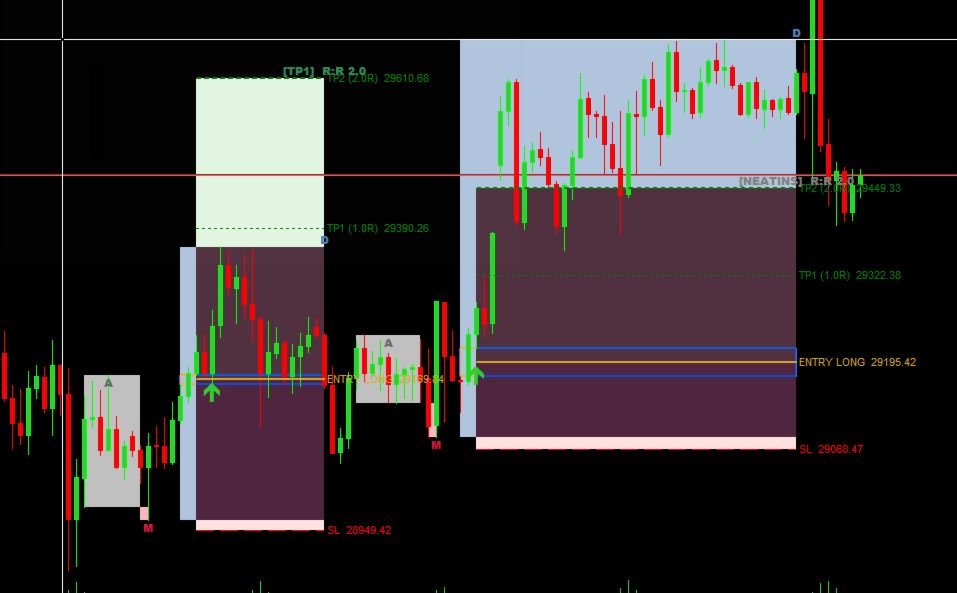
AMD Fair Value Gap Pro is a MetaTrader 5 chart indicator designed to identify Accumulation, Manipulation and Distribution structures together with liquidity sweeps and Fair Value Gaps.
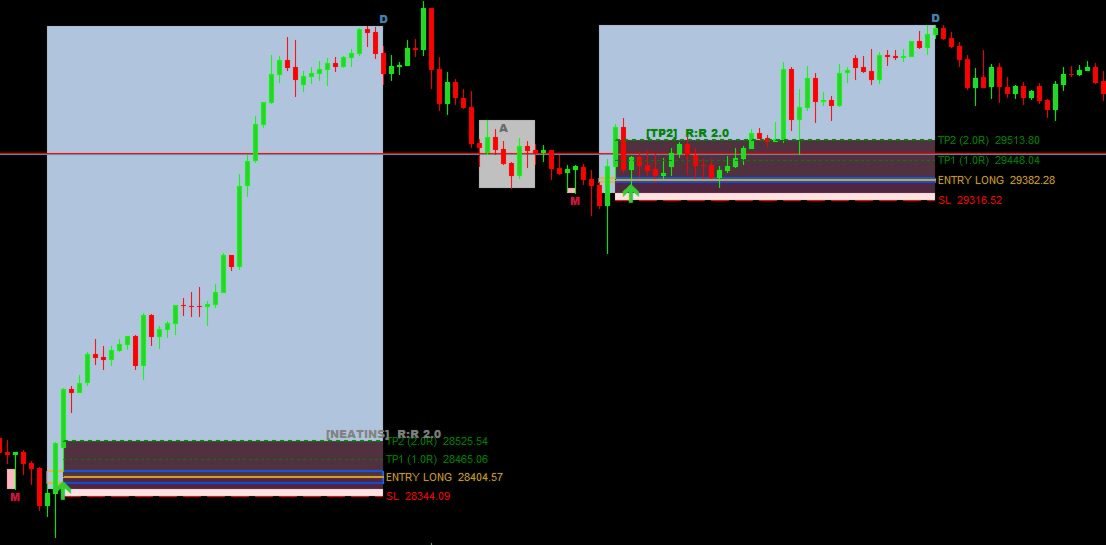
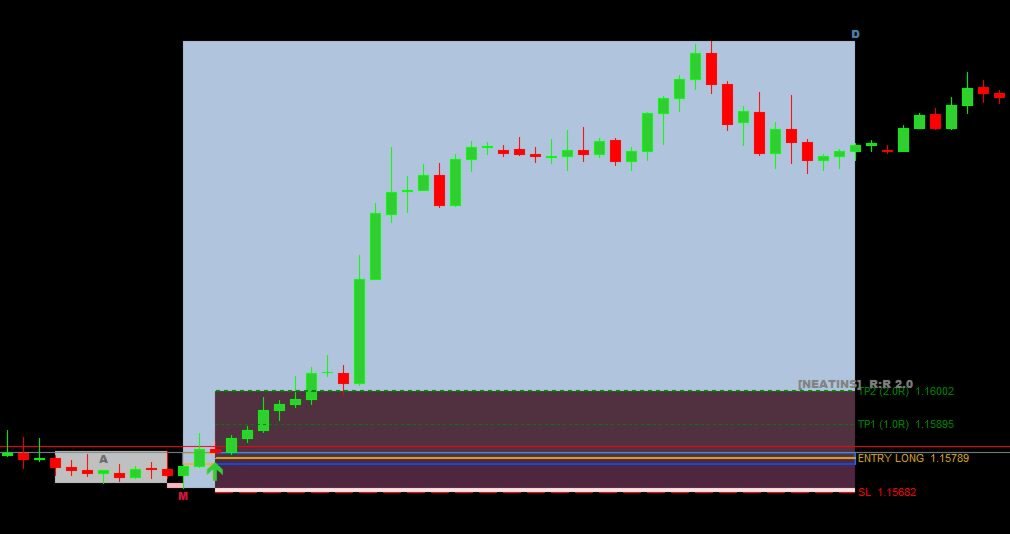
The indicator analyzes the current symbol and timeframe. When its configured conditions are satisfied, it displays the detected structure and optional Entry, Stop Loss, TP1 and TP2 reference levels directly on the chart.
The product is intended for discretionary market analysis. It does not open, modify or close trades.
MAIN FEATURES
-
Detects bullish and bearish AMD structures
-
Identifies accumulation ranges using ATR-based width filters
-
Looks for liquidity sweeps above or below the detected range
-
Supports an optional requirement for price to close back inside the range
-
Detects bullish and bearish Fair Value Gaps after the manipulation phase
-
Draws Accumulation, Manipulation, FVG and Distribution zones
-
Displays optional Entry, Stop Loss, TP1 and TP2 reference levels
-
Provides near-edge, midpoint, far-edge and market-close entry calculations
-
Supports ATR-based Stop Loss buffers
-
Supports configurable R-multiple targets and a range-projection option for TP2
-
Displays optional risk and reward areas
-
Evaluates historical setups as Pending, Filled, TP1, TP2, Stop Loss or Not Filled
-
Includes popup alerts and MetaTrader mobile push notifications
-
Allows bullish and bearish setups to be enabled independently
HOW THE INDICATOR WORKS
-
Accumulation
The indicator searches for a defined price range using configurable duration, width and ATR-based filters.
-
Manipulation and liquidity sweep
It evaluates movement beyond the detected range and can require price to close back inside the range.
-
Fair Value Gap
After the manipulation phase, the indicator searches for a qualifying bullish or bearish Fair Value Gap.
-
Distribution and trade levels
When the configured conditions are satisfied, the relevant zones and optional Entry, Stop Loss, TP1 and TP2 reference levels are displayed.
ENTRY CALCULATION MODES
-
Near FVG edge — uses the edge of the gap closest to price
-
FVG midpoint — uses the 50% level of the gap
-
Far FVG edge — uses the opposite edge of the gap
-
Market at FVG close — uses the closing price of the FVG bar
HISTORICAL SETUP STATUS
Historical setups can be evaluated according to subsequent price action:
-
Pending
-
Filled
-
TP1
-
TP2
-
Stop Loss
-
Not Filled
These statuses allow previous detected setups to be reviewed directly on the chart. Historical outcomes do not guarantee future results.
MARKETS AND TIMEFRAMES
AMD Fair Value Gap Pro can be attached to any symbol available in the user’s MetaTrader 5 terminal, including Forex pairs, metals, indices and cryptocurrencies.
The indicator supports all standard MetaTrader 5 timeframes. Symbol names, pricing characteristics and available instruments vary between brokers.
Different instruments, timeframes and settings can produce different setup frequency and behavior. Users should test the indicator on the markets and timeframes relevant to their own approach.
ADJUSTABLE SETTINGS
The inputs are organized into groups for scanning, accumulation, manipulation, Fair Value Gap detection, distribution, trade levels, visuals and alerts.
Users can adjust:
-
Scan depth
-
Accumulation duration and width
-
Sweep depth
-
Fair Value Gap size
-
Distribution duration
-
Entry validity
-
Entry calculation mode
-
Stop Loss buffer
-
Target multiples
-
Minimum risk-to-reward filter
-
Colors and labels
-
Popup and push-notification options
INSTALLATION AND USE
-
Install AMD Fair Value Gap Pro through the MetaTrader 5 Market.
-
Open the required symbol and timeframe.
-
Attach AMD Fair Value Gap Pro to the chart.
-
Begin with the default settings or adjust the detection filters.
-
Review the marked Accumulation, Manipulation, FVG and Distribution zones.
-
Evaluate the displayed reference levels within your own trading plan.
-
Enable the required alert options.
The indicator processes the current chart only. To analyze multiple symbols or timeframes simultaneously, attach a separate instance to each required chart.
ALERTS
Popup alerts are enabled by default. MetaTrader mobile push notifications require a valid MetaQuotes ID configured in the MetaTrader 5 terminal settings.
Alerts can identify the symbol, timeframe, direction and available reference levels for a newly detected qualifying setup.
IMPORTANT INFORMATION
AMD Fair Value Gap Pro is an analytical indicator, not an Expert Advisor. It does not place trades or manage positions.
Detected patterns and displayed levels are analytical references and are not recommendations to buy or sell. Market conditions, broker specifications, symbol characteristics, timeframe selection and indicator settings can affect detected setups.
Trading involves risk. Historical chart patterns and historical setup outcomes do not guarantee future results. Test and configure the indicator on a demo account before considering its information for live trading.