Cross Over Trend Indicator
- Indicatori
- Versione: 2.3
- Attivazioni: 5

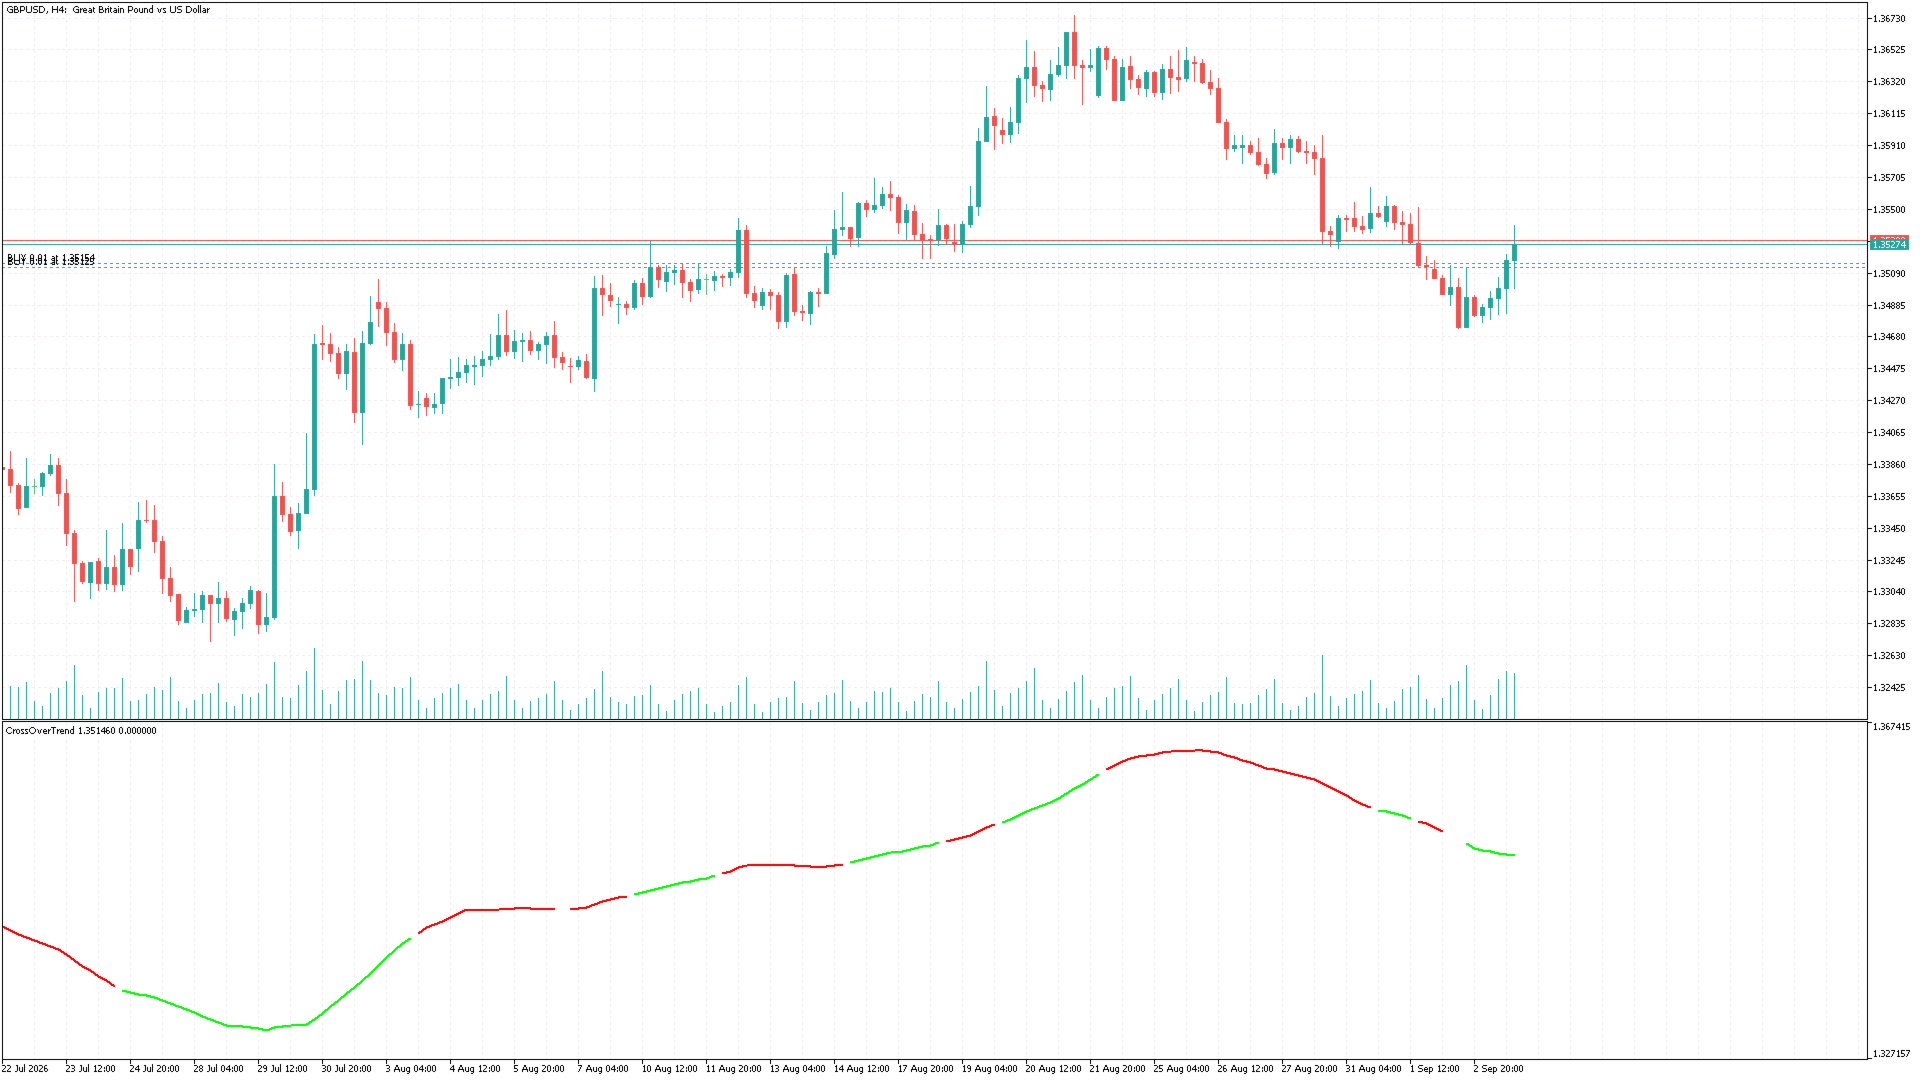
Cross Over Trend è un indicatore tecnico semplice ed efficace per MetaTrader 5 che visualizza il rapporto tra una Media Mobile Esponenziale (EMA) e una Media Mobile Semplice (SMA).
L'indicatore facilita l'identificazione della direzione attuale del trend, suddividendo automaticamente le fasi di mercato in trend rialzista (UpTrend) e trend ribassista (DownTrend) sulla base del rapporto tra EMA e SMA.
Funzionamento
L'indicatore confronta i valori attuali della EMA e della SMA:
-
EMA > SMA → UpTrend
-
EMA ≤ SMA → DownTrend
Quando la EMA si trova al di sopra della SMA, l'area corrispondente viene visualizzata come UpTrend. Quando la EMA scende al di sotto della SMA, la visualizzazione passa a DownTrend.
In questo modo è possibile identificare rapidamente e chiaramente la direzione attuale del mercato senza dover confrontare manualmente EMA e SMA.
Funzioni principali
-
Rilevamento degli incroci EMA/SMA
-
Visualizzazione separata di UpTrend e DownTrend
-
Periodo EMA liberamente configurabile
-
Periodo SMA liberamente configurabile
-
Possibilità di selezionare un timeframe separato per il calcolo di EMA/SMA
-
Utilizzo del timeframe attuale del grafico o di un altro timeframe
-
Calcolo leggero ed efficiente
-
Adatto per Scalping, Intraday Trading e Swing Trading
-
Può essere utilizzato come indicatore di trend indipendente o come filtro per strategie di trading ed Expert Advisor (EA)
Parametri di input
SMAEMA_TF
Definisce il timeframe sul quale vengono calcolate la SMA e la EMA.
Valore predefinito:
Timeframe attuale del grafico
L'indicatore può anche calcolare il rapporto EMA/SMA su un altro timeframe, consentendo un'analisi del trend Multi-Timeframe.
SMA_Period
Definisce il periodo della Simple Moving Average.
Valore predefinito:
20
EMA_Period
Definisce il periodo della Exponential Moving Average.
Valore predefinito:
21
Esempio
Con le impostazioni predefinite:
SMA = 20
EMA = 21
Quando la EMA si trova al di sopra della SMA, l'indicatore identifica un UpTrend (trend rialzista).
Quando la EMA si trova al di sotto o è uguale alla SMA, l'indicatore identifica un DownTrend (trend ribassista).
L'incrocio tra le due medie mobili può quindi essere utilizzato come indicazione di un possibile cambiamento nella direzione del mercato.
Analisi Multi-Timeframe
Una delle funzioni più importanti di Cross Over Trend è la possibilità di selezionare un timeframe separato per il calcolo della SMA e della EMA.
Esempio:
-
Grafico: M5
-
Timeframe SMA/EMA: H1
In questo modo, il trend generale del timeframe H1 può essere utilizzato come filtro direzionale mentre le operazioni vengono effettuate sul timeframe M5.
Progettato per la semplicità
Cross Over Trend si concentra volutamente su un unico concetto fondamentale:
EMA vs. SMA = Direzione del trend
Non vengono utilizzati oscillatori inutili né calcoli complessi.
Il risultato è una visualizzazione del trend chiara, semplice e facile da comprendere, utilizzabile sia per il trading manuale sia per strategie di trading automatizzate.
Avvertenza importante
Cross Over Trend è uno strumento di analisi tecnica e non garantisce risultati positivi nel trading.
Gli incroci delle medie mobili sono indicatori ritardati e possono generare falsi segnali, soprattutto durante le fasi laterali del mercato o in condizioni di elevata volatilità.
Utilizza sempre una gestione del rischio adeguata e testa l'indicatore nelle tue condizioni di trading prima di utilizzarlo con capitale reale.
Cross Over Trend – L'analisi del trend resa semplice.
EMA vs. SMA.
Un incrocio.
Una direzione del trend chiara.