
AW Supply Demand finds supply and demand zones the classic way: a base of several small candles and a strong departure of price from it.
Every zone receives an open score from 0 to 10, passes through a life cycle from fresh to broken and flipped, and the panel assembles a ready setup from the zones with entry, stop and target levels.
The indicator shows zones from up to three higher timeframes on one chart, sends notifications and passes all data to buffers for Expert Advisors.
Zones are not redrawn. A zone appears a set number of closed bars after its base, its boundaries do not change after confirmation, and only the state, the score and the touch counter change afterwards. The indicator works on any symbol and timeframe and in the strategy tester.
Product links: MT5 version and MT4 version.
The article contains the following sections:
- How the indicator finds zones
- Zone score and grades
- The panel
- How to buy
- How to sell
- Multi-timeframe use
- Notifications
- Hotkeys and layers
- Input settings
- For Expert Advisor developers
1. How the indicator finds zones
A demand zone lies below price and is meant for buying, a supply zone lies above price and is meant for selling. Every zone has two boundaries, the near one and the far one. Entry is measured from the near boundary, the stop is placed beyond the far one.
Base. Several candles in a row with small bodies: no more than Max base candles candles, the body of each no larger than the Base candle: max body / range share of its range. The default is six candles with a body no larger than half of the range.
Departure. Within Bars to measure departure bars after the base, price leaves it by at least Min departure, ATR and by at least Min departure, zone heights zone heights. By default the departure is measured over ten bars, with a threshold of 1.5 ATR and two zone heights.
Confirmation. A zone appears on the chart Bars to confirm a zone closed bars after the departure, provided that price has not returned to the near boundary in the meantime. After confirmation the boundaries are fixed.
Boundaries. The Zone boundaries variable sets the way they are built: Classic from the edge of the base candle bodies to the edge of the wicks, Full candle from wick to wick, Body only from the bodies alone. A zone below 0.2 ATR is stretched to that height, a zone above Max zone height, ATR is clipped, and such a zone carries the word clipped in its tooltip.
Life cycle. A fresh zone Fresh turns into Tested after the first visit of price, becomes Weak after Touches to mark a zone weak touches, and leaves the chart after Touches to retire a zone touches. A visit begins when price touches the near boundary with a wick or with a close, depending on Touch by, and ends when price has moved away from the zone by Bars outside to end a visit bars or by the height of the zone.
Break. A zone is broken when a bar closes beyond the far boundary. The Break by mode also allows a break to be counted as two closes in a row or as a wick puncture. A wick puncture with a close back beyond the near boundary counts as a fake break, and the zone stays alive.
Flip. A broken demand zone turns into a supply zone, and the other way round, when Flip broken zones is enabled. A flipped zone waits for the first retest for Bars to wait for a flip retest bars and is removed without one. With the flip disabled, a broken zone stays on the chart as a grey dotted outline for Bars to keep broken zones bars.
Overlaps and the limit. When a new zone intersects an older one of the same type, the Overlapping zones variable decides what to keep: the newest, the strongest, or both merged. On each timeframe no more than Max zones drawn per side zones are drawn on each side of price.
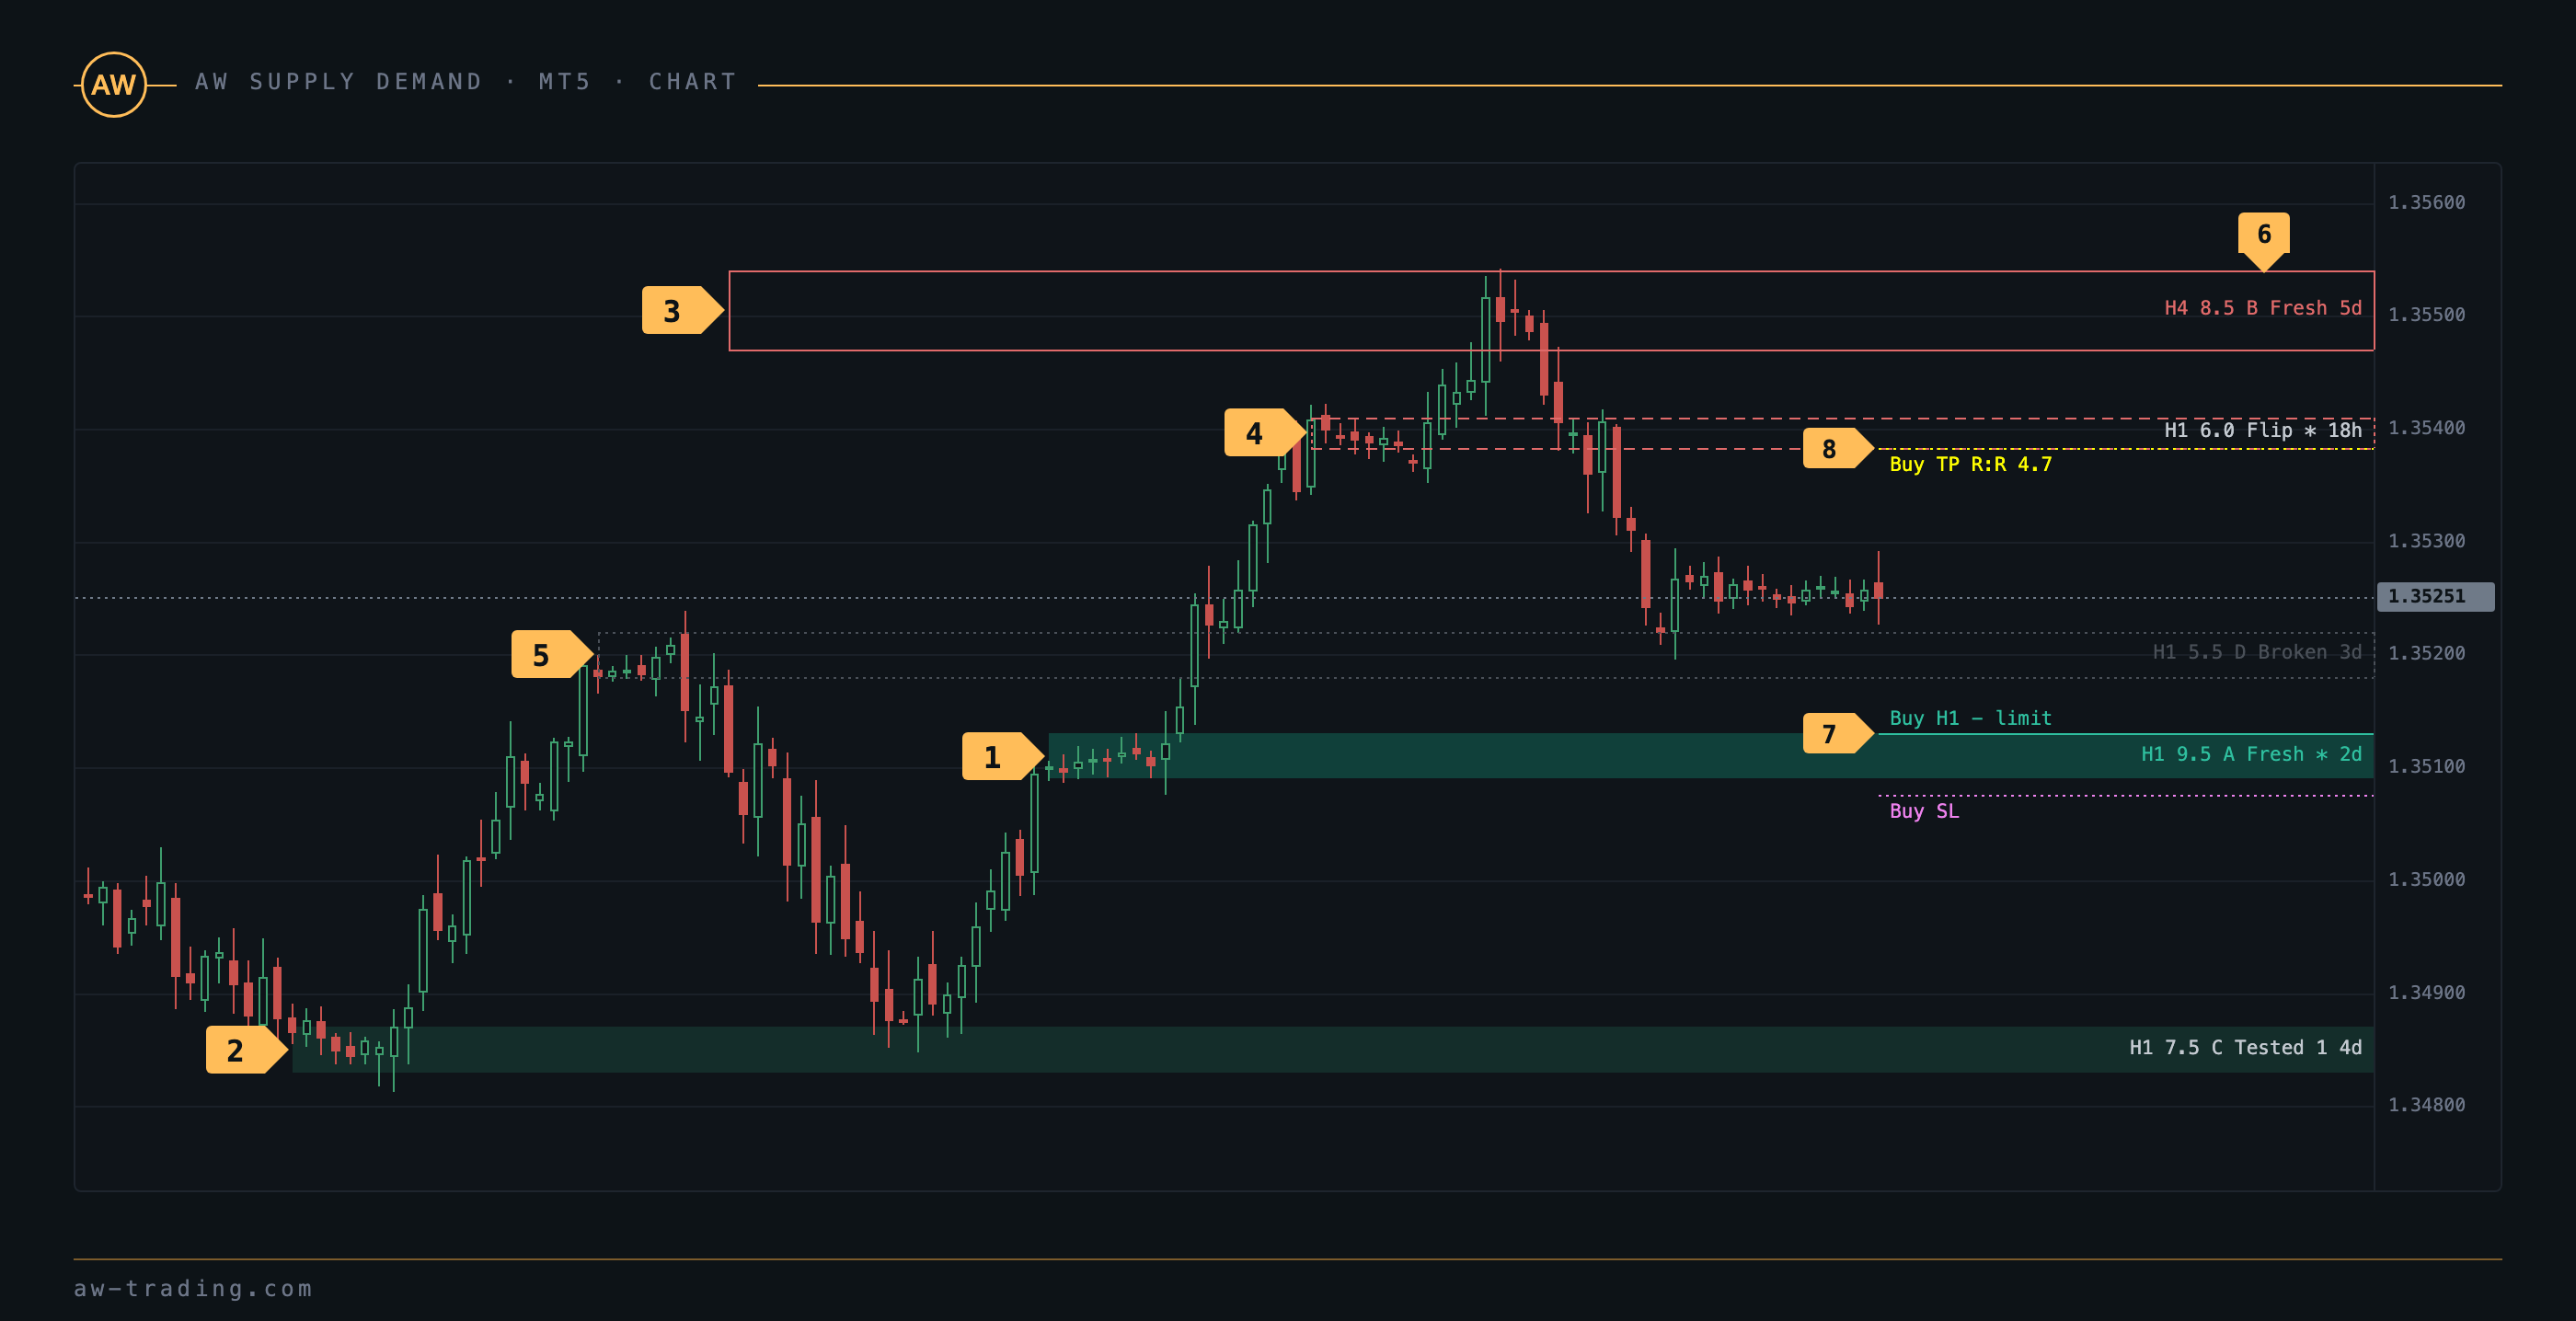
| No. | What is on the chart |
|---|---|
| 1 | A fresh demand zone of the chart timeframe: filled. The boundaries are fixed after confirmation and do not change afterwards. |
| 2 | A demand zone after a touch: the fill is darker, the Fresh component of the score has gone down. |
| 3 | A higher timeframe zone: an outline in the color of the type, without fill. A fresh D1 or W1 zone is drawn thicker. |
| 4 | A flipped zone: dashes. A broken demand zone has turned into a supply zone and waits for a retest. |
| 5 | A broken zone: a grey dotted outline. It stays on the chart for the set number of bars, the O key hides it. |
| 6 | The zone label: timeframe, score and grade, state with the number of touches, the nesting asterisk, age. Grades A and B are highlighted in the color of the type. |
| 7 | The setup entry line with the zone timeframe and the verdict, in the color of the zone. For a Skip setup the lines are grey. |
| 8 | SL as a dotted line beyond the far boundary of the zone with a buffer in ATR. TP at the near boundary of the opposing zone, with Risk / Reward in the label. |
Presets. The Preset variable sets four values of the DETECTION SETTINGS block at once, the rest of the block keeps its working values. Custom leaves the block as is.
| Preset | Min departure, ATR | Min departure, zone heights | Minimum score to show a zone | Max zones drawn per side |
|---|---|---|---|---|
| Balanced | 1.5 | 2.0 | 6.0 | 4 |
| Conservative | 2.0 | 3.0 | 7.0 | 3 |
| Aggressive | 1.2 | 1.5 | 5.0 | 5 |
| Custom | the values from the DETECTION SETTINGS block, unchanged | |||
2. Zone score and grades
The zone score is the sum of six components and modifiers, capped at ten points. The breakdown of the score is visible when hovering the cursor over a zone or over its label.
| Component | Points | What for |
|---|---|---|
| Strength | 0-2 | Strength of the departure. 2 points: the departure is at least 3 ATR and 3 zone heights, with at least two impulse candles in a row or a break of the last swing. 1 point: the departure is at least 1.5 ATR and 2 zone heights. Otherwise 0. |
| Margin | 0-2 | Room to the nearest opposing zone relative to the trade risk (the zone height plus the stop buffer). A ratio of 3 and above gives 2 points, 2 and above gives 1 point. With no opposing zone, 2 points. |
| Picture | 0-2 | The picture of the higher timeframes. 2 points: the zone agrees with the direction of the higher timeframes and is also nested inside a higher timeframe zone, or there is no opposing higher timeframe zone nearby. 1 point: one of the conditions is met. Otherwise 0. |
| Fresh | 0-2 | Touches. An untouched zone gets 2 points, one touch gives 1 point, beyond that 0. |
| Time | 0-1 | Time in the base. A base of up to three candles gives 1 point, up to six gives 0.5, longer gives 0. |
| Arrival | 0-1 | The approach of price. Before the first visit, 0.5. On the first visit, 1 point when price came to the zone in a move of 1.5 ATR or more and no opposing zone appeared in the meantime, otherwise 0. |
| Mods | 0-1.5 | Bonuses of 0.5 each: a reversal zone (price came to the base against the direction of the departure), a price gap on the departure (FVG), a liquidity sweep before the base. |
Grades. A from 9 points, B from 8, C from 7, D below 7. Zones scoring below Minimum score to show a zone stay in the calculation but are not drawn and take no part in the setup, so the chart stays clean. Higher timeframe zones have a threshold of their own, Minimum score for higher timeframe zones.
Verdict. Grade A gives the verdict Limit order, grade B gives Confirm entry, grades C and D give Skip. Sections 4 and 5 describe how the verdict is used.
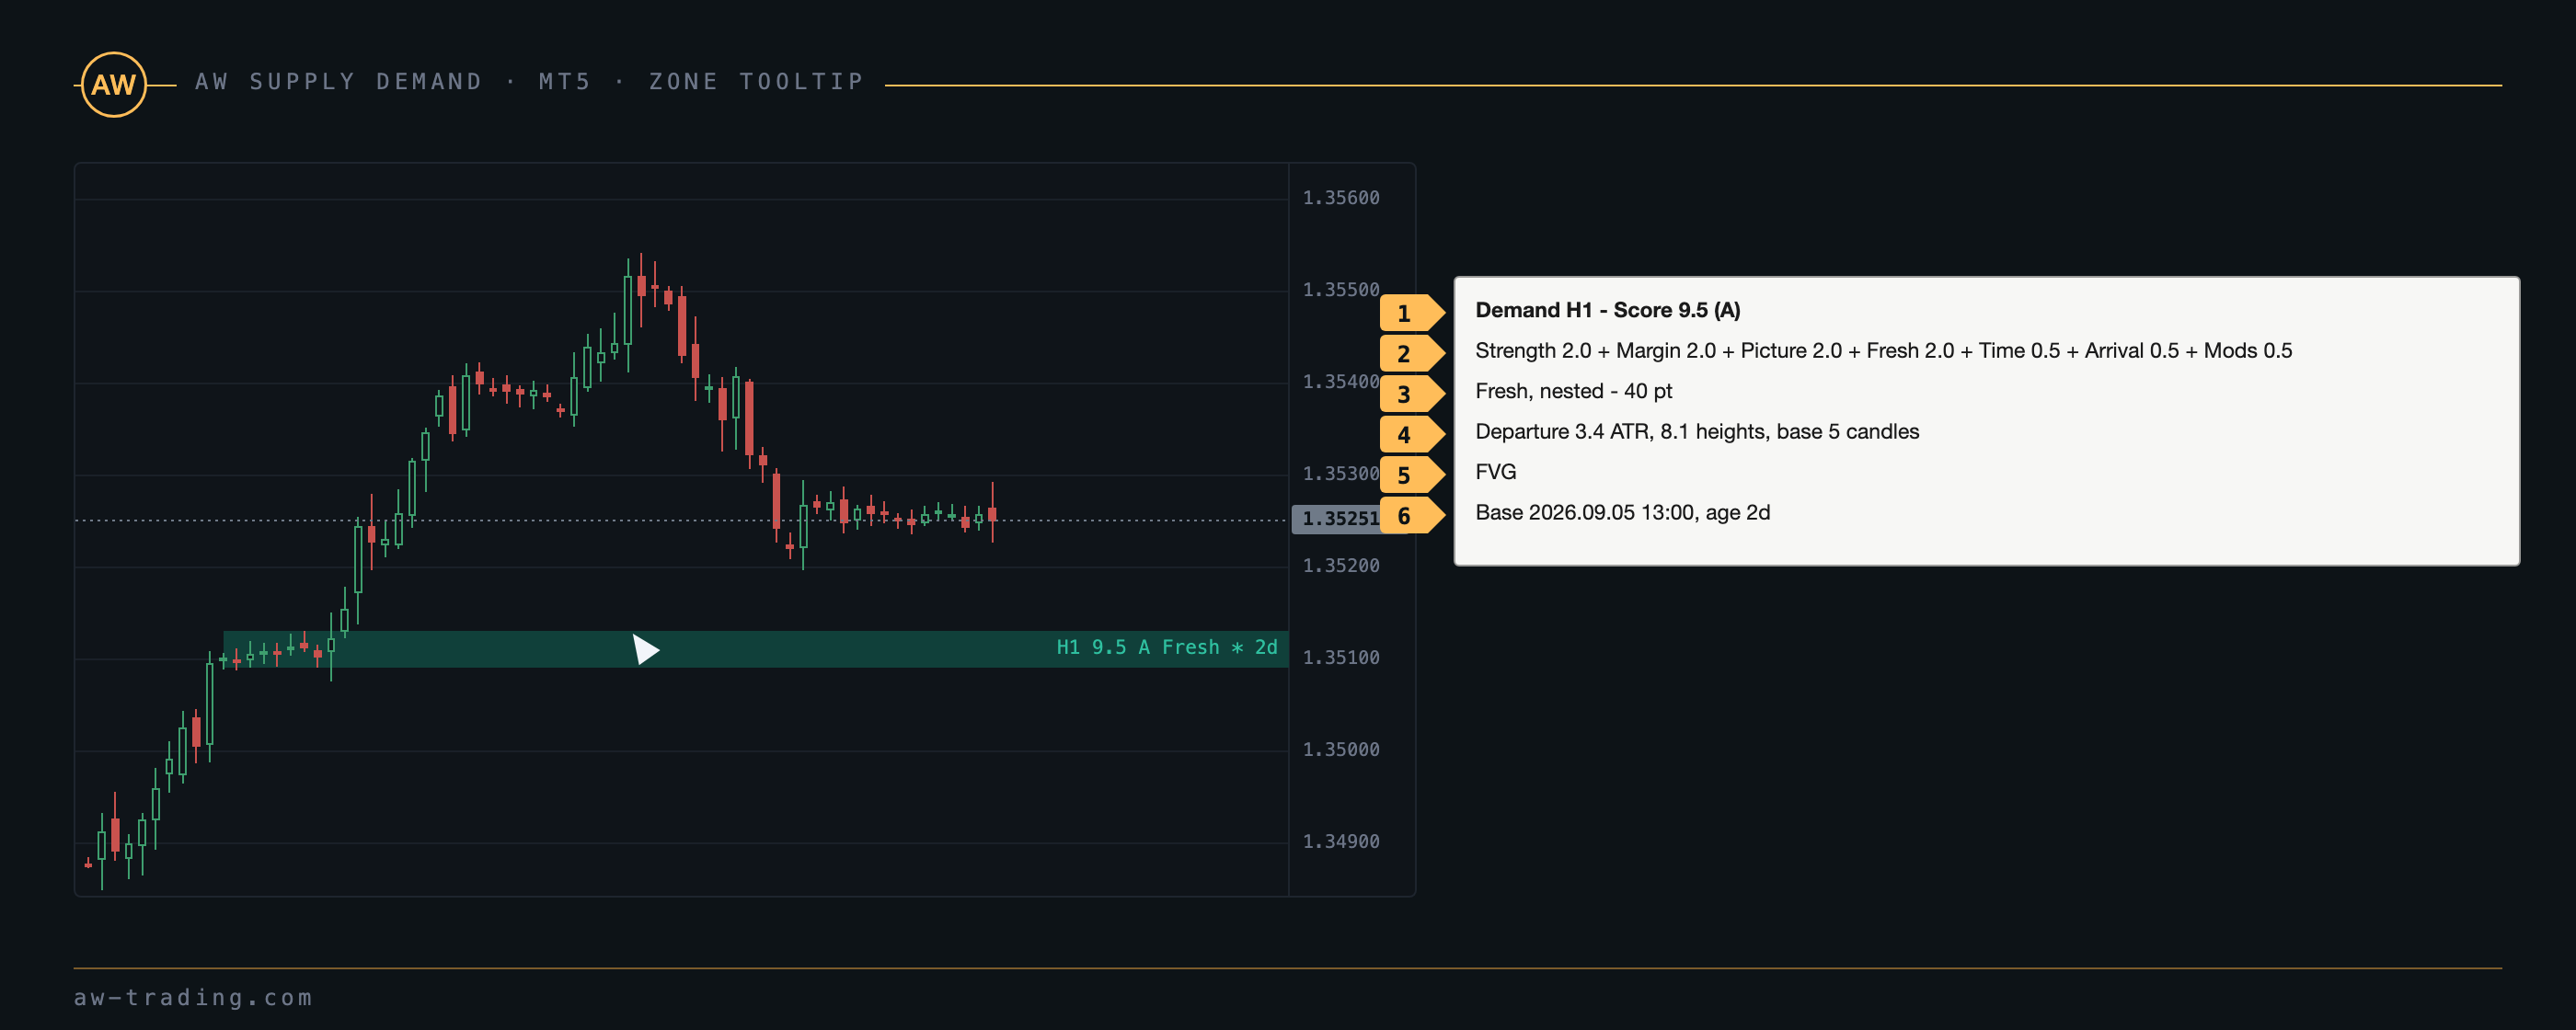
| No. | Tooltip line |
|---|---|
| 1 | Zone type, timeframe, score and grade. |
| 2 | The score components. The Mods bonuses are shown only when there are any. |
| 3 | State, the nesting mark, the zone height in points. A flipped zone shows its original type, a clipped one carries the word clipped. |
| 4 | The departure in ATR and in zone heights, the number of candles in the base. |
| 5 | The bonuses in words: reversal pattern, FVG, liquidity sweep. |
| 6 | The time of the first base candle and the age of the zone. |
3. The panel
The panel sits in the upper left corner of the chart. It carries no controls, only readings in four blocks and two window buttons.
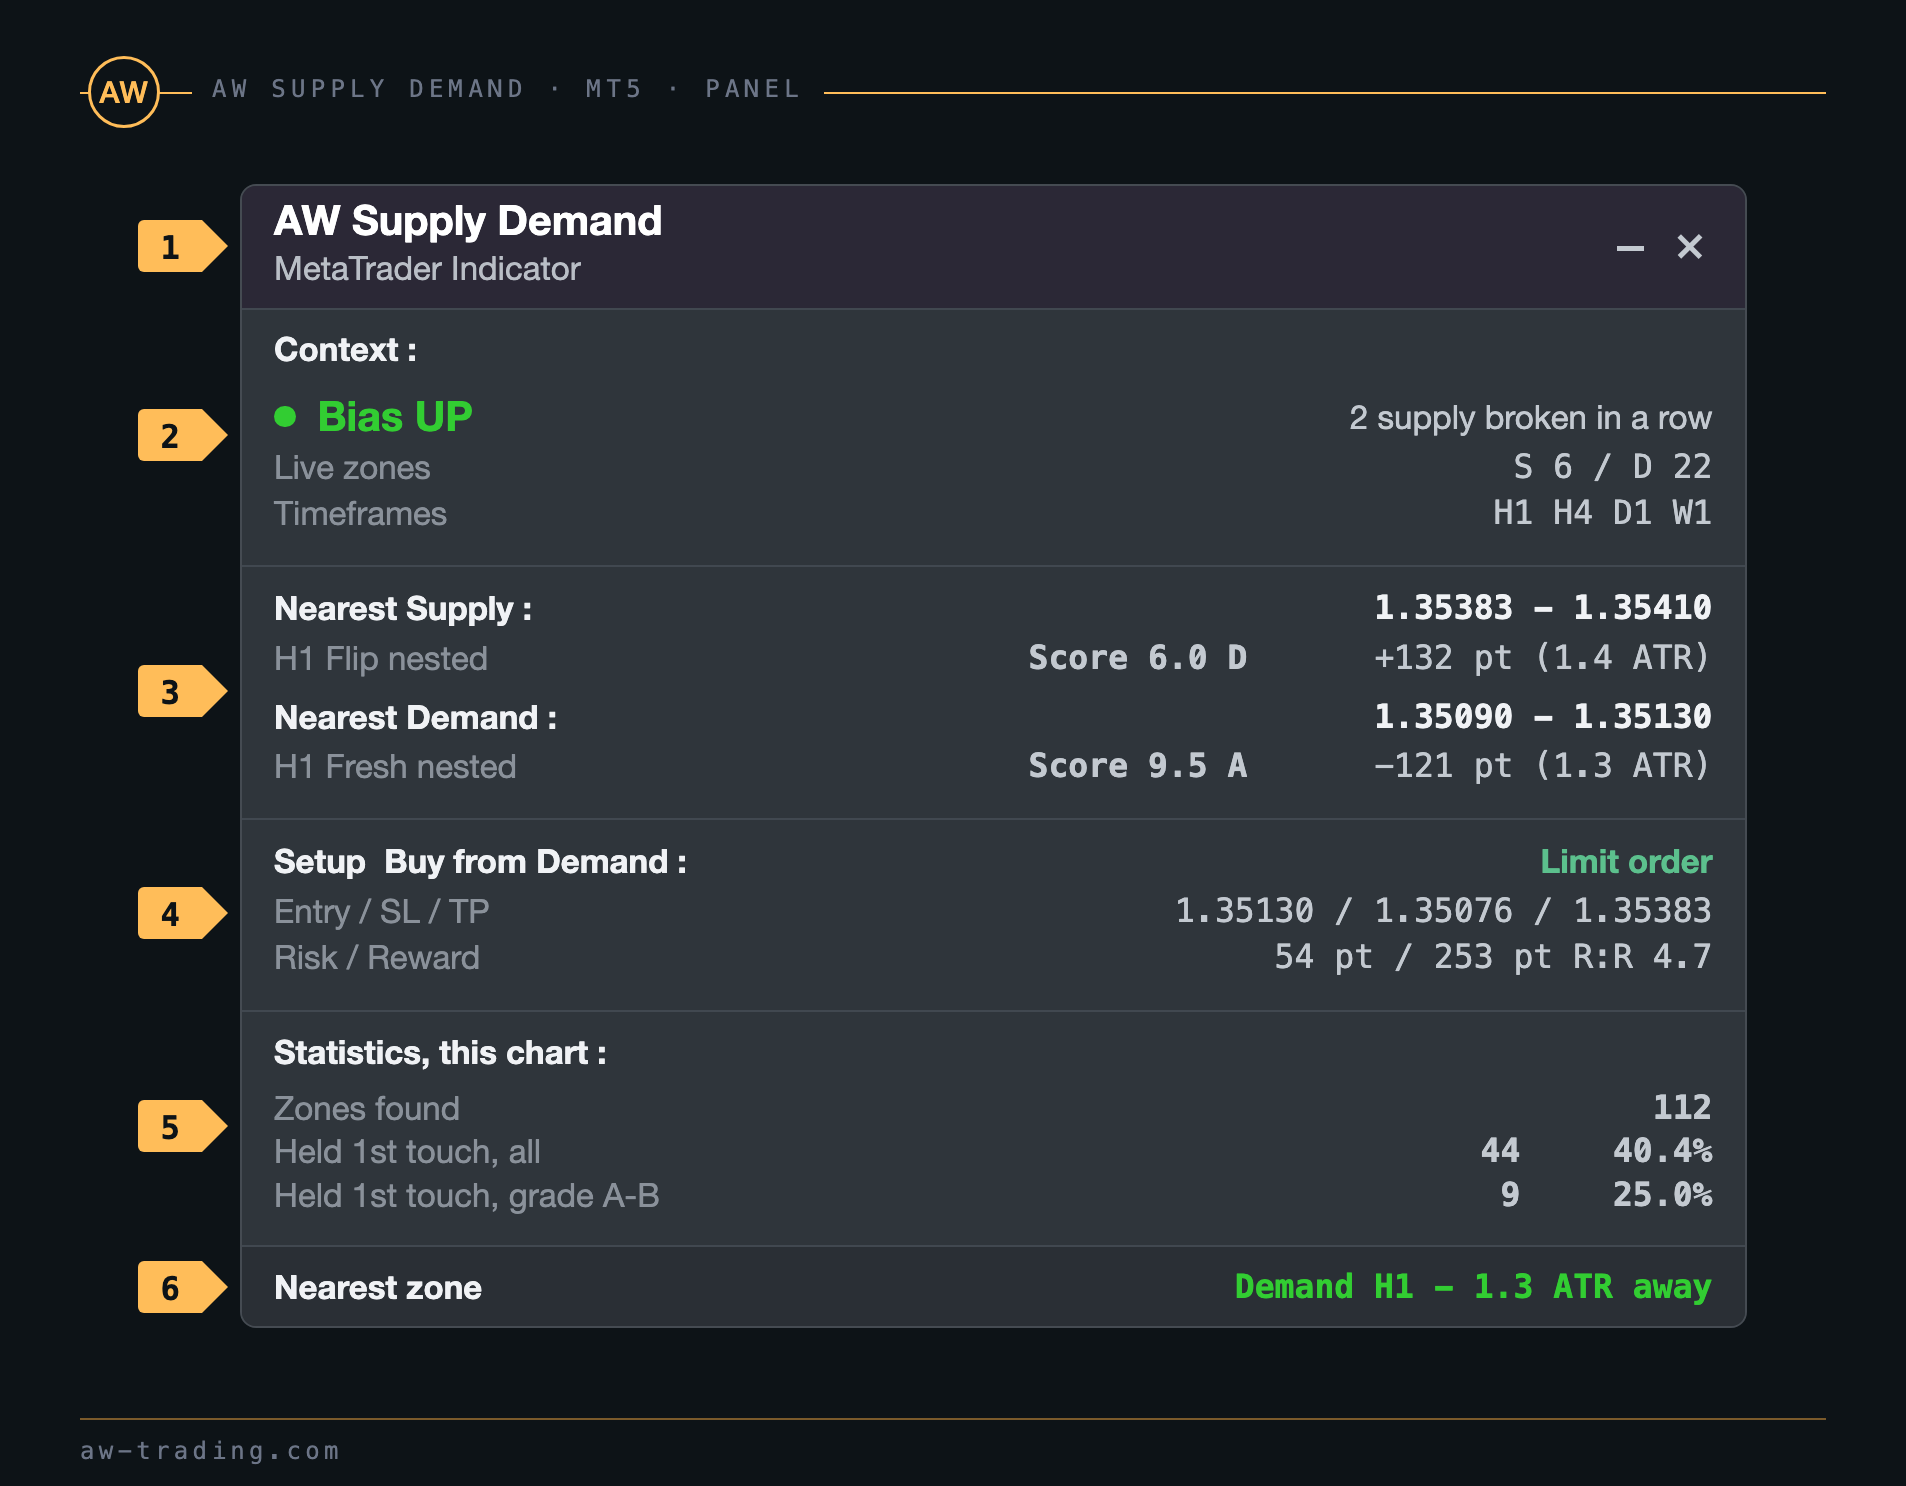
| No. | Panel block |
|---|---|
| 1 | The header and the window buttons. The bar collapses the panel into a pill showing the nearest zone, the cross removes the indicator from the chart after a confirming second click. In the strategy tester the cross does not work and the panel is hidden with the bar. |
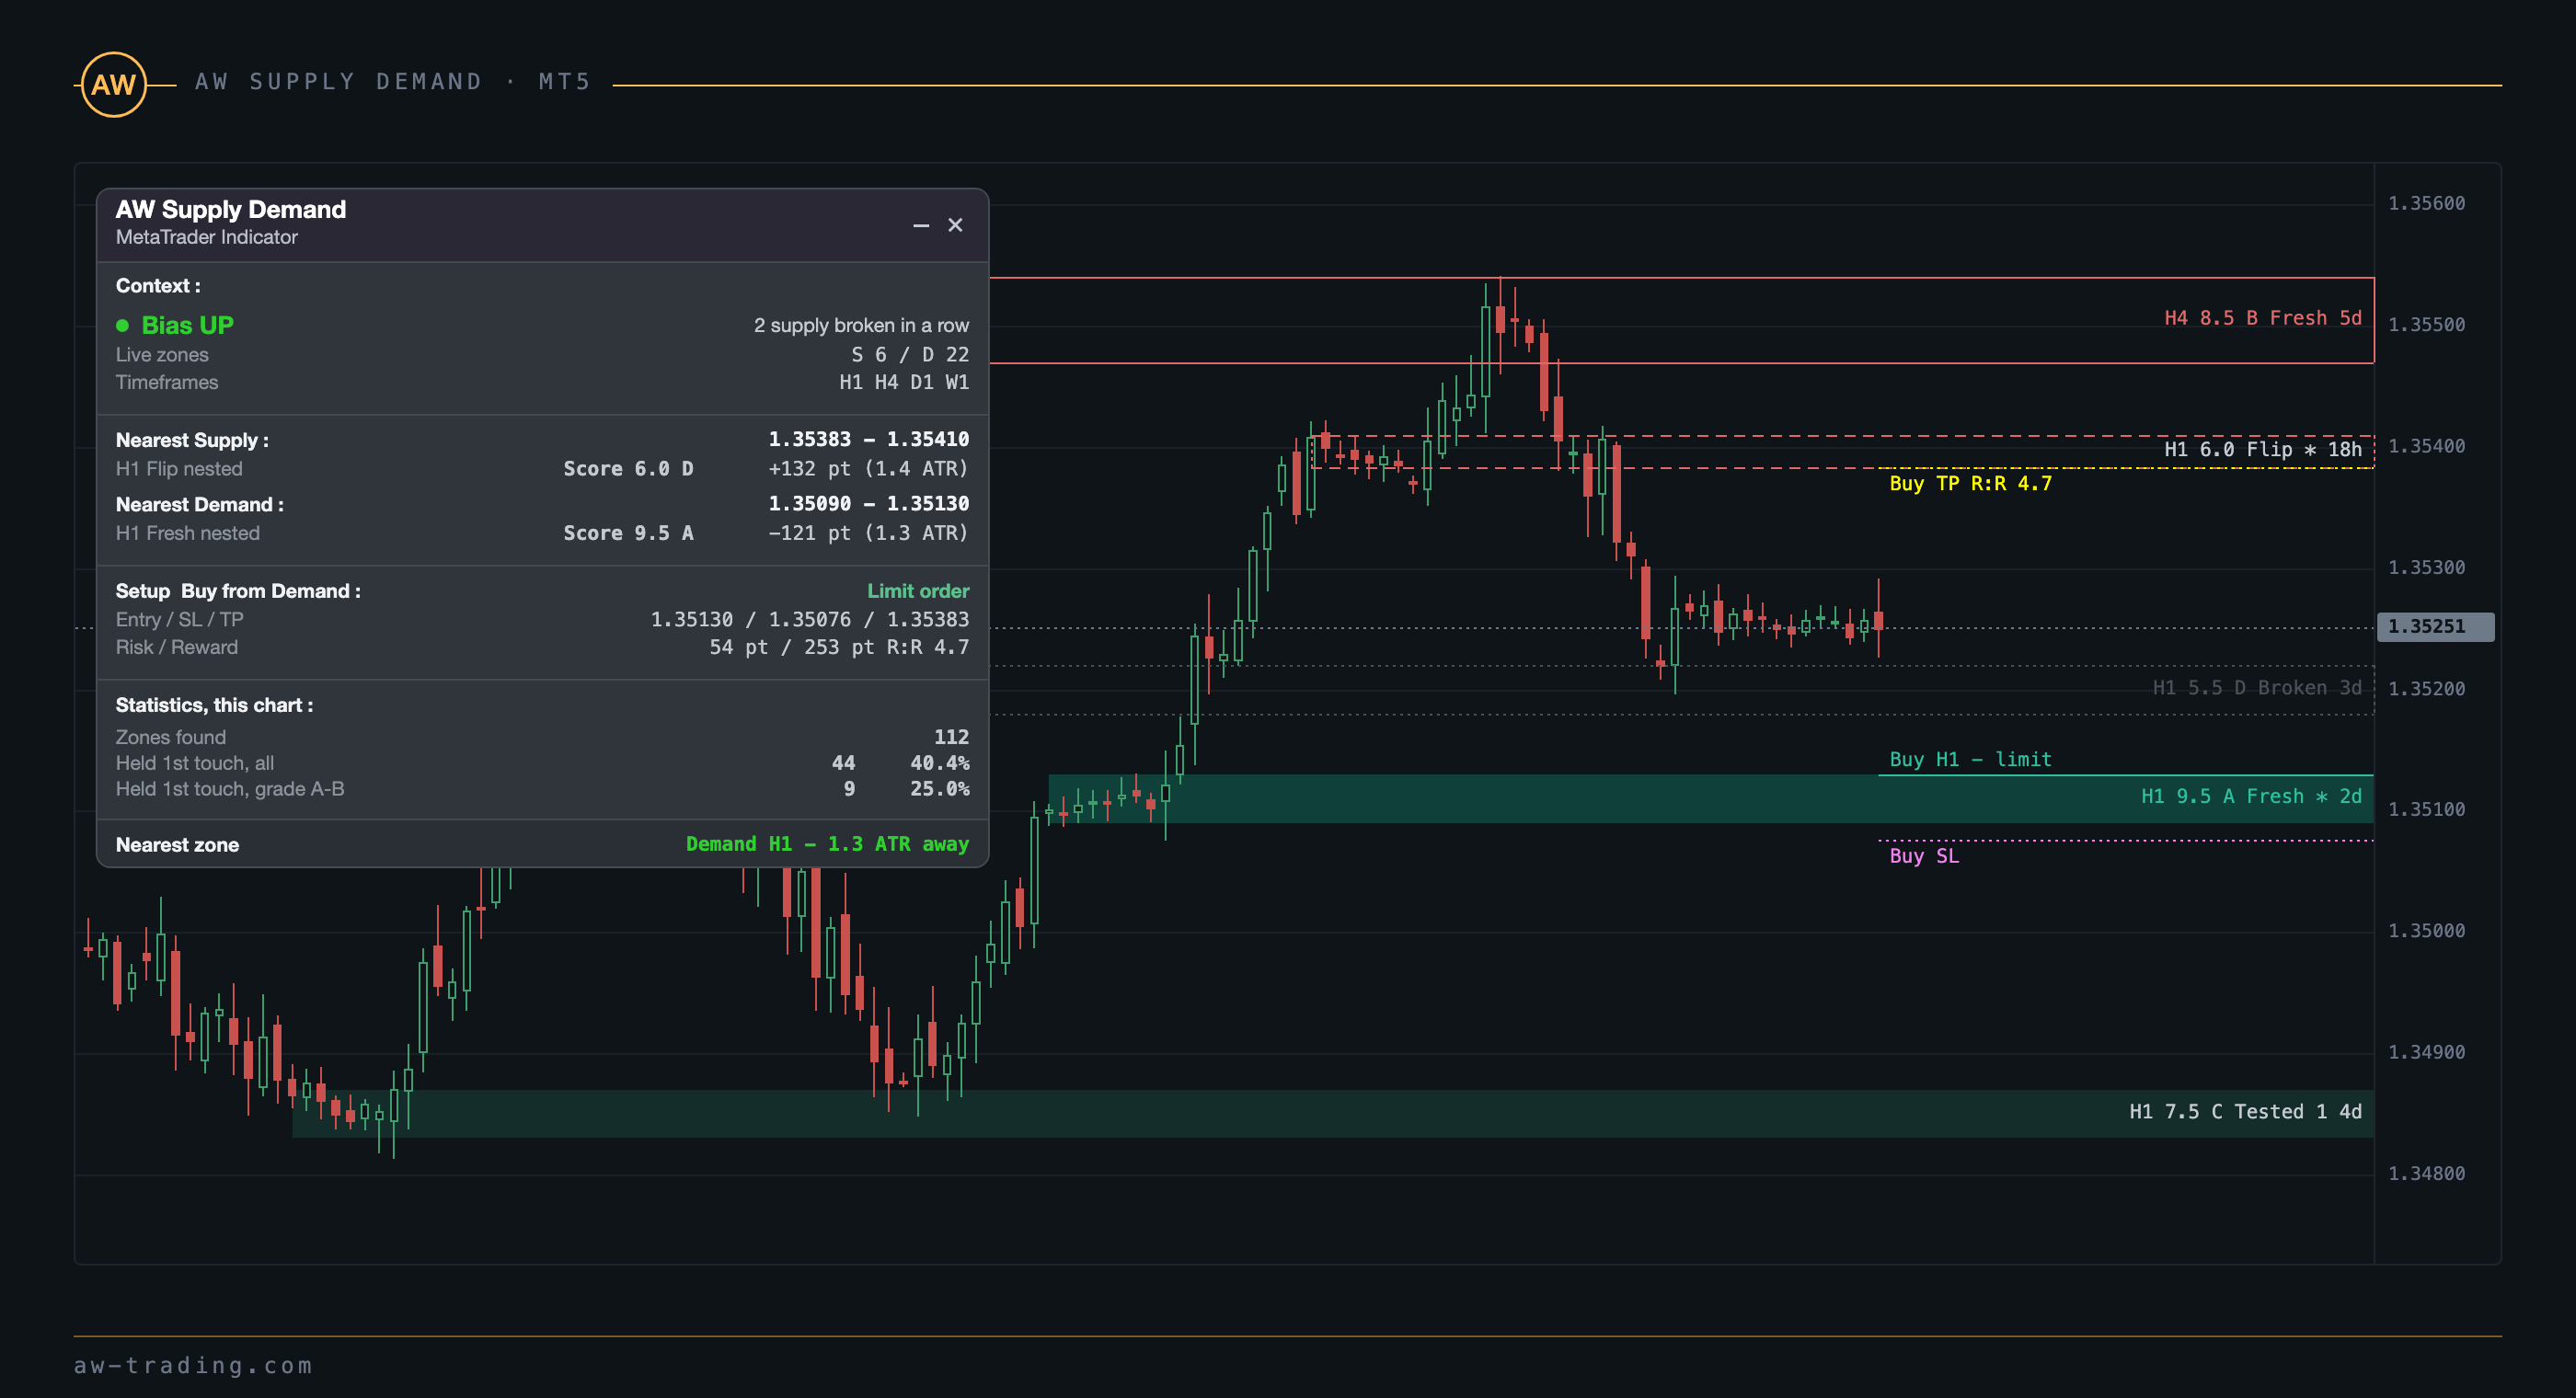
| 2 | Context. Bias comes from the structure of the chart timeframe: supply zones broken in a row give UP, demand zones broken in a row give DOWN, and the number of consecutive breaks is shown on the right. Below are Live zones, the number of live zones above the display threshold on both sides, and Timeframes, the timeframes in use. |
| 3 | Nearest Supply and Nearest Demand. The boundaries of the nearest zone of each type, its timeframe and state, the score with the grade, and the distance from price to the near boundary in points and in ATR of the chart timeframe. |
| 4 | Setup. The zone worth trading and the verdict based on its score: Limit order, Confirm entry or Skip. The Entry / SL / TP levels, risk and reward in points, Risk / Reward. |
| 5 | Statistics, this chart. Zones found, the number of zones found on the chart timeframe, and Held 1st touch, the share of zones that held the first touch, separately for grades A and B at the moment of the first touch. |
| 6 | Nearest zone. The closest zone by distance, in the color of its type. The same line stays in the collapsed pill. |
How the panel picks the setup zone. A zone of grade A or B outranks a zone of grade C or D. When both zones are on the same level, the zone in the direction of Bias is taken. With no Bias, the nearer zone is taken. The Nearest zone line at the bottom of the panel follows a different rule, it always shows the closest zone by distance, so the setup and the footer can point at different zones.
How the statistics are counted. A first touch counts as held when the visit ended without a break: price moved away from the zone by its height or by Bars outside to end a visit bars. Only zones of the chart timeframe within Maximum bars of history are counted.
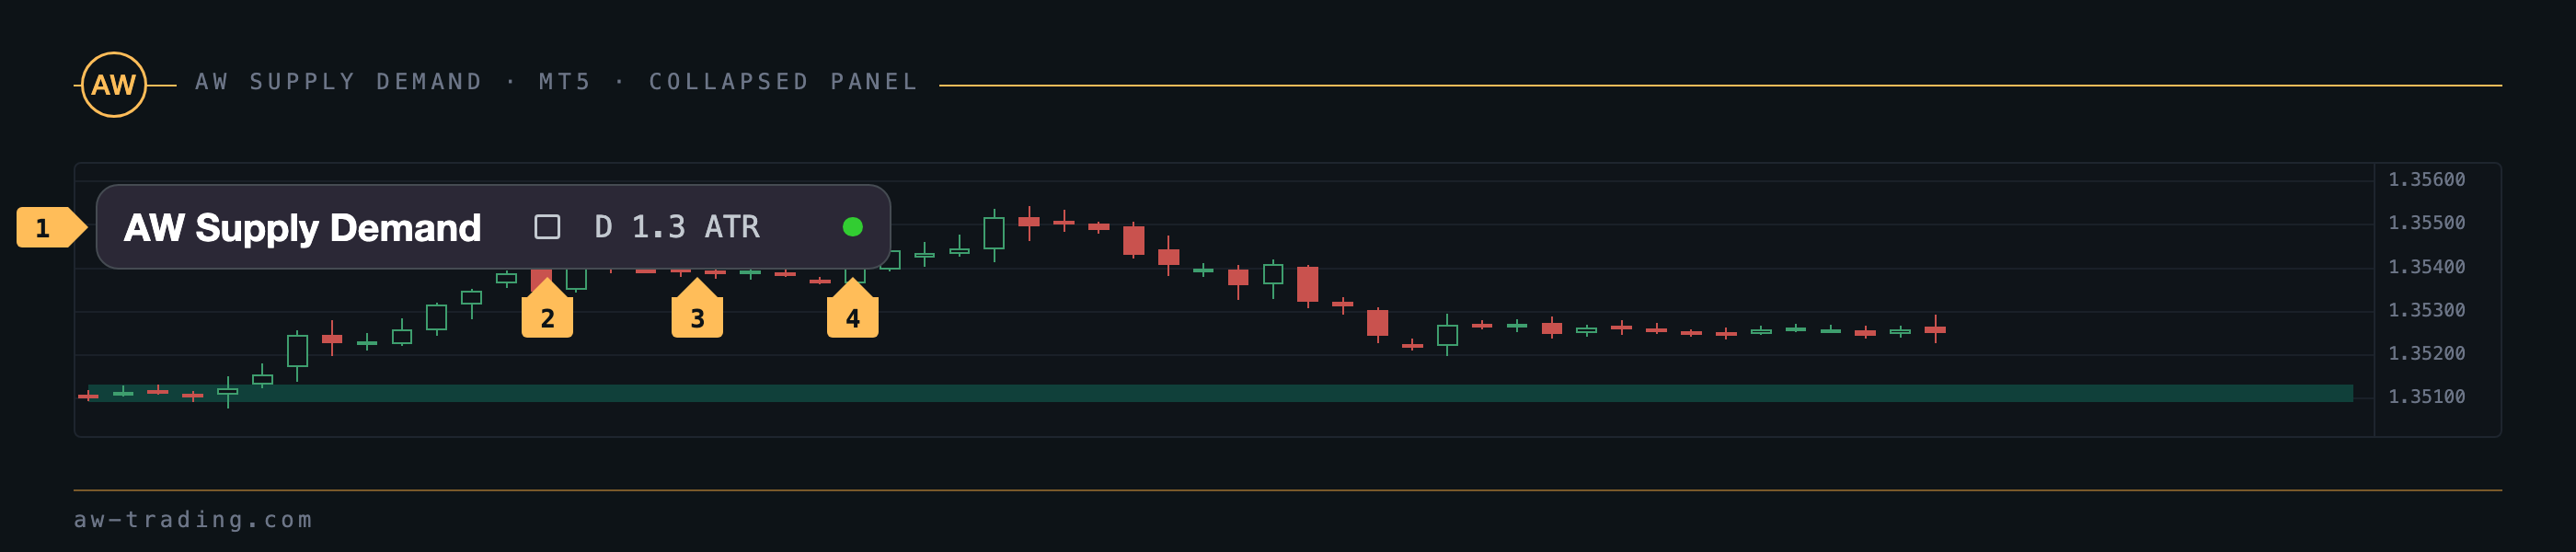
| No. | Pill |
|---|---|
| 1 | The logo. The pill sits in place of the panel and does not cover the chart. |
| 2 | The button that expands the panel back. |
| 3 | The nearest zone: D for demand or S for supply, the distance in ATR or the word inside when price is inside the zone. |
| 4 | The Bias LED: green UP, red DOWN, grey for no direction. The LED is not a trade signal. |
4. How to buy
Entry with a limit order from an A zone
Step 1 - The Setup line of the panel reads Buy from Demand with the Limit order verdict. This means the nearest demand zone scored 9 or above.
Step 2 - The buy limit order goes to the near boundary of the zone, which is the Entry value in the panel and the entry line on the chart.
Step 3 - StopLoss goes beyond the far boundary of the zone with a buffer of Stop loss buffer beyond the zone, ATR. The buffer is never smaller than the current spread. This is the SL value in the panel.
Step 4 - TakeProfit goes to the near boundary of the nearest supply zone on any enabled timeframe. This is the TP value in the panel, with the Risk / Reward ratio shown next to it.
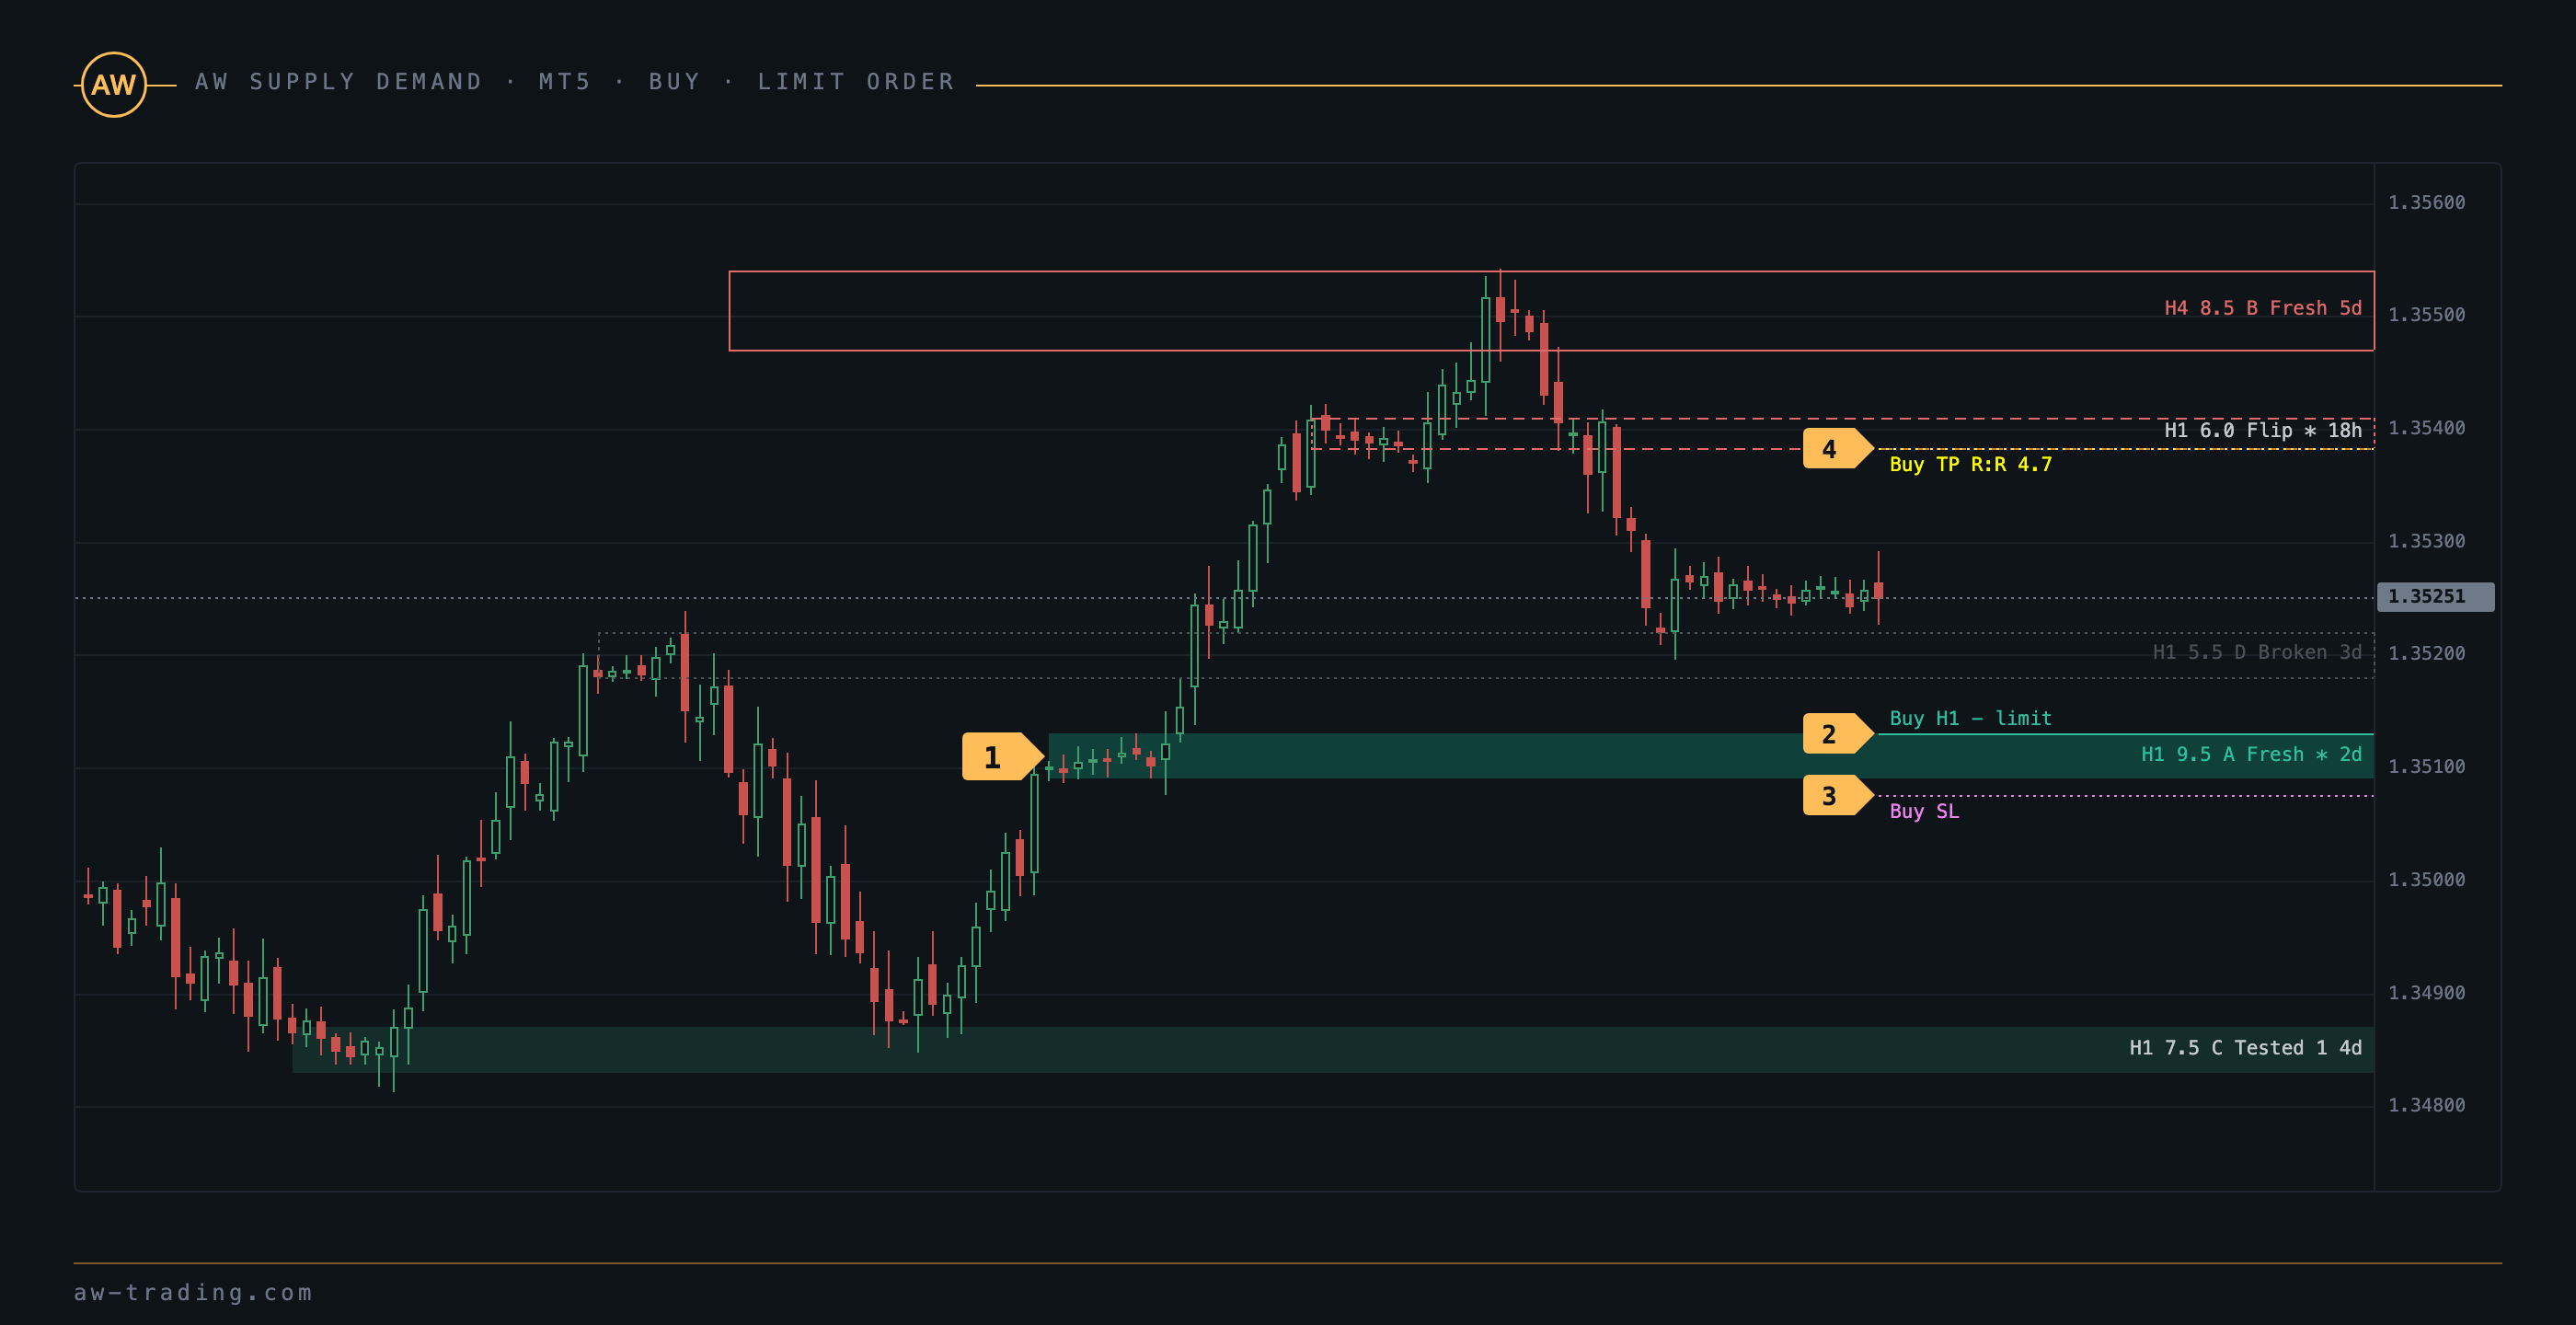
| No. | On the chart |
|---|---|
| 1 | A fresh demand zone with a score of 9.5 and grade A, nested inside a higher timeframe zone. |
| 2 | The entry line at the near boundary of the zone, labelled Buy H1 - limit. |
| 3 | StopLoss beyond the far boundary with a buffer in ATR. |
| 4 | TakeProfit at the near boundary of the opposing supply zone, with Risk / Reward in the label. |
Entry on confirmation from a B zone
Step 1 - The Setup line reads the Confirm entry verdict. The nearest demand zone scored between 8 and 9, so no limit order is placed from it.
Step 2 - The setup waits for price to enter the zone and for a reversal candle: an engulfing candle, or a pin bar whose lower wick is twice the body and whose close falls in the upper third of the range. The candle has to close above the near boundary of the zone. A REVERSAL notification is sent for this event.
Step 3 - Entry with a market order at the close of the reversal candle. StopLoss beyond the far boundary of the zone, TakeProfit at the TP value from the panel.
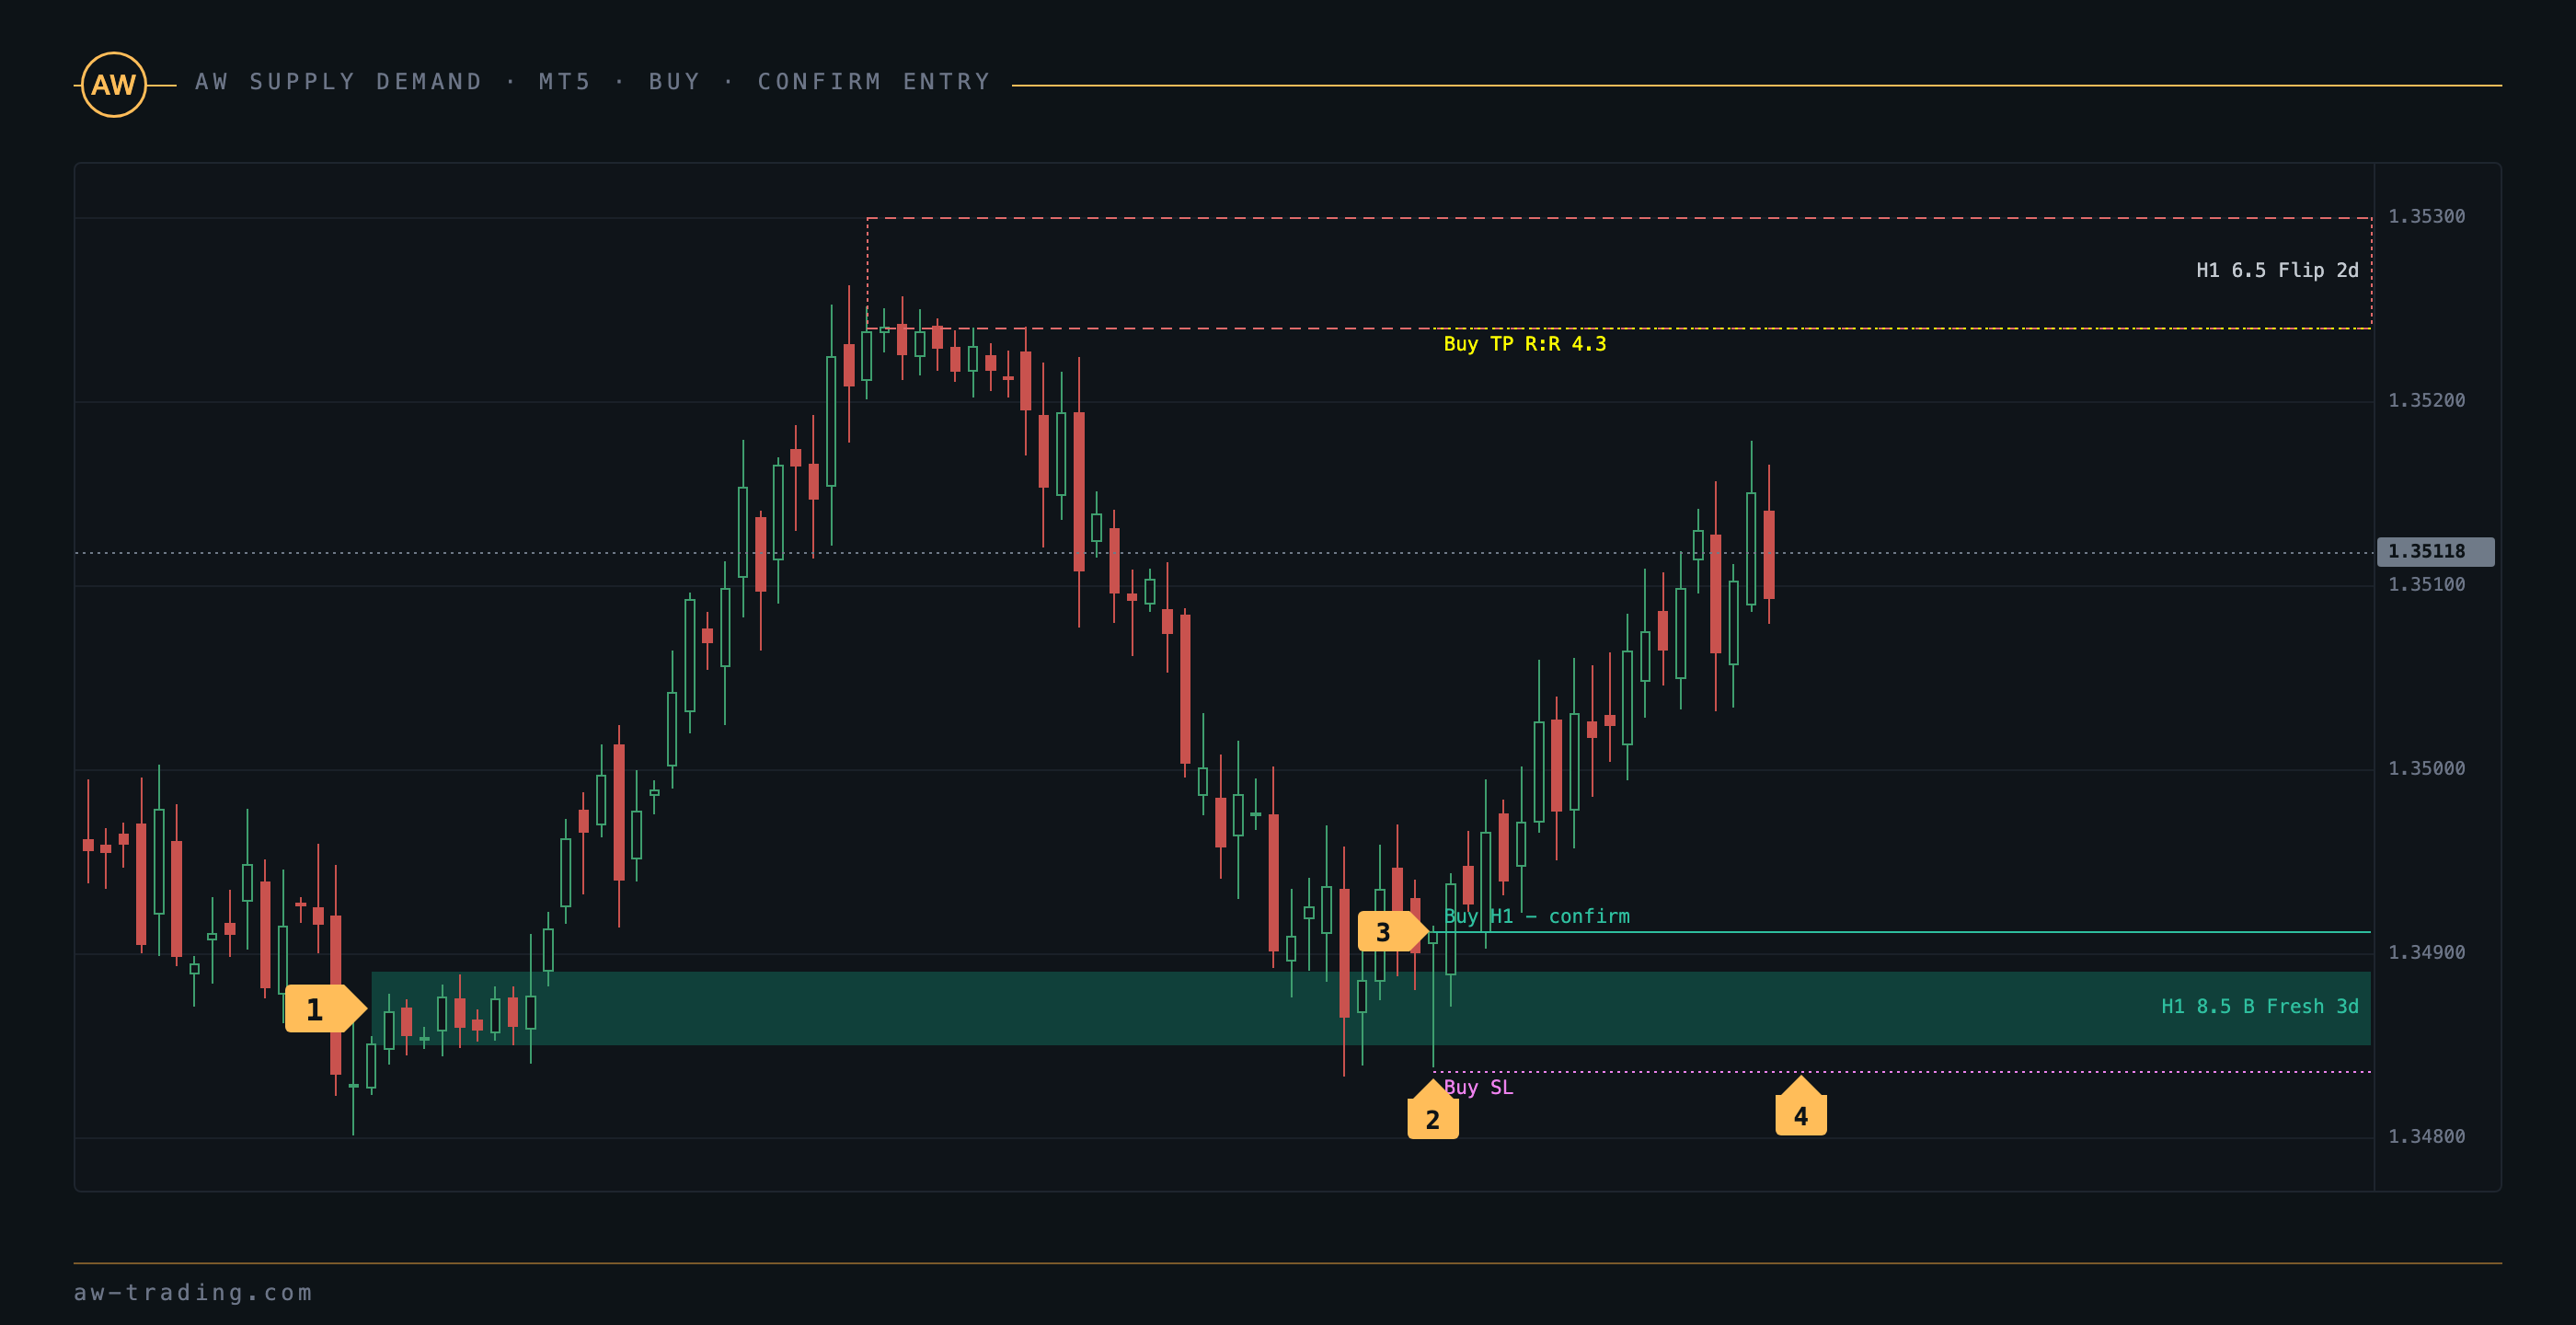
| No. | On the chart |
|---|---|
| 1 | A fresh demand zone with a score of 8.5 and grade B. |
| 2 | A reversal candle inside the zone: a long lower wick, a close above the near boundary. |
| 3 | Entry at the close of the reversal candle. |
| 4 | StopLoss beyond the far boundary of the zone with a buffer. |
Exit strategies
Strategy 1: the whole position is closed at TP, that is, at the near boundary of the opposing zone.
Strategy 2: half of the position is closed at TP, and the rest is carried to the near boundary of the next opposing higher timeframe zone with the stop behind the flipped zone.
Strategy 3: the position is closed on an event: a break of its own zone by a bar close, or a reversal candle from the opposing zone, both situations arriving as the BREAK and REVERSAL notifications.
The Skip verdict means the nearest zone scored below 8. Such a zone is shown in the panel and on the chart, its level lines are drawn in grey, and the indicator proposes no trade from it.
5. How to sell
Selling mirrors buying: the supply zone lies above price, entry is measured from its lower boundary, the stop goes above the upper boundary, and the target is the near boundary of the nearest demand zone.
Step 1 - The Setup line reads Sell from Supply with either the Limit order or the Confirm entry verdict.
Step 2 - With Limit order, the sell limit order goes to the near boundary of the zone, the Entry value. With Confirm entry, the setup waits for a reversal candle inside the zone closing below the near boundary: a bearish engulfing candle or a pin bar with a long upper wick.
Step 3 - StopLoss above the far boundary of the zone with a buffer, the SL value.
Step 4 - TakeProfit at the near boundary of the nearest demand zone on any enabled timeframe, the TP value. The exit strategies are the same as for buying.
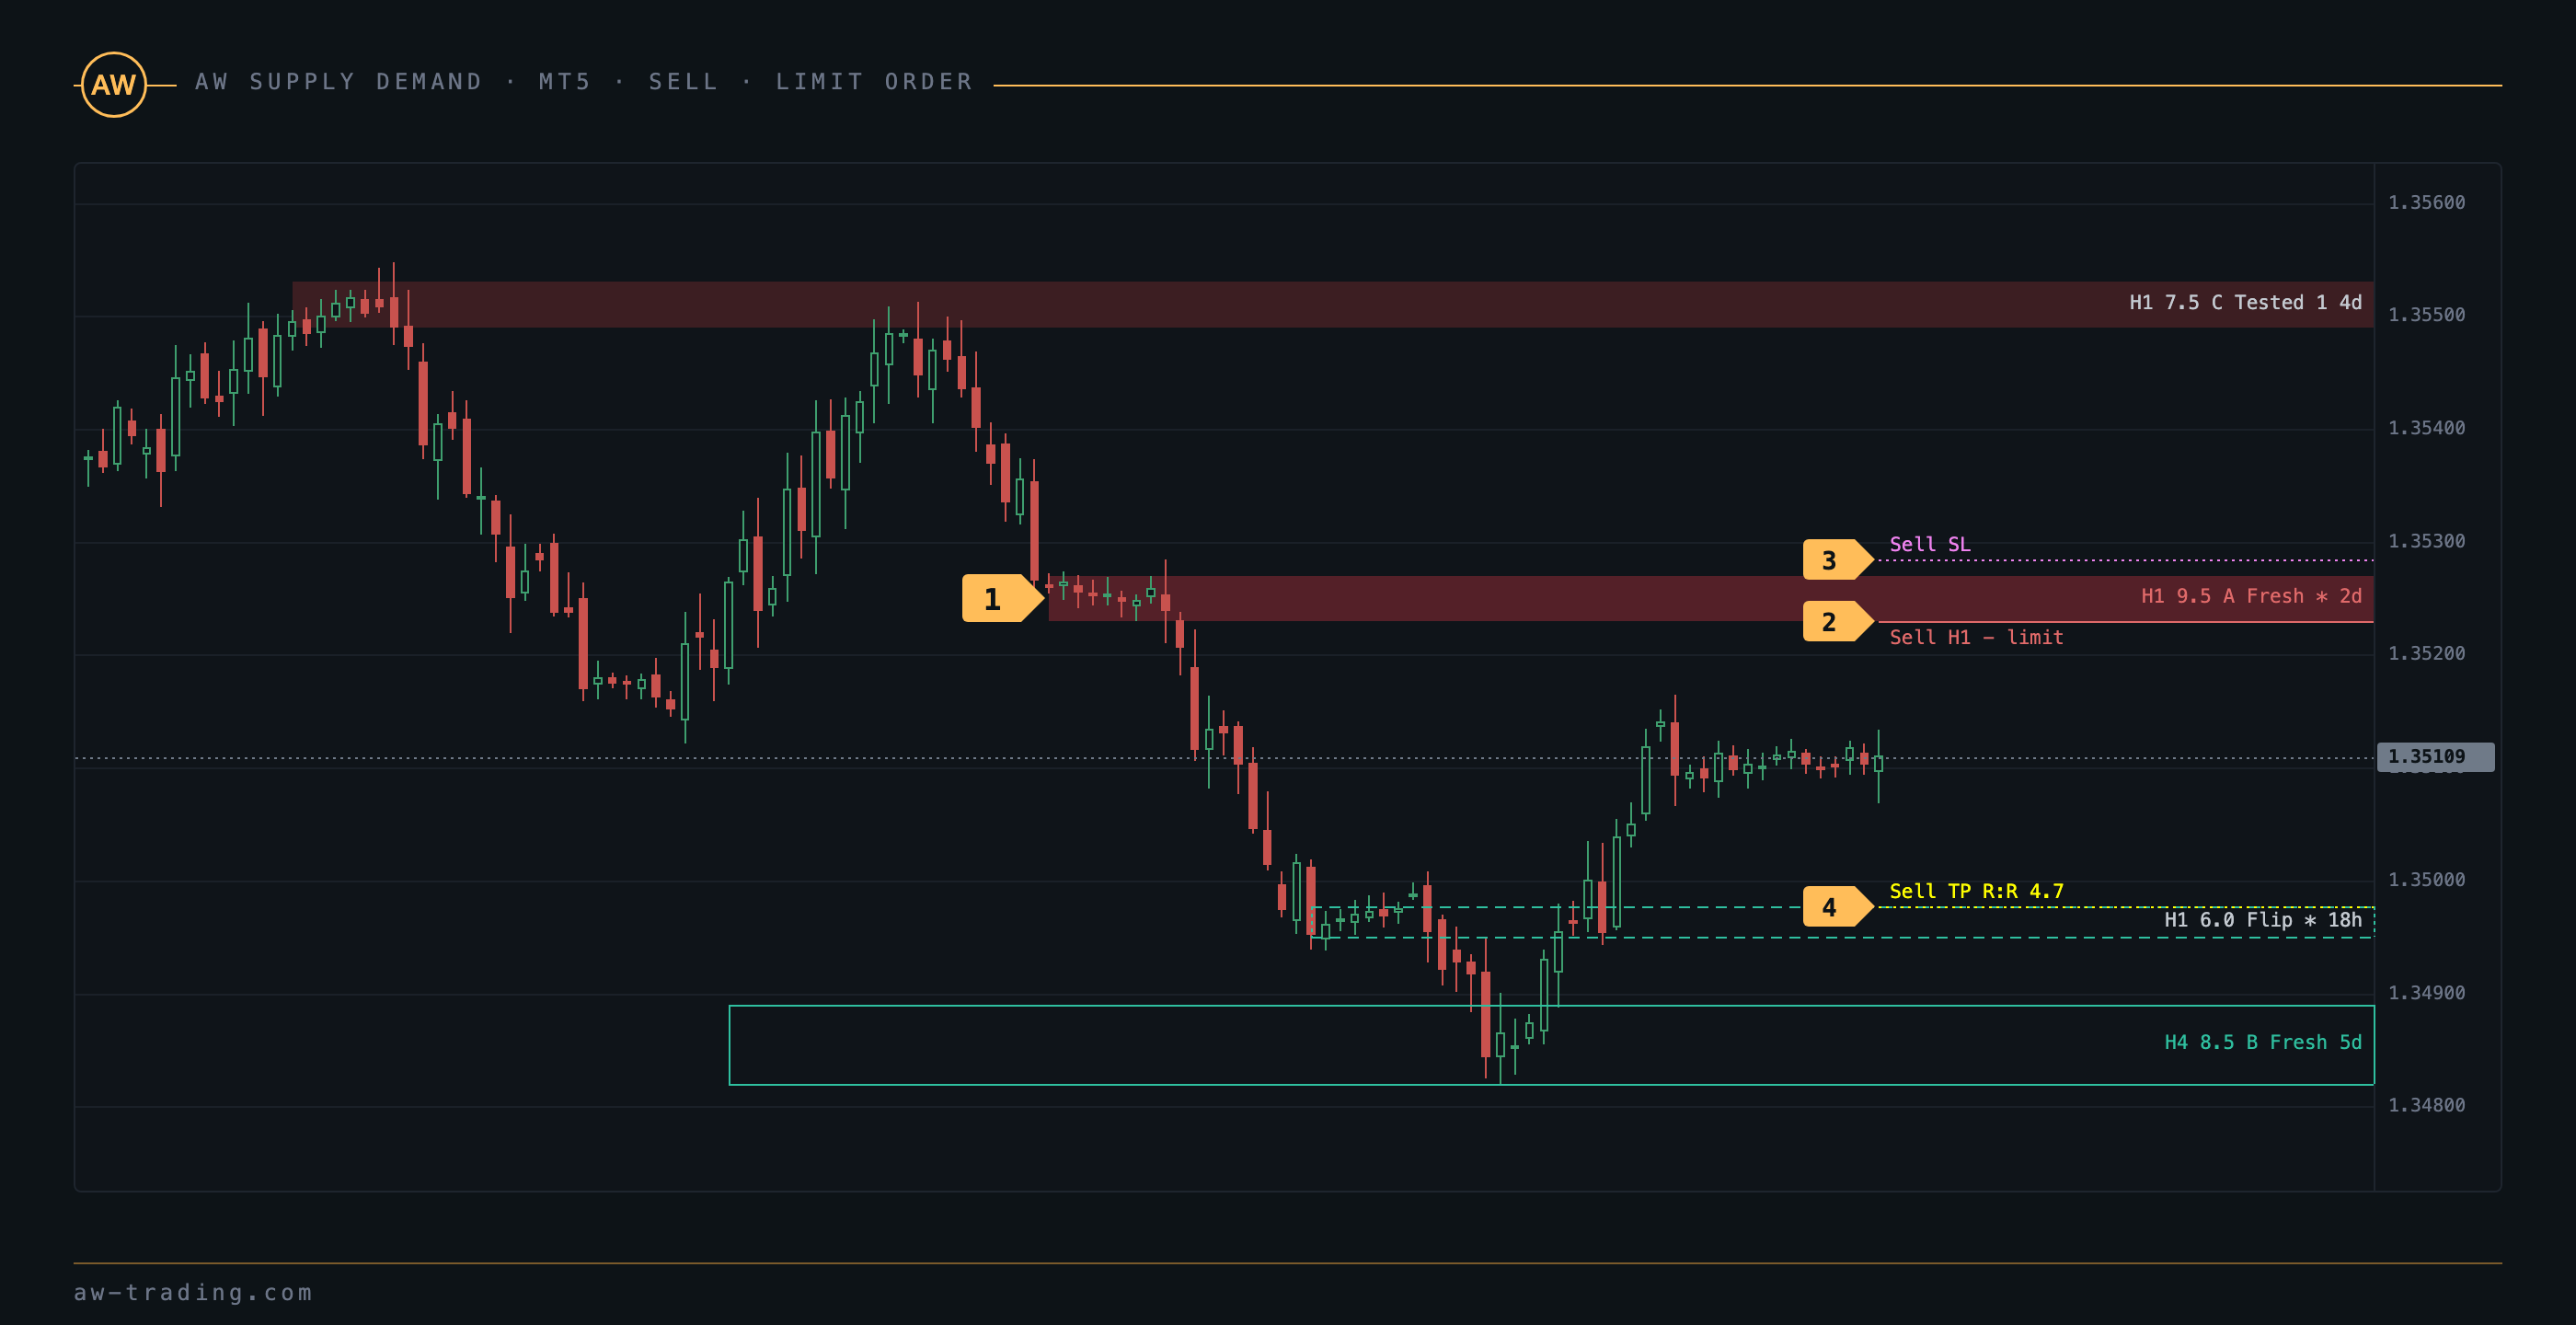
| No. | On the chart |
|---|---|
| 1 | A fresh supply zone with a score of 9.5 and grade A. |
| 2 | The entry line at the lower boundary of the zone, labelled Sell H1 - limit. |
| 3 | StopLoss above the far boundary with a buffer in ATR. |
| 4 | TakeProfit at the near boundary of the opposing demand zone, with Risk / Reward in the label. |
6. Multi-timeframe use
The indicator calculates zones for up to three higher timeframes and draws them on the chart as outlines. A higher timeframe has to be larger than the chart period and a multiple of it, otherwise the slot is skipped with a record in the Experts log.
Auto mode selects the higher timeframes from the chart period:
| Chart | Higher timeframe 1 | Higher timeframe 2 | Higher timeframe 3 |
|---|---|---|---|
| M1 | M15 | H1 | H4 |
| M2 - M5 | M30 | H4 | D1 |
| M6 - M15 | H1 | H4 | D1 |
| M20 - H1 | H4 | D1 | W1 |
| H2 - H4 | D1 | W1 | MN1 |
| H6 - D1 | W1 | MN1 | none |
Step 1 - The higher timeframe zone sets the direction. A D1 demand zone below price means that only buys are considered on the lower timeframe, and a supply zone means only sells.
Step 2 - A chart timeframe zone lying inside a higher timeframe zone of the same type is marked with an asterisk in its label and with the word nested in the panel. Such a zone earns Picture points and therefore reaches grade A or B more often. Nesting counts only inside a comparable zone: the higher timeframe zone is no taller than ten heights of the lower one.
Step 3 - Entry from the nested lower timeframe zone follows the rules of sections 4 and 5. The stop comes from the lower zone, so the risk is smaller than with an entry from the higher timeframe zone.
Step 4 - The target is the nearest opposing zone on any enabled timeframe, and the panel selects it on its own.
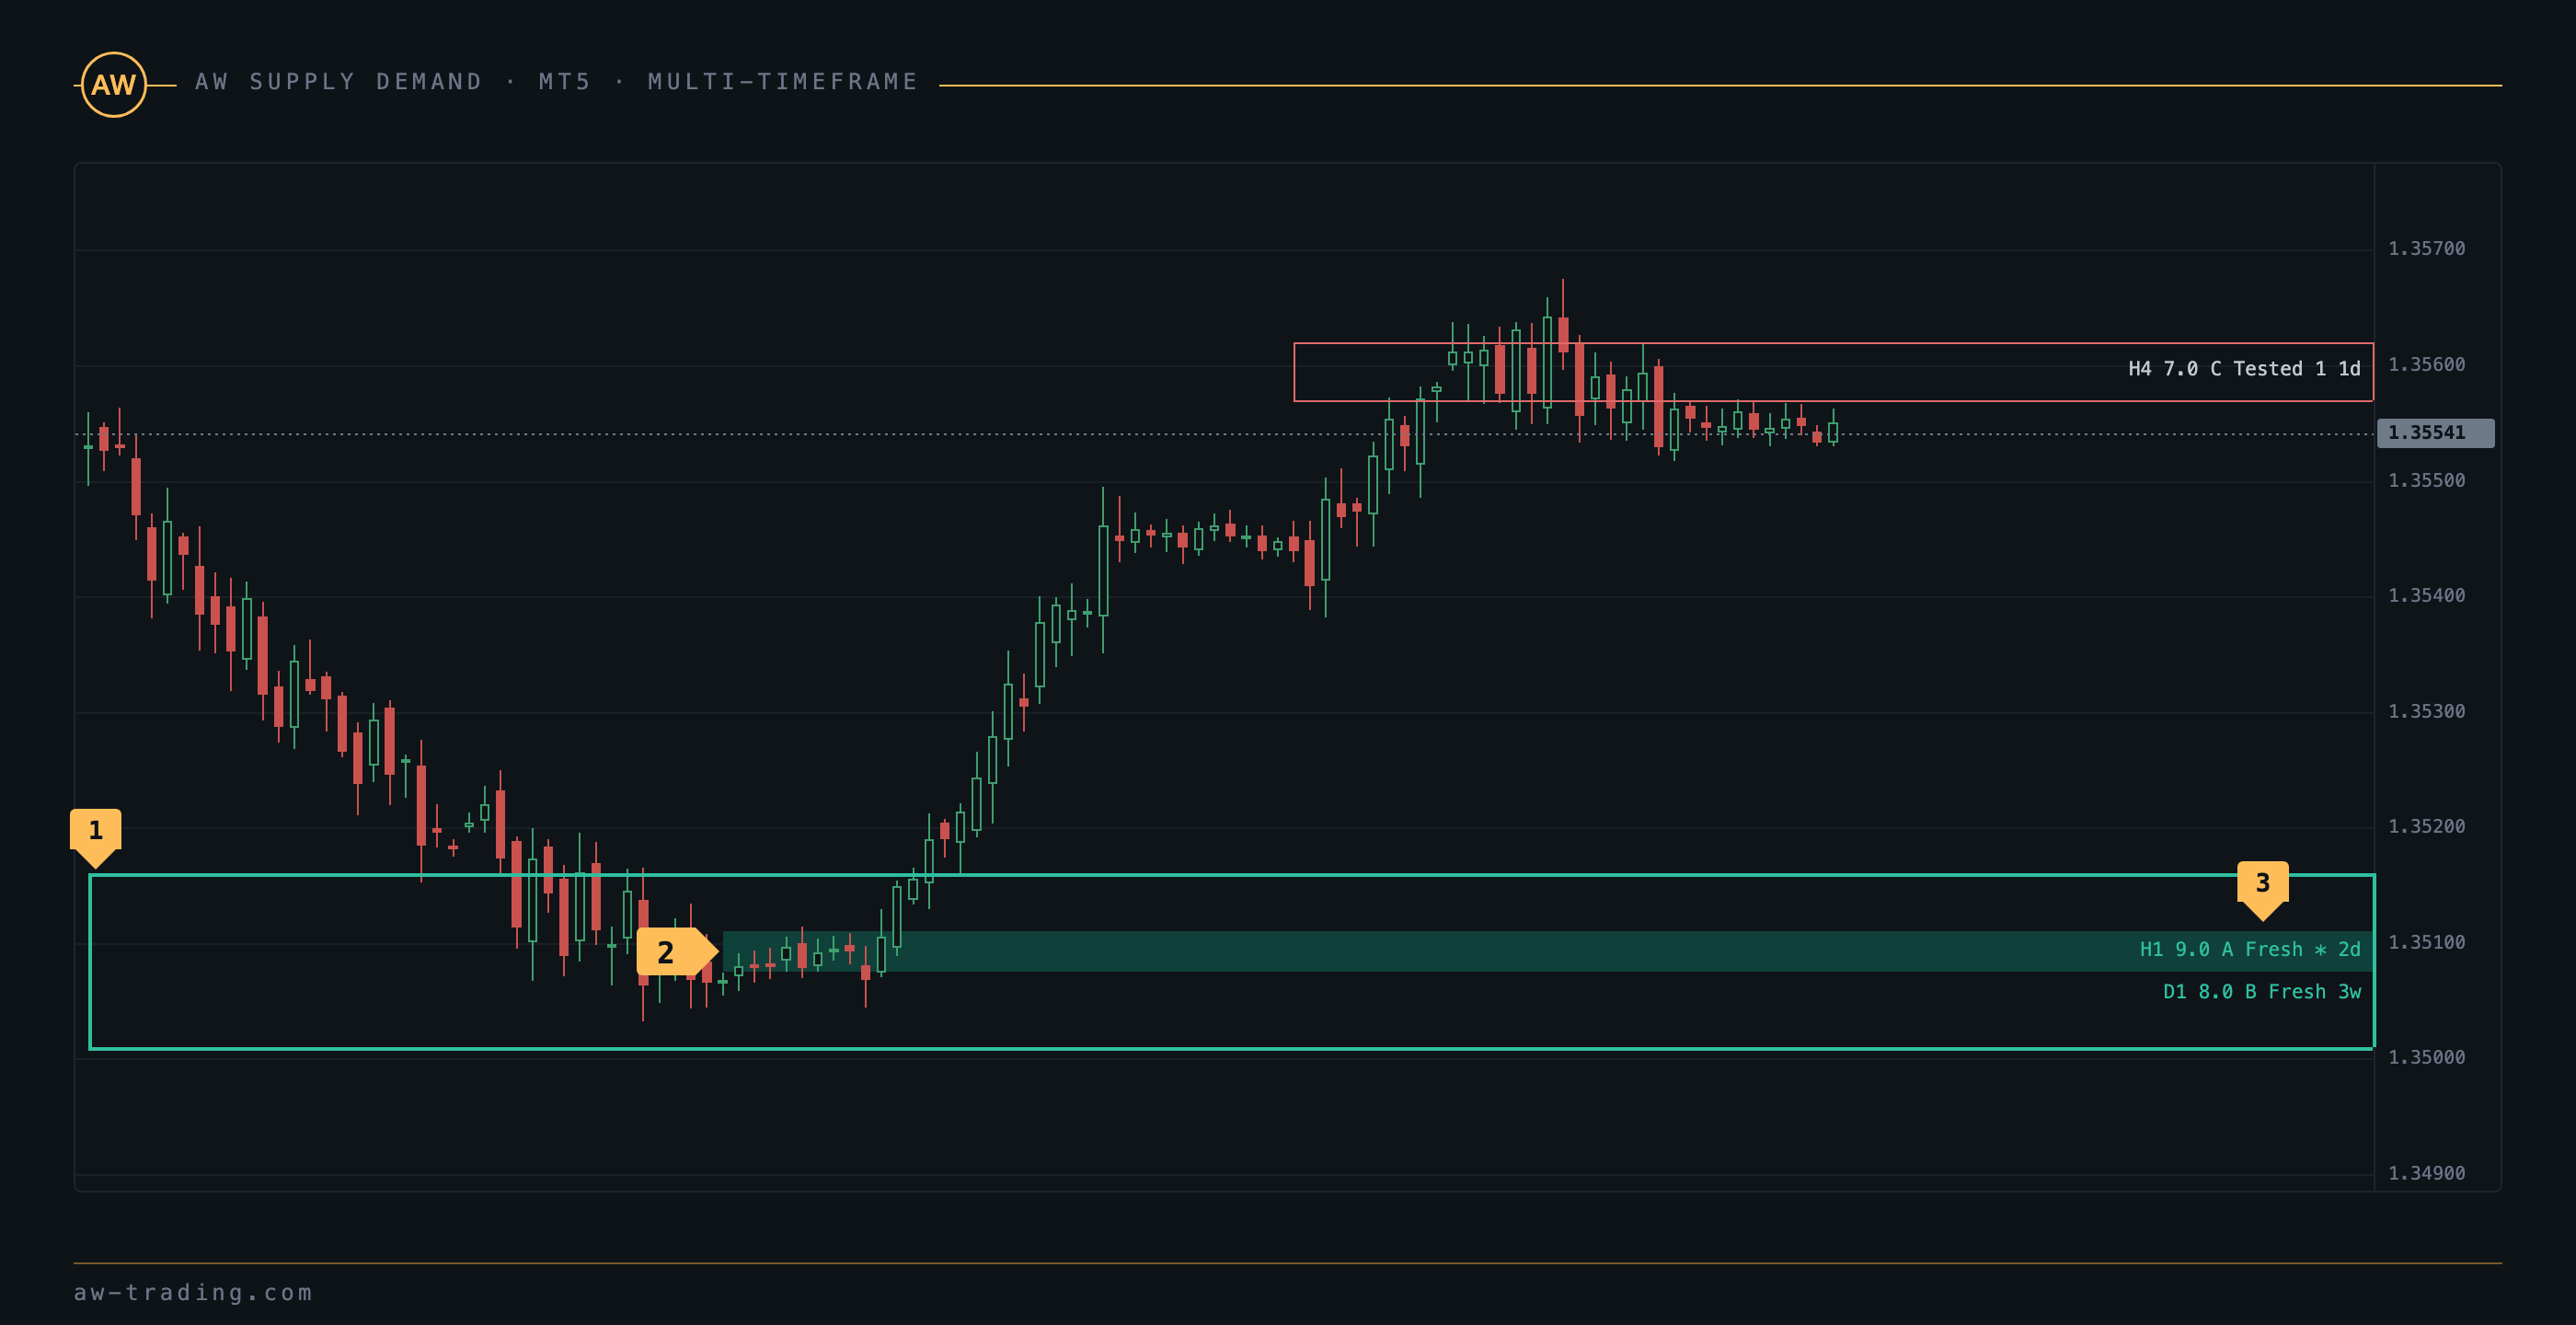
| No. | On the chart |
|---|---|
| 1 | A D1 demand zone: an outline of width 2, without fill, the label in the color of the type. |
| 2 | A fresh H1 demand zone inside the D1 zone. |
| 3 | The label of the nested zone with an asterisk, grade A. |
The H key hides and shows higher timeframe zones. Notifications for higher timeframe zones are enabled by the Alerts for higher timeframe zones variable, and in the notification text such a zone carries its timeframe.
7. Notifications
The indicator sends notifications for seven events. Each one is enabled by its own variable in the NOTIFICATIONS SETTINGS block.
| Event | When it arrives | Variable |
|---|---|---|
| NEW ZONE | The confirmation bar of a new zone has closed. | Alert: new zone |
| APPROACH | Price has come closer to the near boundary of a zone than Approach distance, ATR. Checked on every tick. | Alert: price approaching a zone |
| ENTER | Price has entered a zone. Checked on every tick. | Alert: price entered a zone |
| REVERSAL | A reversal candle has closed inside a zone, with the close back beyond the near boundary. | Alert: reversal candle from a zone |
| BREAK | A bar has closed beyond the far boundary, the zone is broken. | Alert: zone broken |
| FAKE BREAK | A wick puncture of the far boundary with a close back. | Alert: fake breakout |
| FLIP RETEST | The first visit of price to a flipped zone. | Alert: flipped zone retest |
Channels. A pop-up window with sound (Send PopUp Alerts, Play sound alerts, Sound name), a push message to the mobile terminal (Send push notifications), an e-mail (Send mails). Push messages need a MetaQuotes ID set in the terminal: the Tools menu, Options, the Notifications tab. E-mail is set up on the Email tab of the same window.
Filters. Minimum zone score for alerts cuts off weak zones, by default notifications go out only for zones scoring 8 and above. Alerts only for fresh zones keeps untouched zones, Alerts only for nested zones keeps nested ones, Alert direction selects buys only or sells only, and Alerts for higher timeframe zones turns on higher timeframe zones.
Each event is sent once per zone and visit. When the indicator is placed on a chart, history is not sent out, and notifications begin with the first bar closed after the placement. For a flipped zone the APPROACH and ENTER events are not sent, it is handled by the FLIP RETEST event.
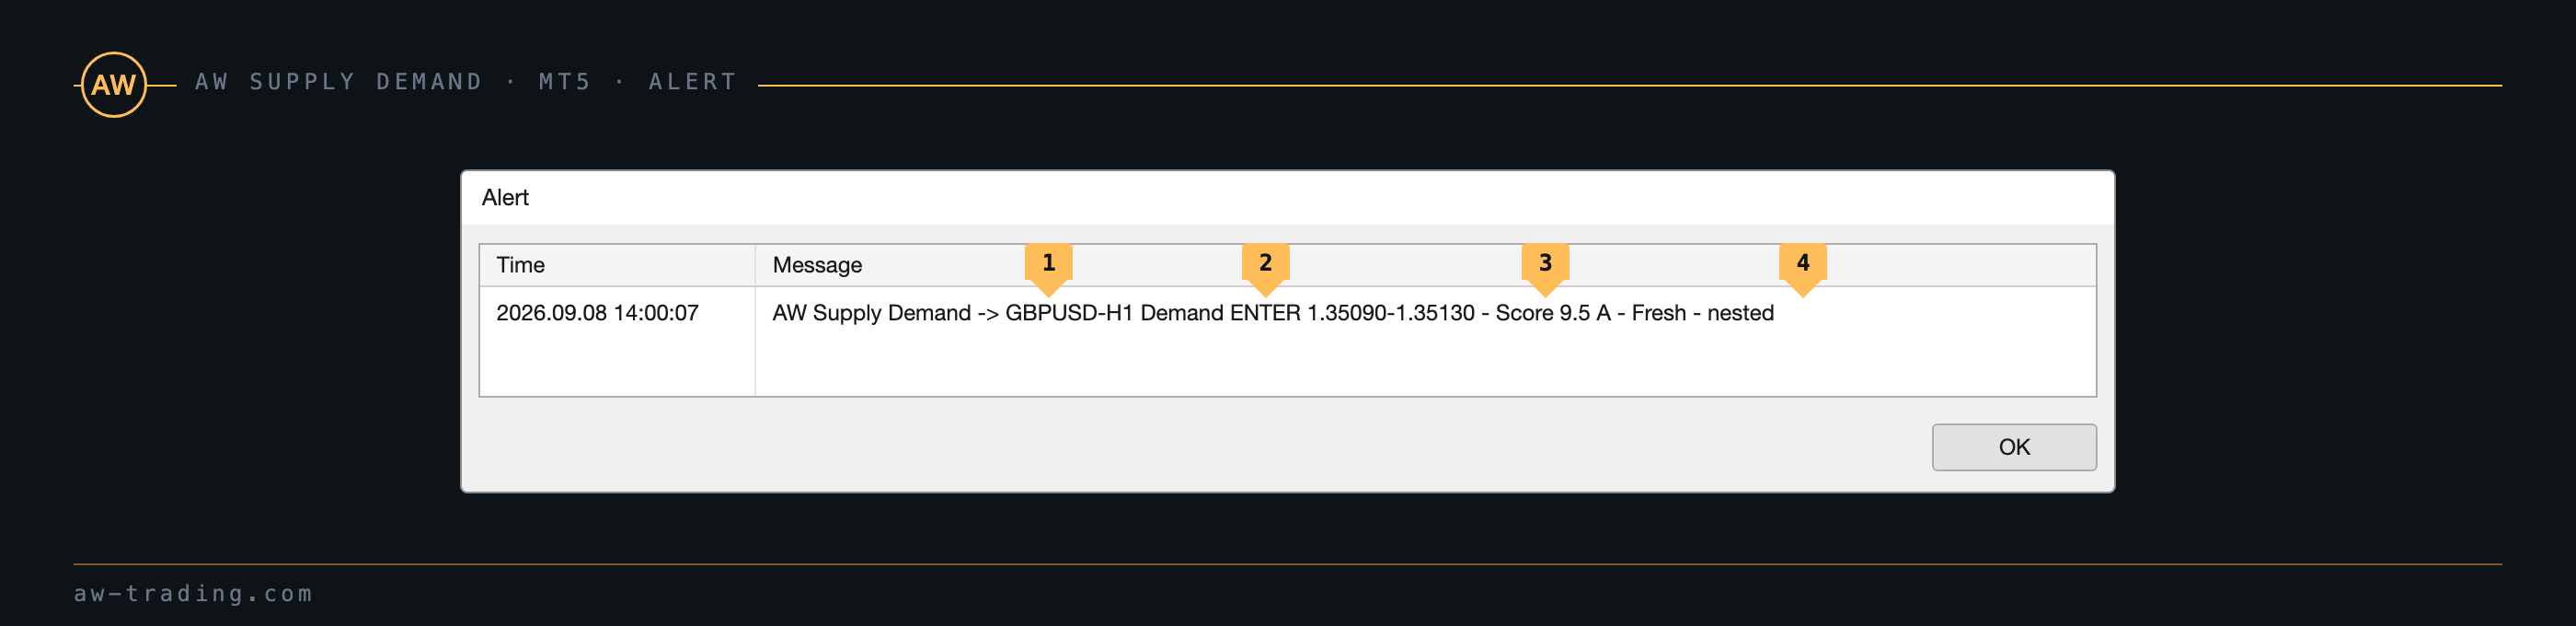
| No. | Part of the message |
|---|---|
| 1 | The symbol and timeframe of the chart the notification came from. |
| 2 | The zone type and the event. |
| 3 | The zone boundaries. |
| 4 | The score with the grade, the state, the nesting mark. For a higher timeframe zone its timeframe is added. |
8. Hotkeys and layers
While the chart window is active, four keys toggle the drawing layers, and the Hotkeys H / O / L / T variable turns them on.
- H - higher timeframe zones
- O - broken zones
- L - zone labels
- T - the Entry / SL / TP trade levels
The initial state of the layers comes from the Show broken zones, Show zone labels and Show Entry / SL / TP lines variables. The Disable all chart drawing variable turns off every drawing, which is the mode for work inside an Expert Advisor.
9. Input settings
The settings are grouped into six blocks. The first ten variables, the MAIN SETTINGS block, form the contract for a call through iCustom and do not change between versions.
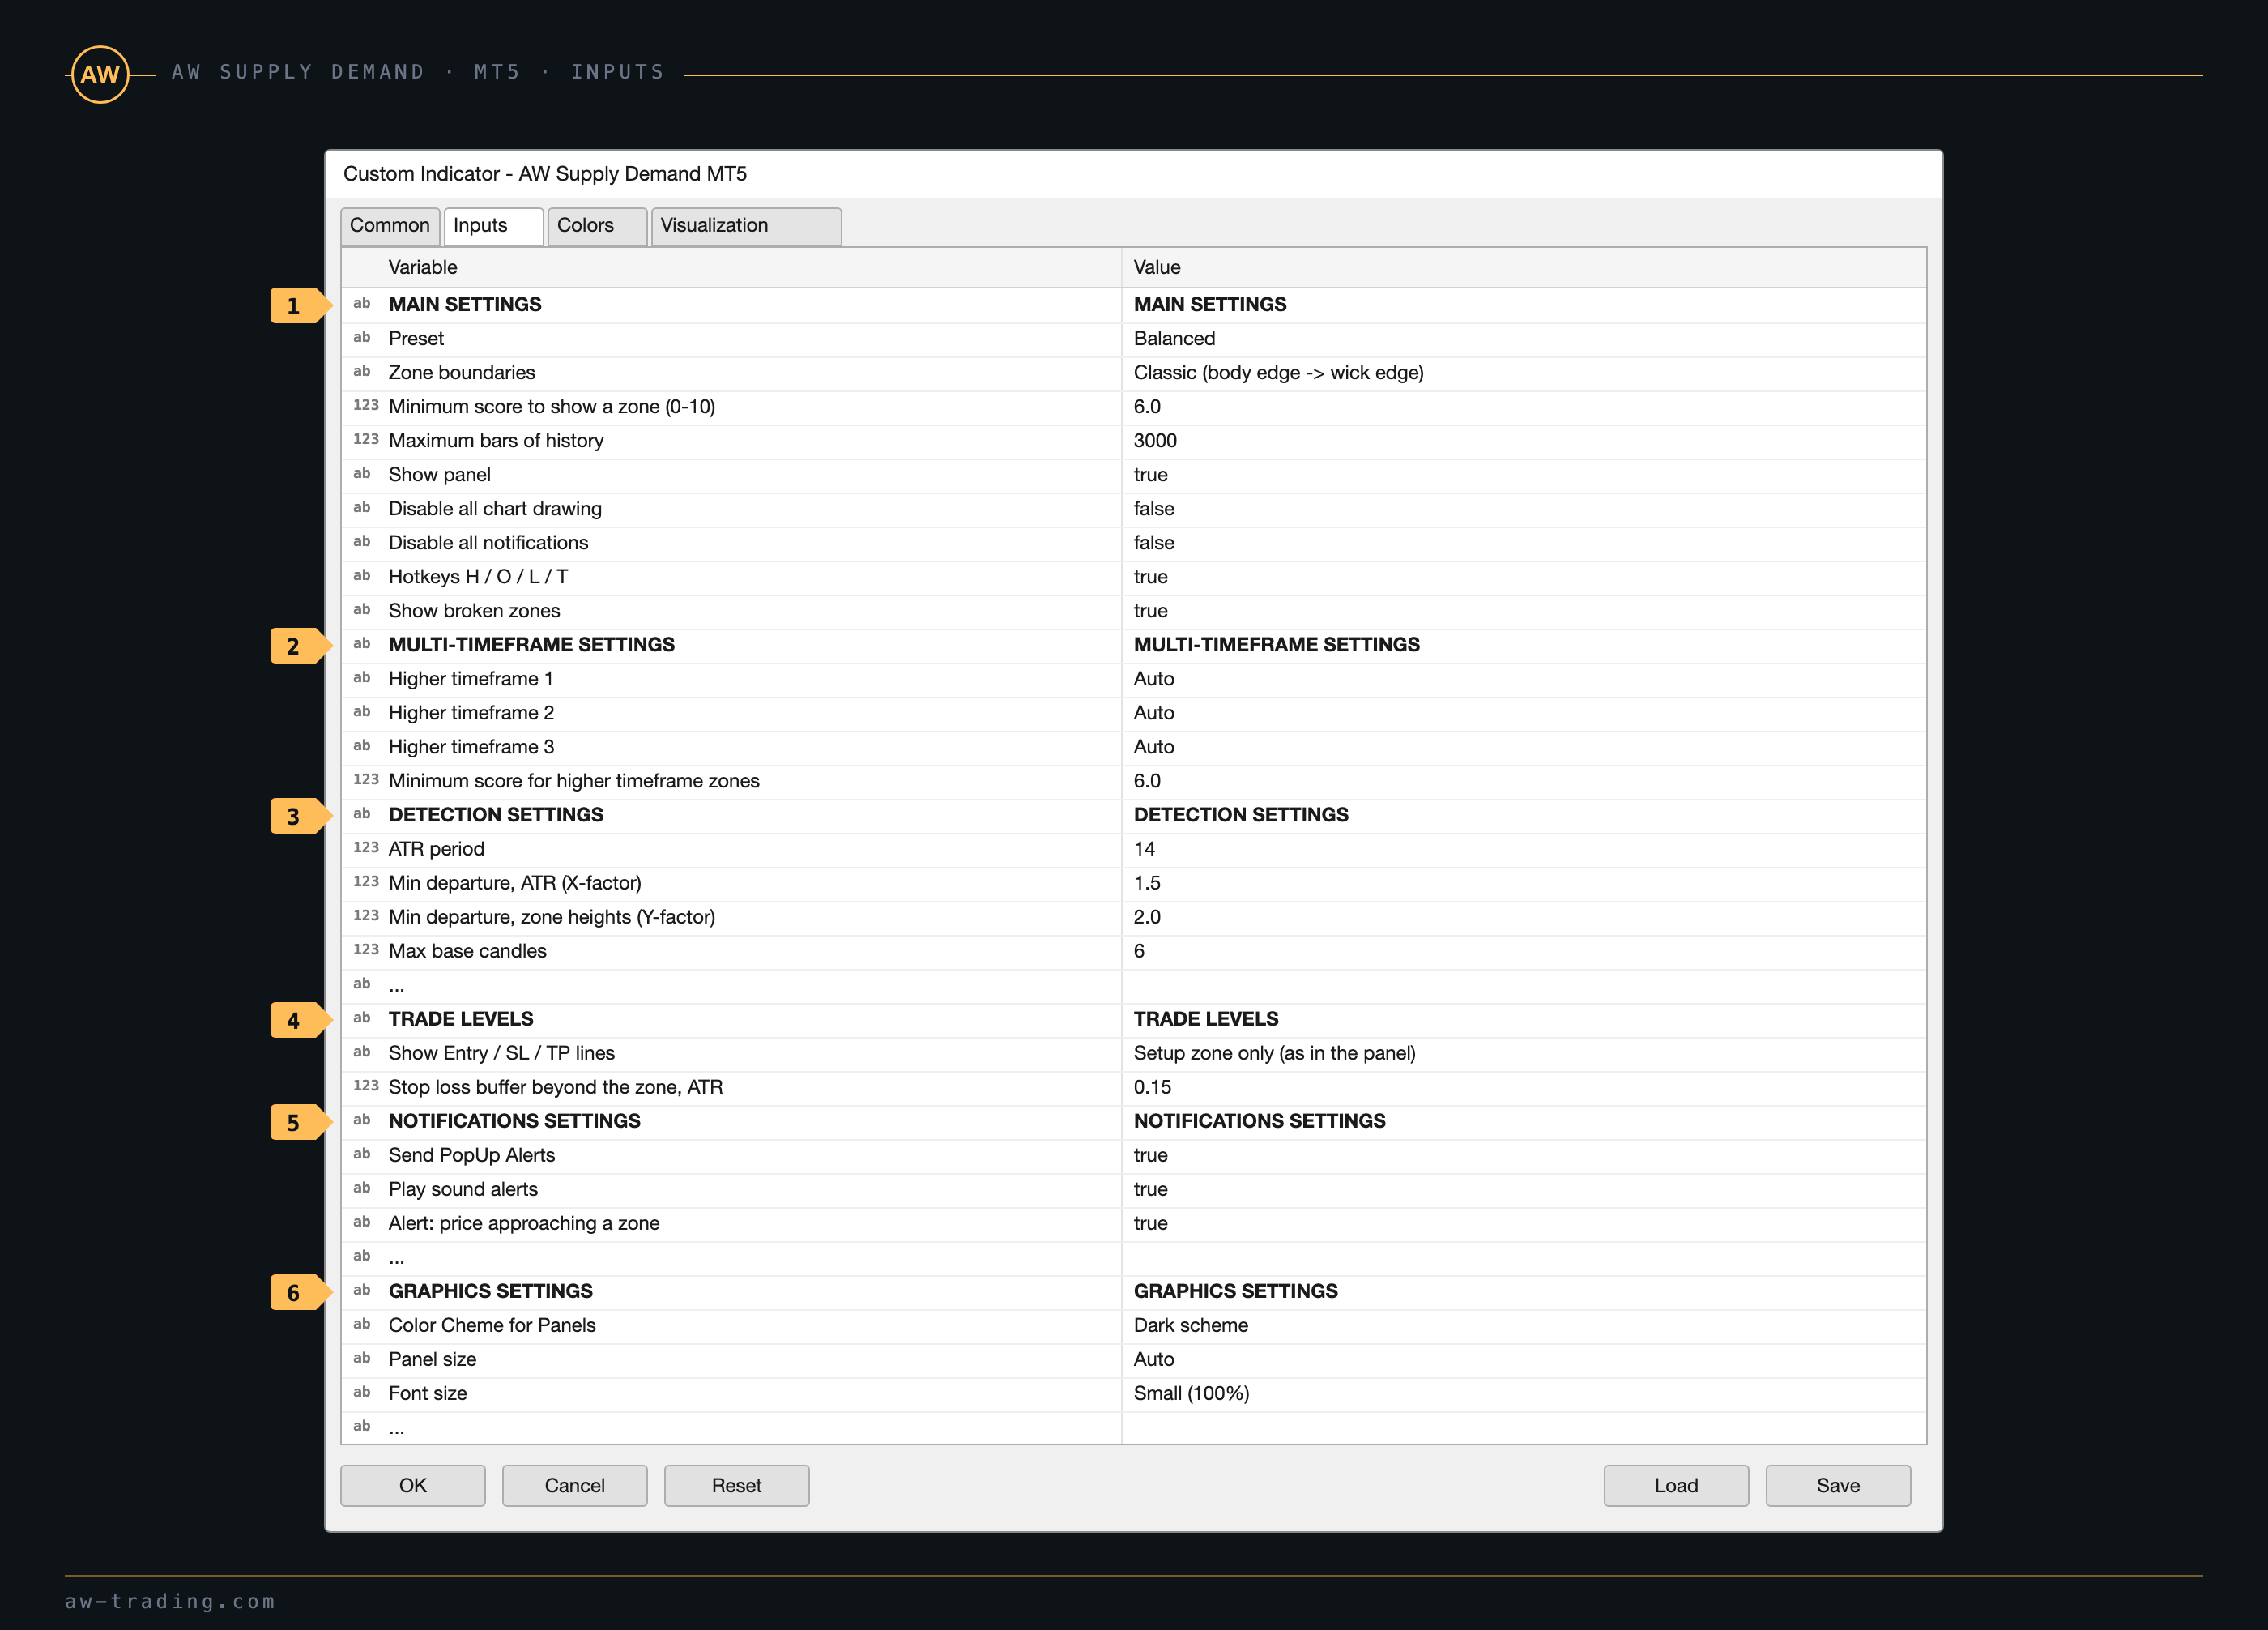
| No. | Block |
|---|---|
| 1 | MAIN SETTINGS: preset, zone boundaries, display threshold, history depth, panel, drawing, notifications, hotkeys, broken zones. |
| 2 | MULTI-TIMEFRAME SETTINGS: three higher timeframes and the display threshold for their zones. |
| 3 | DETECTION SETTINGS: base, departure, confirmation, touches, breaks, overlaps, flip. |
| 4 | TRADE LEVELS: the level lines and the stop buffer. |
| 5 | NOTIFICATIONS SETTINGS: channels, events, filters. |
| 6 | GRAPHICS SETTINGS: panel scheme and scale, zone colors, labels, price marks. |
MAIN SETTINGS
- Preset - a set of detection settings: Balanced, Conservative and Aggressive set the four values from the table in section 1, Custom leaves the DETECTION SETTINGS block as is
- Zone boundaries - the way the zone boundaries are built: Classic from the edge of the bodies to the edge of the wicks, Full candle from wick to wick, Body only from the bodies alone
- Minimum score to show a zone (0-10) - the score threshold for showing a zone of the chart timeframe
- Maximum bars of history - the history depth for the zone and statistics calculation
- Show panel - show or hide the panel
- Disable all chart drawing - turn off every drawing on the chart, the mode for an Expert Advisor
- Disable all notifications - turn off all notifications
- Hotkeys H / O / L / T - turn on the layer hotkeys
- Show broken zones - show broken zones at startup
MULTI-TIMEFRAME SETTINGS
- Higher timeframe 1, 2, 3 - the higher timeframes: Auto by the table in section 6, None disables the slot, any period from M5 to MN1 is set by hand
- Minimum score for higher timeframe zones - the score threshold for showing higher timeframe zones
DETECTION SETTINGS
- ATR period - the ATR period in which the departure, the zone heights and the distances are measured
- Min departure, ATR (X-factor) - the minimum departure of price from the base in ATR
- Min departure, zone heights (Y-factor) - the minimum departure of price from the base in zone heights
- Max base candles - the largest number of candles in the base
- Base candle: max body / range - the largest share of the body in the range of a base candle
- Bars to measure departure - the window of bars in which the departure is measured
- Bars to confirm a zone - the number of closed bars between the departure and the appearance of the zone
- Max zone height, ATR (clipped above) - the largest zone height, above which the zone is clipped
- Touch by - what counts as a touch: Wick a wick, Close a close
- Break by - what counts as a break: Close a single close, Two closes two closes in a row, Wick a wick
- Bars outside to end a visit - the number of bars outside the zone after which the visit is over
- Touches to mark a zone weak - the number of touches after which the zone becomes Weak
- Touches to retire a zone - the number of touches after which the zone is removed
- Overlapping zones - what to do when zones of the same type intersect: Keep newest, Keep strongest, Merge
- Flip broken zones - flip broken zones into the opposite type
- Bars to wait for a flip retest - how many bars a flipped zone waits for a retest
- Bars to keep broken zones - how many bars a broken zone stays on the chart when the flip is disabled
- Max zones drawn per side, per timeframe - how many zones to draw on each side of price on each timeframe
TRADE LEVELS
- Show Entry / SL / TP lines - the level lines: Off no lines, Setup zone only for the setup zone, Both sides for the nearest zones on both sides
- Stop loss buffer beyond the zone, ATR - the stop buffer beyond the far boundary of the zone in ATR, never smaller than the spread
NOTIFICATIONS SETTINGS
- Send PopUp Alerts - the terminal pop-up window
- Play sound alerts - sound with the pop-up window
- Sound name - the sound file from the Sounds folder of the terminal
- Send mails - an e-mail sent to the address from the terminal settings
- Send push notifications - a push message to the mobile terminal by MetaQuotes ID
- Alert: new zone - the NEW ZONE event
- Alert: price approaching a zone - the APPROACH event
- Alert: price entered a zone - the ENTER event
- Alert: reversal candle from a zone - the REVERSAL event
- Alert: zone broken - the BREAK event
- Alert: fake breakout - the FAKE BREAK event
- Alert: flipped zone retest - the FLIP RETEST event
- Approach distance, ATR - the distance to the near boundary at which an approach is counted
- Minimum zone score for alerts - the zone score threshold for notifications
- Alerts only for fresh zones - notifications only for untouched zones, a break is always sent
- Alerts only for nested zones - notifications only for nested zones
- Alert direction - Both both sides, Buy only demand zones, Sell only supply zones
- Alerts for higher timeframe zones - notifications for higher timeframe zones
GRAPHICS SETTINGS
- Color Cheme for Panels - the light or the dark panel scheme, the zone fills follow the scheme
- Show Panel - showing the panel, works together with Show panel from the MAIN SETTINGS block
- Panel size - the panel scale: Auto by screen DPI, Small 100%, Medium 125%, Large 150%
- Font size - the scale of the panel font and the zone labels, Auto follows the panel scale
- Zone colors - Follow panel scheme takes the colors from the scheme, Custom takes the seven colors below
- Custom: Demand fresh, Demand tested, Supply fresh, Supply tested - the fills of chart timeframe zones
- Custom: Higher timeframe Demand outline, Higher timeframe Supply outline - the outlines of higher timeframe zones and the labels of strong zones
- Custom: Broken zone outline - the dotted outline of broken zones
- Show zone labels - zone labels at startup
- Show zone prices on the price scale - marks of the near zone boundaries on the price scale
- Extend zones to the right, bars - how many bars the zones are extended to the right of the current bar
10. For Expert Advisor developers
The indicator calculates zones on closed bars, so an Expert Advisor reads the values from the bar with index 1. The bar with index 0 reflects the current state and changes on ticks. A call through iCustom needs only the first ten input parameters in their order: MAIN SETTINGS, Preset, Zone boundaries, Minimum score to show a zone, Maximum bars of history, Show panel, Disable all chart drawing, Disable all notifications, Hotkeys, Show broken zones. For work inside an Expert Advisor, Disable all chart drawing and Disable all notifications are set to true.
The first 24 buffers are visible in the data window of the terminal, another 40 are read through CopyBuffer.
| Buffer | Data | Values |
|---|---|---|
| 0 | Demand Proximal | the near boundary of the nearest demand zone, a price |
| 1 | Demand Distal | the far boundary, a price |
| 2 | Demand Score | a score from 0.0 to 10.0 |
| 3 | Demand State | the state code |
| 4 | Demand TF | the zone timeframe in minutes |
| 5 | Demand Touches | the number of touches |
| 6-11 | Supply Proximal, Distal, Score, State, TF, Touches | the same for the nearest supply zone |
| 12 | Events | the events of the bar as a single number, decoded below |
| 13 | Buy Entry | the entry price of the buy setup |
| 14 | Buy SL | the stop price |
| 15 | Buy TP | the target price, EMPTY_VALUE with no opposing zone |
| 16 | Buy RR | the Risk / Reward ratio |
| 17-20 | Sell Entry, SL, TP, RR | the same for selling |
| 21 | Bias | 1 up, -1 down, 0 no direction |
| 22 | Demand Nested | 1 when the nearest demand zone is nested inside a higher timeframe zone |
| 23 | Supply Nested | the same for supply |
| 24-63 | Zone slots | the eight nearest live zones, five buffers each: near boundary, far boundary, score, state, type (1 demand, -1 supply). Filled only on bar 0 |
State codes: 1 Fresh, 2 Tested, 3 Weak, 4 Broken, 5 Flipped. An empty buffer value means there is no zone on that side.
The events buffer. Several events can happen on one bar, for example a new demand zone and a break of a supply zone. Instead of adding a buffer for every event, all of them are written into buffer 12 as a single number: every event has its own code from the table, and the buffer value equals the sum of the codes of the events on the bar. Zero means nothing happened on the bar. The buffer is needed only by an Expert Advisor that trades on the indicator events; for manual trading the same events arrive as the notifications from section 7.
| Code | Event | Code | Event |
|---|---|---|---|
| 1 | new demand zone | 64 | demand zone broken |
| 2 | new supply zone | 128 | supply zone broken |
| 4 | entry into a demand zone | 256 | fake break of a demand zone |
| 8 | entry into a supply zone | 512 | fake break of a supply zone |
| 16 | reversal candle for a buy | 1024 | flipped zone retest for a buy |
| 32 | reversal candle for a sell | 2048 | flipped zone retest for a sell |
For example, a value of 20 means an entry into a demand zone and a reversal candle for a buy on the same bar, because 4 + 16 = 20. In the Expert Advisor code the event is checked with a bitwise AND, which is why the codes are powers of two:
int h = iCustom(_Symbol, _Period, "AW Supply Demand MT5"); double ev[1]; CopyBuffer(h, 12, 1, 1, ev); // closed bar bool reversalBuy = ((int)ev[0] & 16) != 0; // reversal candle for a buy bool enterDemand = ((int)ev[0] & 4) != 0; // entry into a demand zone
Buy AW Supply Demand:
MT5 version
👉 https://www.mql5.com/en/market/product/194884
MT4 version
👉 https://www.mql5.com/en/market/product/194898

AW Trading Software