InputLess Signal Generator

It's very simple - there are no settings.

It is required to specify only the colors and the size of the arrows.

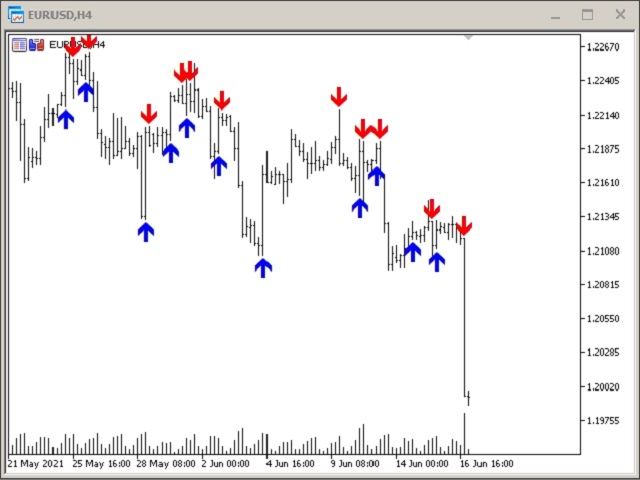
It is also very easy to understand the readings of this indicator. An up arrow is a buy signal, and a down arrow is a sell signal.

Try to test it in the strategy tester - you'll like it !!!

//////////////////////////////////////////////// ///////////////////////////////////

I hope this indicator will be very useful to you in successful trading.

Good luck.

Produits recommandés
PriceDensity – Professional Price Density Indicator for Accurate Market Level Detection PriceDensity   is a smart, non-volume-based indicator that analyzes historical price action to determine   key price levels with the highest frequency of occurrence . It automatically detects where the market has spent the most time – revealing hidden areas of support and resistance based on actual market behavior, not subjective drawing. This tool is ideal for traders using price action, support/resistance c
(Special New Year promotion - free price!) The indicator displays the actual 'Scale in points per bar' (identical to the manual setting in the Terminal, see screenshot) in the upper right corner of the chart. The displayed value changes INSTANTLY whenever the chart scale is changed! (This is very convenient when planning screenshots). In Settings: Change language (Russian/English), font size of the displayed text, text label offset coefficient from the graph corner, equally in X and Y directi
FREE
Manyal trading system, CovEchoTrend Robot, focuses on reliability and flexibility. By employing statistical analysis methods to study the relationships between the base indicator and market patterns, the system enables a deeper understanding of market processes. Intelligent pattern analysis: The application of statistical data processing helps identify key trend reversal points more accurately, signaling significant market shifts. Informed decision-making is based on the intersection of indicato
The new update makes this indicator a complete tool for studying, analyzing and operating probabilistic patterns. It includes: On-chart Multi-asset percentage monitor. Configurable martingales. Twenty-one pre-configured patterns, including Mhi patterns and C3. An advanced pattern editor to store up to 5 custom patterns. Backtest mode to test results with loss reports. Trend filter. Hit operational filter. Martingale Cycles option. Various types of strategies and alerts. Confluence between patter
Ugenesys AI MT5
Odaine Ramon Mcmillan
uGenesys AI - 90% Accurate Daytrading Indicator Introducing the ultimate forex trading indicator system, uGenesys AI, powered by cutting-edge AI technology and advanced analytical techniques, including Time-Series Analysis and Genetic Algorithms. Our AI-powered trading system leverages the power of time-series analysis to identify trends and patterns in historical price data, allowing traders to make informed predictions about future market movements. By analyzing vast amounts of data, our syst
Range Directional Force Indicator – Designed for You to Optimize! The Range Directional Force Indicator is a cutting-edge tool designed to empower traders by visualizing market dynamics and directional strength. Built to offer insights into market trends and reversals, this indicator is an invaluable asset for traders seeking precision in their strategies. However, it is important to note that this indicator is not optimized, leaving room for you to tailor it to your unique trading preferences.
BookMap HeatMap
Roberto Spadim
1 (2)
This Indicator creates a heatmap based on depth of market of the current symbol or another symbol. Other symbol is useful when you trade futures market and a contract has 'mini' and 'full' split. For example, in Brazil (B3 - BMF&Bovespa), WDO and DOL are future Forex contract of BRL/USD (where 1 DOL = 5 WDO) and big banks work mostly with DOL (where liquidity is important). Please use with M1 timeframe , objects are too small to be displayed at higher timeframes (MT5 limit). The number of level
SUPER TREND EA for Meta Trader 5 – Trade Smarter, Any Timeframe, Any Market Unlock the full potential of automated trading with SUPER TREND EA for MT5 , a professional Expert Advisor built for precision, flexibility, and intelligent risk management. Perfect for Forex, Gold, indices, and cryptocurrencies, this EA adapts to any timeframe—from ultra-fast scalping on M1 to long-term swing trading on D1. Whether you trade intraday moves or position trends, the SUPER TREND EA provides reliable signals
The   Time_Price_SQ9_Degree   indicator is based on the 9 Gann square. Using this indicator, you can identify strong time and price zones. The indicator displays the levels as a degree value. The degrees can be set in the settings. After launching, the MENU button appears. If it is highlighted, it can be moved to any point on the graph, and after double-clicking on it, it stops being highlighted and menu buttons appear. To hide the menu, just double-click on the button, it will become highlight
L'indicateur SMC Venom Model BPR est un outil professionnel pour les traders travaillant dans le concept Smart Money (SMC). Il identifie automatiquement deux modèles clés sur le graphique des prix: FVG   (Fair Value Gap) est une combinaison de trois bougies, dans laquelle il y a un écart entre la première et la troisième bougie. Forme une zone entre les niveaux où il n'y a pas de support de volume, ce qui conduit souvent à une correction des prix. BPR   (Balanced Price Range) est une combinaiso
Volume Delta Panel  is a very powerful indicator that read the supply on Market. It calculates the Delta from movement of the price and the difference of BUY volumes and SELL volumes. The Volumes are added to price and normalized to symbol points.  Its special structure allows you to get all Time Frames values available on the platform MT5. Panel can show 50 instruments simultaneously all customizable according to the offer of the Broker. A good observation of this instrument can suggest great e
Combien de fois avez-vous acheté un indicateur de trading avec d' excellents backtests, des preuves de performance sur compte réel avec des chiffres fantastiques et des statistiques partout , mais après l'avoir utilisé, vous finissez par faire sauter votre compte ? Vous ne devriez pas faire confiance à un signal seul, vous devez savoir pourquoi il est apparu en premier lieu, et c'est ce que RelicusRoad Pro fait de mieux ! Manuel d'utilisation + Stratégies + Vidéos de formation + Groupe privé ave
A Market Profile (time price opportunity) implementation with an option to mark a point of control (POC) based on   volume   . Config: Hide default candles. Select a session time using exchange timezone. Experiment with tick multiplier value to achieve desired level of detail. Choose the symbols of your choice, e.g. squares or A-Z chars. For multiple sessions you will have to add additional instances of this script with a different time configuration. Limitations: TradingView has a hard limi
Delta Profile Volume
Teresinha Moraes Correia
Technical Description of the Indicator – Delta Profile for MetaTrader 5 The Delta Profile is an indicator developed for MetaTrader 5 focused on detailed analysis of volume flow within a defined range of candles. It organizes and displays information about the imbalance of positive volumes (associated with upward movements) and negative volumes (associated with downward movements) at different price levels. The result is a clear view of the chart points where the highest concentration of trades o
Il WaveForce Indicatorsu un sistema di doppia envelope esponenziale e smussamento dinamico, WaveForce separa matematicamente l'energia rialzista e ribassista, tracciando due curve (Bull e Bear) e una linea di segnale centrale. Questo consente al trader di percepire con chiarezza quale delle due forze stia guidando il mercato.  Caratteristiche principali: Calcola la pressione rialzista e ribassista separatamente Include una linea di segnale EMA adattiva per confermare inversioni Oscillatore fluid
FREE
VFI Quantum
Nikita Berdnikov
5 (1)
Introducing VFI (Volume Flow Indicator) – a trading indicator that analyzes the relationship between volume and price movement to identify key trading opportunities. The indicator displays the strength and direction of volume flow, providing clear signals about potential entry and exit points. Signals are formed based on zero line crossovers, crossovers between the VFI line and its exponential moving average (EMA), and when the indicator exits overbought and oversold zones. Attention! This stra
FREE
Ultimate Retest
Nguyen Thanh Cong
5 (6)
Introduction The "Ultimate Retest" Indicator stands as the pinnacle of technical analysis made specially for support/resistance or supply/demand traders. By utilizing advanced mathematical computations, this indicator can swiftly and accurately identify the most powerful support and resistance levels where the big players are putting their huge orders and give traders a chance to enter the on the level retest with impeccable timing, thereby enhancing their decision-making and trading outcomes.
FREE
ichimoku indicator with alert; audible alert, email alert, push alert you can enable or disable the settings as you wish When there is a crossing of tenkansen and kijun you will get an alert When there is a cross between Senkouspan A and Senkouspan B you will get an alert Affordable sound settings possibility to modify the parameters of the ichimoku indicator
Introduction To Time Box Indicator Time Box Indicator is a must have indicator for any trader. It will display daily, weekly and Monthly box according to your preferences. Yet, you can extend any important price levels in your chart automatically. You can use them as the significant support and resistance levels. It is very simple but effective tool for your trading. Graphic Setting Use White Chart Line Style for Current Open price Daily Setting Update Timeframe for daily box Number of days to
FREE
L'indicateur construit les cotations actuelles, qui peuvent être comparées aux cotations historiques et, sur cette base, faire une prévision de l'évolution des prix. L'indicateur dispose d'un champ de texte pour une navigation rapide jusqu'à la date souhaitée. Option : Symbole - sélection du symbole que l'indicateur affichera ; SymbolPeriod - sélection de la période à partir de laquelle l'indicateur prendra des données ; IndicatorColor - couleur de l'indicateur ; HorisontalShift - décalage
Simple Anchored VWAP   is a lightweight yet powerful tool designed for traders who want precise volume-weighted levels without complexity. This indicator lets you anchor VWAP from any point on the chart and instantly see how price reacts around institutional volume zones. MT4 Version - https://www.mql5.com/en/market/product/155320 Join To Learn Market Depth -   https://www.mql5.com/en/channels/suvashishfx Using VWAP bands and dynamic levels, the tool helps you understand where real buying and s
FREE
Tragos
David Chokumanyara
TRAGOS Indicator – The GOAT of All Trading Indicators TRAGOS (Greek for “male goat”) isn’t just a name — it’s the GOAT: Greatest of All Time in trading indicators. Designed for Forex, Indices, Gold, Crypto, and Deriv Synthetic Indices (Boom & Crash, Volatility 75, Step, Jump, etc.), it gives you non-repainting buy, sell, and exit signals with unmatched clarity. Why TRAGOS? Non-Repainting Signals – 100% reliable. Audible, Email & Push Alerts – Never miss a trade. Trend Following – Rid
Profile Map MT5
Dmitriy Sapegin
5 (5)
Market Profile helps the trader to identify the behavior if major market players and define zones of their interest. The key feature is the clear graphical display of the range of price action, in which 70% of the trades were performed. Understanding of the location of volume accumulation areas can help traders increase the probability of success. The tool can be used as an independent system as well as in combination with other indicators and trading systems. this indicator is designed to suit
Noize Absorption Index - is the manual trading system that measures the difference of pressure between bears forces and bulls forces. Green line - is a noize free index that showing curent situation. Zero value of index shows totally choppy/flat market.Values above zero level shows how powerfull bullish wave is and values below zero measures bearish forces.Up arrow appears on bearish market when it's ready to reverse, dn arrow appears on weak bullish market, as a result of reverse expectation.
Simple QM Pattern MT5
Suvashish Halder
5 (1)
Simple QM Pattern   is a powerful and intuitive trading indicator designed to simplify the identification of the Quasimodo (QM) trading pattern. The QM pattern is widely recognized among traders for effectively signaling potential   reversals   by highlighting key market structures and price action formations. This indicator helps traders easily visualize the QM pattern directly on their charts, making it straightforward even for those who are new to pattern trading. Simple QM Pattern includes d
FREE
Key level wedge MT5
Presley Annais Tatenda Meck
The   Key level wedge MT5   indicator automatically draws rising wedge pattern and falling wedge pattern for you on the chart. This pattern is really good when used as a confirmation entry at key support & resistance, supply & demand and reversal zones. Advantages  The   Key level wedge MT5   block DOES NOT RE-PAINT, giving you confidence when a signal appears and also helps when looking back.  The   Key level wedge MT5   includes an on/off button on the chart to easily keep the charts clean
Smart FVG Stats
- Md Rashidul Hasan
The  Smart FVG Statistics Indicator  is a powerful MetaTrader 5 tool designed to automatically identify, track, and analyze Fair Value Gaps (FVGs) on your charts. Love it? Hate it? Let me know in a review! Feature requests and ideas for new tools are highly appreciated. :) Try "The AUDCAD Trader": https://www.mql5.com/en/market/product/151841 Key Features Advanced  Fair Value Gap  Detection Automatic Identification : Automatically scans for both bullish and bearish FVGs across specified histo
FREE
Impulse fractals indicator - is counter-trend oriented complex market fractal pattern.  Market creates bull/bear impulse, trend starts, fractals on impulsed wave are an agressive pullback signals. Buy arrow is plotted when market is bearish and it's impulse showed up-side fractal, and sell arrow is plotted when market is bullish and it's impulse showed dn-side fractal. Main indicator's adjustable inputs : impulsePeriod - main period of impulse histogram  filterPeriod  - smoothes impulse accordi
FXLAND Smart Reversal Indicator (MT5) FXLAND Smart Reversal Indicator is a professional technical analysis tool designed to help traders identify potential price reversal zones and key market turning points with clarity and precision. The best reversal indicator and price return by choosing only one ceiling or floor in each time frame A masterpiece of combining mathematics and Gann, fractal matrix, Fibonacci, movement angle and time. Completely intelligent Key Features Detects potenti
The magiciann
Abdelhak Benazizi
5 (5)
THE MAGICIAN - Indicateur Professionnel de Zones d'Offre et de Demande Transformez le Chaos du Marché en Opportunités de Trading Claires sur les Graphiques Or 15 Minutes Vous Rencontrez des Difficultés avec le Trading de l'Or ? Fatigué de deviner où entrer en position sur XAU/USD ? Confus sur s'il faut ACHETER, VENDRE ou RESTER À L'ÉCART ? Vous manquez des configurations à haute probabilité sur le timeframe de 15 minutes ? "THE MAGICIAN" révèle les forces invisibles de l'offre et de la demande q
FREE
Les acheteurs de ce produit ont également acheté
Divergence Bomber
Ihor Otkydach
4.9 (79)
Chaque acheteur de cet indicateur reçoit également gratuitement : L’outil exclusif « Bomber Utility », qui accompagne automatiquement chaque opération de trading, fixe les niveaux de Stop Loss et de Take Profit, et clôture les positions selon les règles de la stratégie Des fichiers de configuration (set files) pour adapter l’indicateur à différents actifs Des set files pour configurer le Bomber Utility selon différents modes : « Risque Minimum », « Risque Équilibré » et « Stratégie d’Attente » U
Obtenez l’indicateur AUX GRATUIT et le support EA   Téléchargement direct — Cliquez ici [ D.I.C.E ] The DICE Indicator  Divergence in Chaos Environment est un outil MT5 spécialisé conçu pour les traders appliquant la théorie des vagues d’Elliott dans le cadre des techniques de Trading Chaos. Il identifie les divergences cachées et régulières du prix, synchronisées avec l’environnement de marché chaotique décrit par Bill Williams. Caractéristiques clés Divergence alignée sur les vagues d’Elliott
Azimuth Pro
Ottaviano De Cicco
5 (1)
LAUNCH PROMO Azimuth Pro price is initially set at 299$ for the first 100 buyers. Final price will be 499$ . THE DIFFERENCE BETWEEN RETAIL AND INSTITUTIONAL ENTRIES ISN'T THE INDICATOR — IT'S THE LOCATION. Most traders enter at arbitrary price levels, chasing momentum or reacting to lagging signals. Institutions wait for price to reach structured levels where supply and demand actually shift. Azimuth Pro maps these levels automatically: swing-anchored VWAP, multi-timeframe structure lines, an
Quantum Trend Sniper
Bogdan Ion Puscasu
4.74 (53)
Présentation       Quantum Trend Sniper Indicator   , l'indicateur révolutionnaire MQL5 qui transforme la façon dont vous identifiez et négociez les inversions de tendance ! Développé par une équipe de traders expérimentés avec une expérience commerciale de plus de 13 ans,       Indicateur Quantum Trend Sniper       est conçu pour propulser votre parcours de trading vers de nouveaux sommets grâce à sa manière innovante d'identifier les inversions de tendance avec une précision extrêmement élevée
Super Signal – Skyblade Edition Système de signaux de tendance professionnel sans repaint / sans latence, avec un taux de réussite exceptionnel | Pour MT4 / MT5 Caractéristiques principales : Super Signal – Skyblade Edition est un système de signaux intelligent conçu spécifiquement pour le trading de tendance. Il utilise une logique de filtrage multicouche pour détecter uniquement les mouvements directionnels forts soutenus par un véritable momentum. Ce système   ne cherche pas à prédire les s
Gold Sniper Scalper Pro
Ich Khiem Nguyen
3.29 (7)
Gold Sniper Scalper Pro est un indicateur professionnel pour MetaTrader 5, conçu pour aider les traders à identifier les points d'entrée et à gérer les risques de manière efficace. L'indicateur fournit un ensemble d'outils d'analyse complet comprenant un système de détection de signaux, une gestion automatique Entry/SL/TP, une analyse de volume et des statistiques de performance en temps réel. Guide d'utilisation pour comprendre le système   |   Guide d'utilisation pour d'autres langues FONCT
Grabber System MT5
Ihor Otkydach
4.81 (21)
Je vous présente un excellent indicateur technique : Grabber, qui fonctionne comme une stratégie de trading "tout-en-un", prête à l'emploi. En un seul code sont intégrés des outils puissants d'analyse technique du marché, des signaux de trading (flèches), des fonctions d'alerte et des notifications push. Chaque acheteur de cet indicateur reçoit également gratuitement : L'utilitaire Grabber : pour la gestion automatique des ordres ouverts Un guide vidéo étape par étape : pour apprendre à installe
Quantum TrendPulse
Bogdan Ion Puscasu
5 (20)
Présentation de   Quantum TrendPulse   , l'outil de trading ultime qui combine la puissance de   SuperTrend   ,   RSI   et   Stochastic   dans un seul indicateur complet pour maximiser votre potentiel de trading. Conçu pour les traders qui recherchent précision et efficacité, cet indicateur vous aide à identifier les tendances du marché, les changements de dynamique et les points d'entrée et de sortie optimaux en toute confiance. Caractéristiques principales : Intégration SuperTrend :   suivez f
L'indicateur « Dynamic Scalper System MT5 » est conçu pour la méthode de scalping, permettant de trader au sein des vagues de tendance. Testé sur les principales paires de devises et l'or, il est compatible avec d'autres instruments de trading. Fournit des signaux pour l'ouverture de positions à court terme le long de la tendance, avec un support supplémentaire pour les fluctuations de prix. Principe de l'indicateur : De grandes flèches déterminent la direction de la tendance. Un algorithme de
MetaForecast M5
Vahidreza Heidar Gholami
5 (3)
MetaForecast prédit et visualise l'avenir de n'importe quel marché en se basant sur les harmoniques des données de prix. Bien que le marché ne soit pas toujours prévisible, s'il y a un motif dans les prix, MetaForecast peut prédire l'avenir aussi précisément que possible. Comparé à d'autres produits similaires, MetaForecast peut générer des résultats plus précis en analysant les tendances du marché. Paramètres d'entrée Past size (Taille passée) Spécifie le nombre de barres que MetaForecast util
Présentation de l'indicateur astronomique pour   MT4 / MT5 : Votre compagnon de trading céleste ultime Êtes-vous prêt à élever votre expérience de trading à des hauteurs célestes ? Ne cherchez pas plus loin que notre indicateur astronomique révolutionnaire pour MT4. Cet outil innovant transcende les indicateurs de trading traditionnels en exploitant des algorithmes complexes pour vous fournir des aperçus astronomiques inégalés et des calculs de précision. Un univers d'informations à portée de ma
Berma Bands
Muhammad Elbermawi
5 (7)
L'indicateur Berma Bands (BB) est un outil précieux pour les traders qui cherchent à identifier et à capitaliser sur les tendances du marché. En analysant la relation entre le prix et les BB, les traders peuvent déterminer si un marché est dans une phase de tendance ou de range. Visitez le [ Berma Home Blog ] pour en savoir plus. Les bandes de Berma sont composées de trois lignes distinctes : la bande de Berma supérieure, la bande de Berma moyenne et la bande de Berma inférieure. Ces lignes sont
Tout d'abord, il convient de souligner que cet outil de trading est un indicateur non repeint, non redessiné et non retardé, ce qui le rend idéal pour le trading professionnel. Cours en ligne, manuel utilisateur et démonstration. L'indicateur Smart Price Action Concepts est un outil très puissant à la fois pour les nouveaux et les traders expérimentés. Il regroupe plus de 20 indicateurs utiles en un seul, combinant des idées de trading avancées telles que l'analyse du trader Inner Circle et le
Top indicator for MT5   providing accurate signals to enter a trade without repainting! It can be applied to any financial assets:   forex, cryptocurrencies, metals, stocks, indices .  Watch  the video  (6:22) with an example of processing only one signal that paid off the indicator! MT4 version is here It will provide pretty accurate trading signals and tell you when it's best to open a trade and close it. Most traders improve their trading results during the first trading week with the help of
ARIPoint
Temirlan Kdyrkhan
1 (1)
ARIPoint is a powerful trading companion designed to generate high-probability entry signals with dynamic TP/SL/DP levels based on volatility. Built-in performance tracking shows win/loss stats, PP1/PP2 hits, and success rates all updated live. Key Features: Buy/Sell signals with adaptive volatility bands Real-time TP/SL/DP levels based on ATR Built-in MA Filter with optional ATR/StdDev volatility Performance stats panel (Success, Profit/Loss, PP1/PP2) Alerts via popup, sound, push, or email Cu
Trend Forecaster
Alexey Minkov
5 (7)
The Trend Forecaster indicator utilizes a unique proprietary algorithm to determine entry points for a breakout trading strategy. The indicator identifies price clusters, analyzes price movement near levels, and provides a signal when the price breaks through a level. The Trend Forecaster indicator is suitable for all financial assets, including currencies (Forex), metals, stocks, indices, and cryptocurrencies. You can also adjust the indicator to work on any time frames, although it is recommen
Shock Pullback
Suleiman Alhawamdah
5 (1)
Tout simplement, vous pouvez commencer à trader lorsque le mouvement des chiffres blancs — appelés « pips » — commence à apparaître à côté de la bougie actuelle. Les « pips » blancs indiquent qu’un ordre d’achat ou de vente est actuellement actif et évolue dans la bonne direction, comme le montre leur couleur blanche. Lorsque le mouvement des pips blancs s’arrête et devient vert statique, cela signale la fin de la dynamique en cours. La couleur verte des chiffres représente le profit total réal
FOOTPRINTORDERFLOW: The Authoritative Guide ( This indicator is also compatible with economic providers that do not offer DOM data and BID/ASK data, It also supports various foreign exchange transactions, DEMO version,modleling must choose " Every tick based on real ticks"  ) Important notice: Before placing an order, please contact me first, and I will provide you with professional answers and services 1. Overview FOOTPRINTORDERFLOW  is an advanced Order Flow analysis tool designed for MetaTra
Advanced Supply Demand MT5
Bernhard Schweigert
4.5 (14)
La meilleure solution pour tout commerçant débutant ou expert ! Cet indicateur est un outil de trading unique, de haute qualité et abordable car nous avons intégré un certain nombre de fonctionnalités propriétaires et une nouvelle formule. Avec cette mise à jour, vous pourrez afficher des zones à double horaire. Vous pourrez non seulement afficher un TF plus élevé, mais afficher les deux, le graphique TF, PLUS le TF supérieur : AFFICHAGE DES ZONES NICHÉES. Tous les traders Supply Demand vont ado
Rtc ML Ai Predictor
Muhammad Faisal Sagala
Rtc ML Ai | Predictor CORE MACHINE LEARNING ENGINE Adaptive ML Market Predictor – Multi-Bar Trend & Candle Forecast What This Indicator Does This indicator is a  real-time market prediction engine  designed to analyze price behavior and estimate  future market tendencies . Unlike conventional indicators, this system  does not rely on static parameters or historical curve-fitting , but adapts its internal state dynamically during live market operation. Instead of using static rules, the indic
Weis Wave with Alert MT5
Trade The Volume Waves Single Member P.C.
4.94 (17)
Rental/Lifetime Package Options and Privileges  Rent Monthly Six Months   Yearly/Lifetime Weis Wave with Speed with Alert+Speed Index x x x Manual  x x x Quick Set up Video x x x Blog x x x Lifetime Updates x x x Setup and Training Material x x Discord Access Channel "The SI traders"          x Rectangle Break Alert Tool      x How to trade with it:    http://www.tradethevolumewaves.com   ** If you purchase please contact me to setup your  : Training Room and  complete manual access.  Wei
Elliott Wave Trend was designed for the scientific wave counting. This tool focuses to get rid of the vagueness of the classic Elliott Wave Counting using the guideline from the template and pattern approach. In doing so, firstly Elliott Wave Trend offers the template for your wave counting. Secondly, it offers Wave Structural Score to assist to identify accurate wave formation. It offers both impulse wave Structural Score and corrective wave Structure Score. Structural Score is the rating to sh
Trade smarter, not harder: Empower your trading with Harmonacci Patterns This is arguably the most complete harmonic price formation auto-recognition indicator you can find for the MetaTrader Platform. It detects 19 different patterns, takes fibonacci projections as seriously as you do, displays the Potential Reversal Zone (PRZ) and finds suitable stop-loss and take-profit levels. [ Installation Guide | Update Guide | Troubleshooting | FAQ | All Products ] It detects 19 different harmonic pri
Orderflow Scalp Pro v2.4   delivers institutional-grade trading intelligence through advanced volume analysis, dynamic VWAP calculations, real-time aggressive score monitoring, and precision arrow signals. This complete trading system transforms complex market data into clear, actionable signals for consistent profitability on 3-4 minute timeframes. Full Documentation: [Download PDF] Four Powerful Components in One System Volume Profile HeatMap with POC/VAH/VAL Transform your charts into inst
SynaptixQuant Dominance Matrix
Devie Arevalo Montemayor
5 (1)
SynaptixQuant Dominance Matrix: Institutional-Grade Market State Extraction Engineered for traders who require a data-driven view of market behaviour beyond surface-level indicators. The Synaptix Quant (SQ) Dominance Matrix is not a conventional currency strength display. Behind its intentionally streamlined interface runs a sophisticated analytical architecture designed to quantify market conditions with precision. Every output is generated through layered signal processing built to identify d
MTF Supply Demand Zones MT5
Georgios Kalomoiropoulos
5 (1)
Nouvelle génération de zones d'approvisionnement et de demande automatisées. Algorithme nouveau et innovant qui fonctionne sur n'importe quel graphique. Toutes les zones sont créées dynamiquement en fonction de l'action des prix du marché. DEUX TYPES D'ALERTES --> 1) QUAND LE PRIX ATTEINT UNE ZONE 2) QUAND UNE NOUVELLE ZONE SE FORME Vous n'obtenez pas un indicateur inutile de plus. Vous obtenez une stratégie de trading complète avec des résultats prouvés.     Nouvelles fonctionnalités:   
ACB Breakout Arrows MT5
KEENBASE SOFTWARE SOLUTIONS
5 (1)
L’indicateur ACB Breakout Arrows fournit un signal d’entrée crucial sur le marché en détectant un modèle de rupture spécifique. Il analyse en continu le graphique à la recherche d’un momentum établi dans une direction et déclenche un signal précis juste avant le mouvement principal. Obtenez le scanner multi-actifs et multi-unités de temps ici - Scanner pour ACB Breakout Arrows MT5 Fonctionnalités principales Les niveaux de Stop Loss et Take Profit sont fournis par l’indicateur. Inclut un table
Trend Flow PRO
Aliaksandr Alferchyk
TREND FLOW PRO TREND FLOW PRO est un indicateur sans repaint qui affiche la direction du marché. Il identifie les retournements de tendance ainsi que les entrées initiales et répétées des principaux participants du marché. Les marques BOS sur le graphique représentent de véritables changements de tendance et des niveaux clés des unités de temps supérieures. Les données ne sont pas repeintes et restent sur le graphique après la clôture de chaque bougie. Demandez et recevez un guide PDF détaillé a
Prices move for many reasons and these can vary from one operator to another: software, private and institutional traders simultaneously contribute to the formation of the price, making predictive art very difficult. However, there are measurable factors that bind the price to an underlying trend in line with the physical reality that the financial asset represents: these are the macroeconomic indicators. Large investors use this information wisely to set their strategies. Understanding these m
Max Ribbon Mt5
Stefano Frisetti
WARNING: This indicator is distributed EXCLUSIVELY on MQL5.com MT4 version:   https://www.mql5.com/it/market/product/160363 MT5 version:   https://www.mql5.com/it/market/product/160410 ============================================================================================= MAX RIBBON ver 1.00 The indicator that shows you the TREND clearly and unambiguously! ============================================================================================= DESCRIPTION MAX RIBBON is an advanced tre
Plus de l'auteur
//////////////////////////////////////////////// ////////////////////////////////// An improved version of the standard Bulls Power and Bears Power indicators. Now it's two in one. The setup is simple - you just need to specify the period. It is also very easy to understand the readings of this indicator, a signal above zero is a buy, and below it is a sell. //////////////////////////////////////////////// /////////////////////////////////// I hope this indicator will be very useful to you
FREE
//////////////////////////////////////////////// ////////////////////////////////// An improved version of the standard Average True Range indicator. It is now a responsive and smoothed line. The setup is not straightforward - but I hope you can do it. It is very easy to understand the readings of this indicator, the meaning is the same as that of the standard Average True Range. //////////////////////////////////////////////// /////////////////////////////////// I hope this indicator will
FREE
An improved version of the standard Standard Deviation indicator. It is now a responsive and smoothed line. The setup is not straightforward - but I hope you can do it. It is very easy to understand the readings of this indicator, the meaning is the same as that of the usual Standard Deviation. //////////////////////////////////////////////// /////////////////////////////////// I hope this indicator will be very useful to you in successful trading. Good luck.
FREE
This expert is designed to work in pairs with the same indicator. https://www.mql5.com/ru/market/product/34836 The expert does not display anything on the screen and does not trade. It only performs calculations for the indicator, this is done to save your computer resources. Since the expert works with symbols from Market Watch, there is no way to test it in the tester. Instructions for use: 0) Select the required symbols in the Market Watch, which will be displayed in the indicator. (Note: !!
FREE
VScale Live Expert
Igor Gerasimov
4 (1)
The indicator now includes vertical volumes. !!!! The indicator now includes a forecasting module !!!!. If you want to stop annoying messages use this expert together with the purchased paid indicator "V-Scale Live Trainer". Manual trading only. A simple expert makes traders lives easier. Note: To use it, just enable one-click trading. And don't forget to disable AUTO_TRADE. With each new start of the terminal, the metatrader 4, immediately, about two times, switch between all the timeframes i
FREE
An improved version of the standard Standard Deviation indicator. It is now a responsive and smoothed line. The setup is not straightforward - but I hope you can do it. It is very easy to understand the readings of this indicator, the meaning is the same as that of the usual Standard Deviation. //////////////////////////////////////////////// /////////////////////////////////// I hope this indicator will be very useful to you in successful trading. Good luck.
FREE
This expert is designed to work in pairs with the same indicator. https://www.mql5.com/ru/market/product/34834 The expert does not display anything on the screen and does not trade. It only performs calculations for the indicator, this is done to save your computer resources. Since the expert works with symbols from Market Watch, there is no way to test it in the tester. Instructions for use: 0) Select the required symbols in the Market Watch, which will be displayed in the indicator. (Note: !!
FREE
//////////////////////////////////////////////// //////////////////////////////////////////////// ///////////////////////////////////// Go My Way is an ultra-accurate indicator of trend direction or price movement. This indicator is calculated on the basis of a dozen other indicators and has a very complex mechanism. //////////////////////////////////////////////// //////////////////////////////////////////////// ///////////////////////////////////// The settings are very simple, but it is
//////////////////////////////////////////////// ////////////////////////////////// This indicator uses polynomial regression to plot three channels and six lines accordingly. The first channel and its borders with a large period, the second with an average and the third with a small period. The setup is simple - you only need to specify the colors and enable / disable the display of price labels. It is also very easy to understand the readings of this indicator. Channel lines are used to set s
Il s'agit d'un graphique en ticks au deuxième format. Il existe un support pour OpenCL. Les réglages sont très simples - vous pouvez sélectionner les jours de la semaine pour lesquels l'indicateur sera calculé : par exemple, pour ces instruments financiers, dont les cotations ne sont pas mises à jour le week-end, vous devez sélectionner n'importe quel autre jour de la semaine pour les 6e et 7e jours, mais, par exemple, pour le bitcoin, si le courtier met à jour les cotations, vous pouvez précis
//////////////////////////////////////////////// ////////////////////////////////// An improved version of the standard Average True Range indicator. This is now double the precision and a colored a veraging  line. The setup is quite simple - you need to specify the main period and the averaging period. It is very easy to understand the readings of this indicator, the meaning is the same as that of the standard Average True Range. //////////////////////////////////////////////// //////////
//////////////////////////////////////////////// ////////////////////////////////// This indicator displays the range of price changes in 1 minute. Great for risk management. This is an improved version of the standard Average True Range indicator for Tick Chart. This is now double the precision and a colored averaging line. The setting is quite simple - you just need to change the colors if necessary. It is very easy to understand the readings of this indicator, the meaning is the same as
//////////////////////////////////////////////// / ///////////////////////////////// Cet indicateur affiche un canal de régression polynomiale non linéaire. Cela fonctionne très vite comme l'éclair. Surtout lors de l'utilisation de la technologie d'accélération OpenCL. Une version spéciale de cet indicateur sera bientôt disponible, qui prédit également le prix pour un certain temps à venir. Ce sont des lignes colorées adaptatives et lisses. Il existe quatre options pour cet indicateur : 1) Déla
Filtrer:
Aucun avis
Répondre à l'avis