Ace Supply Demand Zone MT5

5

Ace Supply Demand Zone Indicator

The concept of supply demand relies on the quantity mismatching between buying and selling volumes in the financial market. Supply and demand zone can provide the good entry and exit. A zone is easier to trade than a line. The supply demand zone can provide the detailed trading plan and the risk management. Its ability to predict market direction is high. There are two distinctive points about Ace Supply Demand Zone Indicator. Ace Supply Demand Zone indicator was built on the non-repainting and non-lagging principle. If you have a choice, choose non-repainting and non-lagging system always.

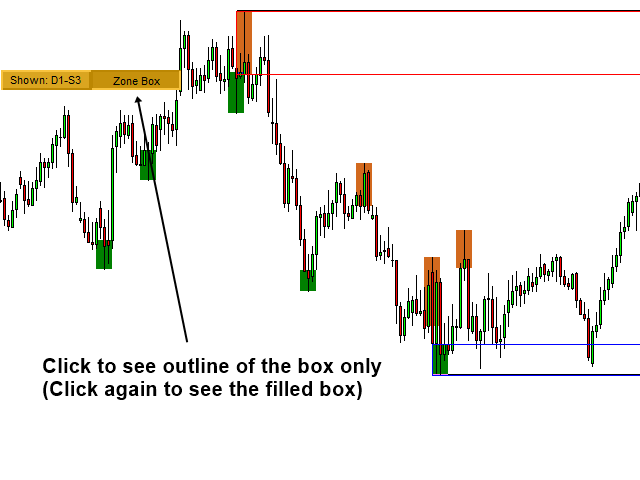
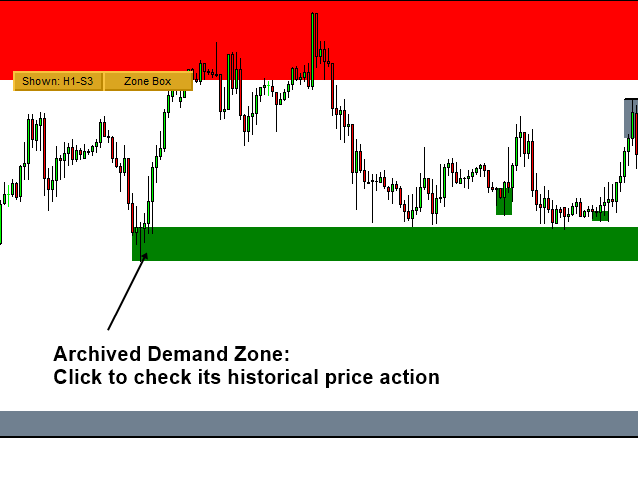
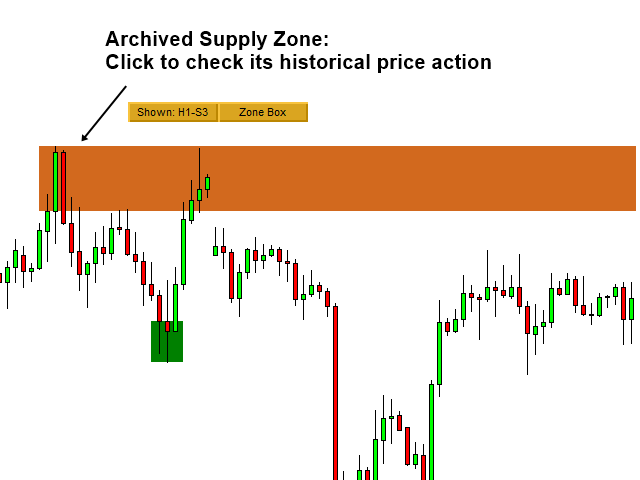
Since this is non repainting supply demand zone indicator, you can use the historical supply and demand zone as the horizontal support and resistance. For example, at some point, any supply and demand zone will be penetrated. Once they are penetrated, the indicator automatically achieves these supply and demand zones. The historical zone will be displayed with short box instead of the extended box in your chart. You can always extend the box again by clicking them if you wish. Even after their life ended, they can serve you to draw the great breakout or reversal zone in your chart. With the historical supply and demand zone, you can use them to improve the trading performance on top of the original supply and demand zone strategy. You can consider it as the automatic horizontal support and resistance indicator in this end. Hence, Ace Supply and Demand indicator is highly valuable comparing to any other supply and demand indicator on the internet.


Main Features

  • Multiple timeframe scanning for the important supply demand zone

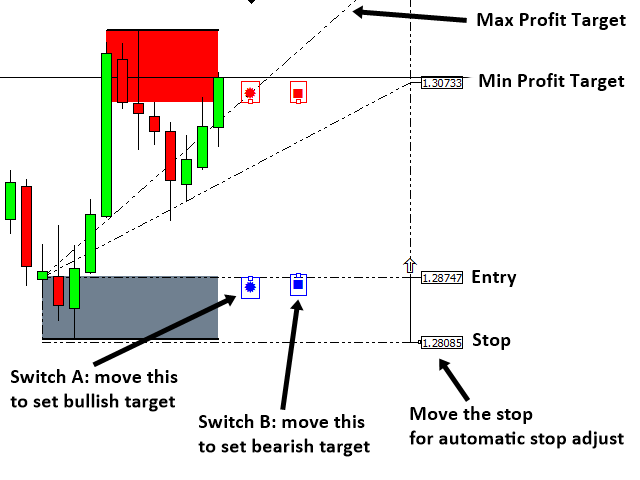
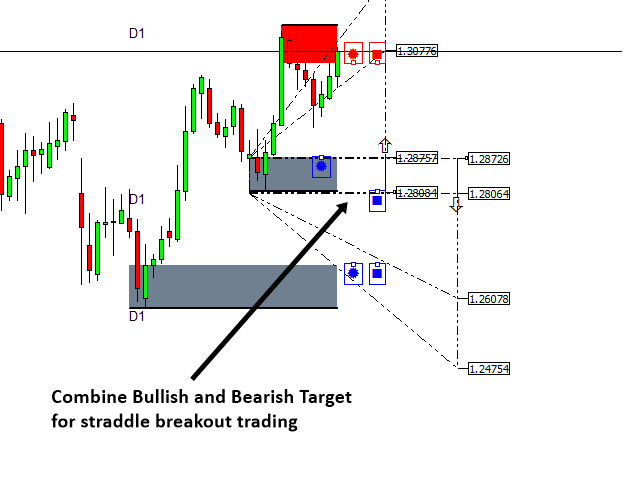
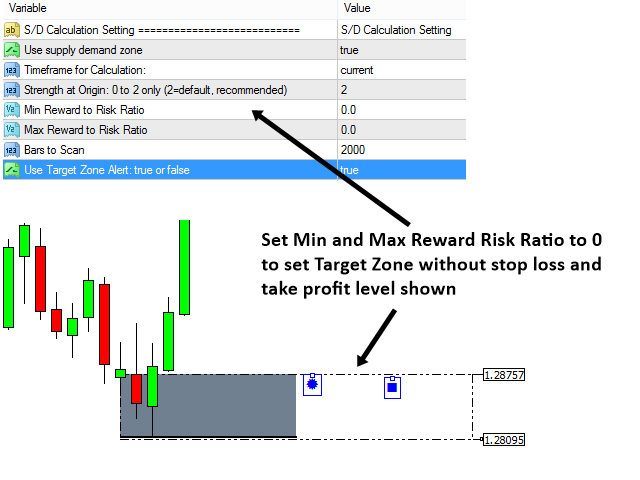
  • Automatic profit target and stop loss detection for any supply demand zone

  • Daily, Weekly and Monthly Market Profile Analysis to further gauge the mean reversion characteristics of market (Value area and point of control calculation included.)

  • Daily, Weekly, Monthly Pivot Analysis to improve your mean reversion analysis

  • Capability to do multiple time frame analysis on the same chart (Recommended to use no more than two zones per chart)

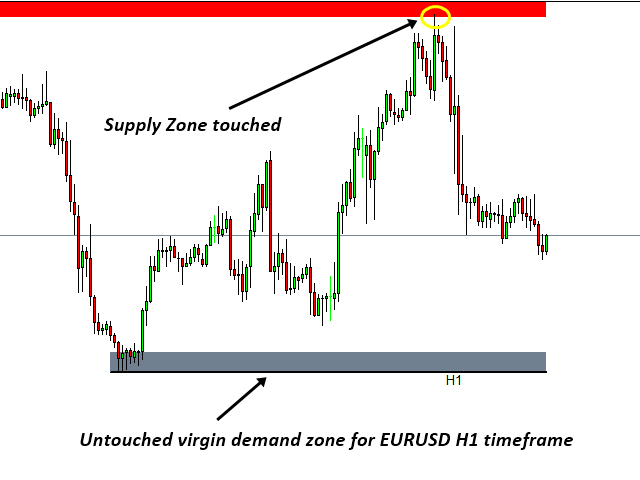
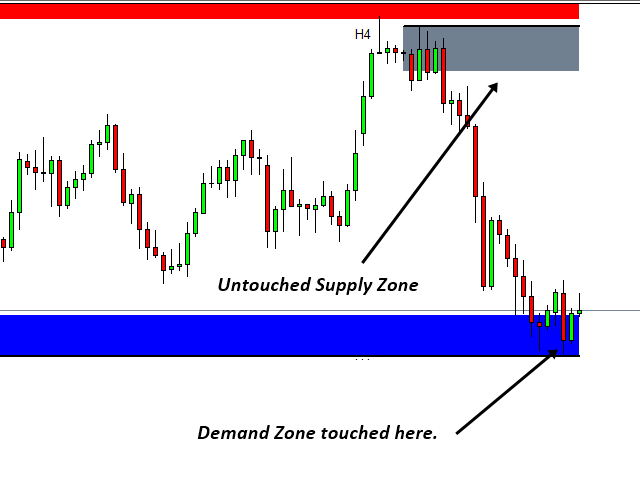
  • Automatic Retouch detection of each supply demand zone. (Easy to identify which zone is virgin and which are not.)

  • Sound, Email, Push notification is possible when any supply demand zone is touched or detected


Trading Direction

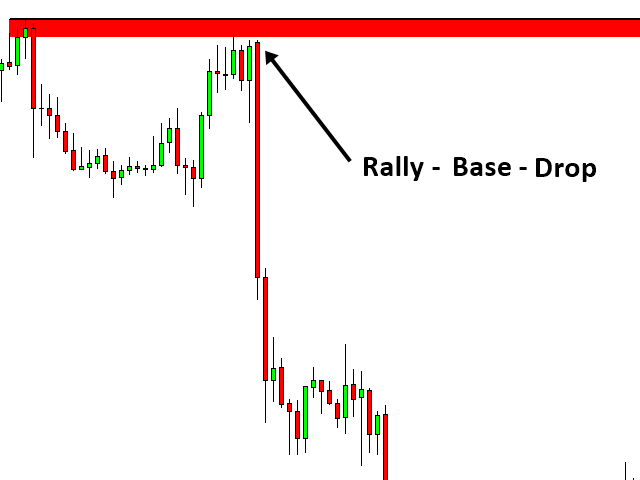
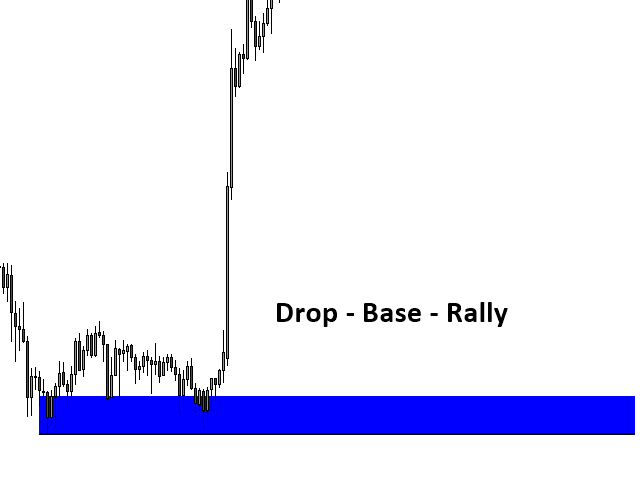
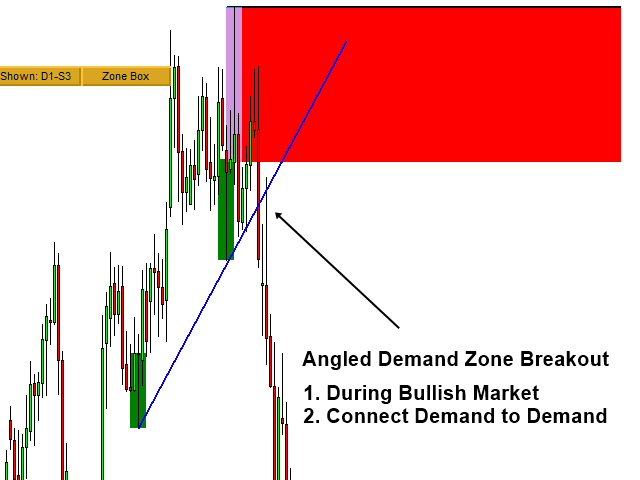
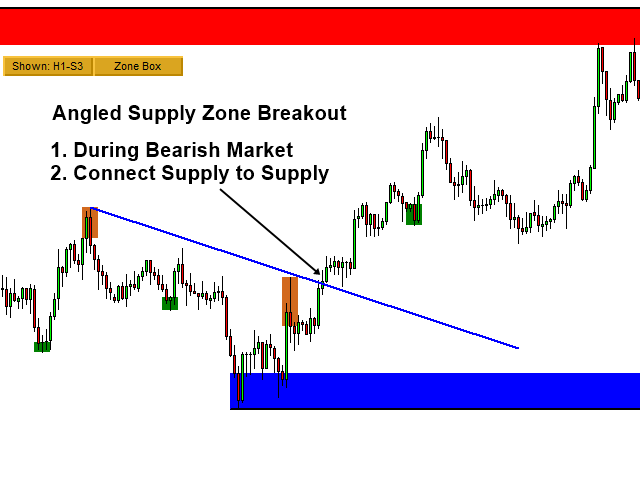
You can perform the typical supply and demand zone trading. For example, you can use Supply and Demand Zone to predict market direction (Drop Base Rally pattern, Rally Base Drop pattern, Rally Base Rally pattern, Drop Base Drop pattern). Secondly, you can also use the supply demand zone as the horizontal support and resistance. On top of that, you can use Market Profile as an additional decision making tool.


    About Market Profile

    This indicator offers daily, weekly and monthly Market Profile to gauge the odds of the mean reversion for the market. To construct the market profile, the timeframe for chart must be carefully chosen for the proper calculation of Market Profile. Normally it is important to recognize the price movement outside the value area.

      • Daily Market Profile: M5 to H1 timeframe can be used. M30 is recommended.

      • Weekly Market Profile: M30 to H4 timeframe can be used. H1 is recommended.

      • Monthly Market Profile: H1 to D1 timeframe can be used. H4 is recommended.


      Trading Strategy Guide

      The good trading strategy guide for the supply demand trading can be fround from Technical Analysis in Forex and Stock Market (Supply Demand Analysis and Support Resistance, 2021). In addition, you can also use the book: Science Of Support, Resistance, Fibonacci Analysis, Harmonic Pattern, Elliott Wave and X3 Chart Pattern (In Forex and Stock Market Trading, 2021) to find out the explanation for support and resistance as well as other advanced technical anaysis. Please visit the link below for more details about the trading strategy guide with supply demand zone trading.

      Supply Demand Zone Trading Guide: https://www.mql5.com/en/blogs/post/750386


      Important Note

      This is the off the shelf product. Therefore, we do not accept any modification or customization request on this product. In addition, we do not provide any code library or any support for your coding for this product.


      Avis 3
      rodnaya
      216
      rodnaya 2022.01.15 18:17 
       

      Спасибо супер:)))

      jorge luna
      146
      jorge luna 2021.06.02 00:46 
       

      I found it to be an excellent indicator, it seems to me that the developer needs to give us more information about its potential, since there is no description of the entire use of the configuration buttons, otherwise, it has helped me make good decisions regarding my trading, many thanks to the developer for this great tool.

      Jose Luis
      103
      Jose Luis 2020.06.26 20:28 
       

      EXCELLENT INDICATOR, VERY POWERFUL AND RELIABLE...VERY RECOMMENDED!!!

      Produits recommandés
      Introduction to X3 Chart Pattern Scanner X3 Cherart Pattern Scanner is the non-repainting and non-lagging indicator detecting X3 chart patterns including Harmonic pattern, Elliott Wave pattern, X3 patterns, and Japanese Candlestick patterns. Historical patterns match with signal patterns. Hence, you can readily develop the solid trading strategy in your chart. More importantly, this superb pattern scanner can detect the optimal pattern of its kind. In addition, you can switch on and off individu
      Mean Reversion Supply Demand Indicator Mean Reversion Supply Demand is the indicator to detect the important supply demand zone in your chart. The concept of supply demand trading relies on the quantity mismatching between buying and selling volumes in the financial market. Typically, supply demand zone serves to predict the turning point. The wave pattern, for any supply demand zone to work as an successful trade, looks like the price must touch the base zone, move away and then return to zone
      Introduction Excessive Momentum Indicator is the momentum indicator to measure the excessive momentum directly from raw price series. Hence, this is an extended price action and pattern trading. Excessive Momentum Indicator was originally developed by Young Ho Seo. This indicator demonstrates the concept of Equilibrium Fractal Wave and Practical Application at the same time. Excessive Momentum detects the market anomaly. Excessive momentum will give us a lot of clue about potential reversal and
      Introduction Harmonic Patterns are best used to predict potential turning point. Traditionally, Harmonic Pattern was identified manually connecting peaks and troughs points in the chart. Manual harmonic pattern detection is painfully tedious and not suitable for everyone. You are often exposed under subjective pattern identification with manual pattern detection. To avoid these limitations, Harmonic Pattern Plus was designed to automate your harmonic pattern detection process. The functionality
      Introduction to Double Harmonic Volatility Indicator Use of the Fibonacci analysis for financial trading can nearly go back to 85 years from today since the birth of Elliott Wave Theory by R. N. Elliott. Until now, traders use the Fibonacci analysis to identify the patterns in the price series. Yet, we could not find any one attempted to use Fibonacci analysis for the Volatility. Harmonic Volatility Indicator was the first technical analysis applying the Fibonacci analysis to the financial Volat
      Elite Harmony Signals Pro Panoramica Elite Harmony Signals è un indicatore sofisticato di analisi tecnica che visualizza rettangoli dinamici che forniscono zone di trading chiare e segnali di conferma per decisioni migliorate. Caratteristiche Principali Zone Rettangolo Dinamiche Estensione in Tempo Reale : I rettangoli si estendono automaticamente all'azione corrente del prezzo Chiusura Intelligente : I rettangoli si chiudono solo quando appaiono segnali opposti Conferma Visiva : Zone di trading
      TPO Volume Range Indicator MetaTrader 5 The TPO Volume Range Indicator allows traders to visualize trading volume distribution within specific price ranges. This indicator features two adjustable vertical lines, enabling users to set their preferred analysis range. Histograms represent market activity at each price level, while green horizontal lines mark the areas with the highest volume.  These high-volume zones are widely considered key support and resistance levels and are crucial for infor
      FREE
      Overview Harmonic Patterns MT5 is a technical analysis indicator designed for the MetaTrader 5 platform. It identifies and displays harmonic price patterns, such as Butterfly, Cypher, Crab, Bat, Shark, and Gartley, in both bullish and bearish directions. The indicator calculates key price levels, including entry, stop loss, and three take-profit levels, to assist traders in analyzing market movements. Visual elements and customizable alerts enhance usability on the chart. Features Detects six ha
      TPO Trading Analyzer Indicator MetaTrader 5 The TPO Trading Analyzer Indicator is a specialized tool designed to analyze market behavior using the principles of Time, Price, and Opportunity (TPO). Built upon the Market Profile methodology, this indicator detects and visualizes high-volume trading zones along with hidden support and resistance levels. It uses color-coded histograms to display trading volumes at various price points, with the intensity of the bars indicating the volume traded at
      FREE
      Elliott Wave Trend was designed for the scientific wave counting. This tool focuses to get rid of the vagueness of the classic Elliott Wave Counting using the guideline from the template and pattern approach. In doing so, firstly Elliott Wave Trend offers the template for your wave counting. Secondly, it offers Wave Structural Score to assist to identify accurate wave formation. It offers both impulse wave Structural Score and corrective wave Structure Score. Structural Score is the rating to sh
      Introduction to Chart Pattern MT Chart Pattern MT is a chart pattern scanner to detect the triangle pattern, falling wedge pattern, rising wedge pattern, channel pattern and so on. Chart Pattern MT uses highly sophisticated chart pattern detection algorithm. However, we have designed it in the easy to use with intuitive user interface. Chart Pattern MT will show all the patterns in your chart in the most efficient format for your trading. You do not have to do tedious manual pattern detection an
      Introduction to Fibonacci Volatility Indicator Volatility indicator can help you to detect any statistical advantage for your trading. Especially, if you are trading with Price Action and Price Patterns, then we recommend to use the Volatility indicator together with your strategy. Especically, Fibonacci Volatility indicator combines the market volatiltiy with Fibonacci Analysis to provide you more advanced volatiltiy indicator. Main Features Fibonacci Volatility in Z score Configuration Mode Fi
      Advance Demand and Supply
      Oyinemomoemi Emeledor
      5 (1)
      This   Demand & Supply Zone Indicator with Volume Filtering   is a technical analysis tool for MetaTrader that identifies key price zones where buying (demand) or selling (supply) pressure is concentrated. It uses fractals, volume analysis, and price action to detect and highlight these zones on the chart. Key Features: Zone Detection Based on Fractals Identifies demand (support) and supply (resistance) zones using   fractal patterns   (local highs/lows). Zones are formed from   open prices   ar
      FREE
      Introduction This indicator detects volume spread patterns for buy and sell opportunity. The patterns include demand and supply patterns. You might use each pattern for trading. However, these patterns are best used to detect the demand zone (=accumulation area) and supply zone (=distribution area). Demand pattern indicates generally potential buying opportunity. Supply pattern indicates generally potential selling opportunity. These are the underlying patterns rather than direct price action. T
      FREE
      MetaCOT 2 is a set of indicators and specialized utilities for the analysis of the U.S. Commodity Futures Trading Commission reports. Thanks to the reports issued by the Commission, it is possible to analyze the size and direction of the positions of the major market participants, which brings the long-term price prediction accuracy to a new higher-quality level, inaccessible to most traders. These indicators, related to the fundamental analysis, can also be used as an effective long-term filter
      Supply and Demand MTFs
      Mohammed Zakana Al Mallouk
      Overview Supply & Demand (MTF) v1.00 is a MetaTrader 5 indicator that automatically identifies and draws key supply and demand zones from up to three timeframes on your current chart. Supply zones mark areas where selling pressure was strong; demand zones mark areas where buying pressure was strong. Features Multi-timeframe detection Scan the current chart plus two higher timeframes for zones. Candle-strength filter Require a configurable number of strong candles to confirm each zone. Adjust
      FREE
      UR Gamma MT5
      Krzysztof Jan Debski
      UR Gamma (alimenté par des calculs similaires trouvés dans les systèmes d'apprentissage automatique) UR Gamma est un outil d'analyse financière de pointe qui offre une version nouvelle et améliorée de l'indicateur classique WaveTrend. En incorporant des techniques avancées de traitement du signal numérique, UR Gamma répond à certaines des limites des algorithmes WaveTrend traditionnels et fournit une approche plus précise, robuste et dynamique pour identifier et mesurer les tendances de l'acti
      PNA Vwap
      Le Trung Kien Hoang
      Pna Vwap: Professional Multi-Timeframe VWAP Gain a professional edge and trade with institutional clarity. Pna Vwap is a powerful, all-in-one VWAP system Stop guessing the true market trend. Pna Vwap provides a clean, multi-dimensional view of the market by showing the real, volume-weighted average price across three critical timeframes. Understand where the value is, identify who is in control, and make trading decisions with greater confidence. Core Features & Key Advantages This is not a ba
      FREE
      QM Pattern Indicator MetaTrader 5 The Quasimodo Pattern (QM Pattern) Indicator is a classic chart pattern tool for MetaTrader 5 designed to detect and display QM and Reverse QM patterns. These patterns are crucial for market analysis, especially in the RTM style, helping traders recognize high-probability reversal zones. The QM pattern is displayed in blue, and the Reverse QM pattern in red, providing clear visual cues for effective trading decisions. «Indicator Installation & User Guide» MT5 In
      FREE
      Trade smarter, not harder: Empower your trading with Harmonacci Patterns This is arguably the most complete harmonic price formation auto-recognition indicator you can find for the MetaTrader Platform. It detects 19 different patterns, takes fibonacci projections as seriously as you do, displays the Potential Reversal Zone (PRZ) and finds suitable stop-loss and take-profit levels. [ Installation Guide | Update Guide | Troubleshooting | FAQ | All Products ] It detects 19 different harmonic pri
      Unlock powerful breakout opportunities The 123 Pattern is one of the most popular, powerful and flexible chart patterns. The pattern is made up of three price points: a bottom, a peak or valley, and a Fibonacci retracement between 38.2% and 71.8%. A pattern is considered valid when the price breaks beyond the last peak or valley, moment at which the indicator plots an arrow, rises an alert, and the trade can be placed. [ Installation Guide | Update Guide | Troubleshooting | FAQ | All Products ]
      EFW Pattern Trader is a powerful pattern scanner for Forex and Stock trading. The pattern detection in EFW Pattern Trader uses the Fractal Wave Theory, which captures the endless up and down movement of the market. Therefore, EFW Pattern Trader can be considered as the robust price action indicator. Any patterns in EFW Pattern Trader can be backtested visually in your strategy tester. Visual backtesting with pattern will show you how pattern will likely behave in the live trading. Therefore, you
      https://youtu.be/JJanqcNzLGM ,  https://youtu.be/l70MIHaQQa4 ,  https://youtu.be/pg0oiT5_8y0   Automated Supply and Demand Trading Edge MT5. These videos demonstrate how we apply the supply and demand system to our latest trading review and market analysis Enhance your Trading Strategy with the Supply and Demand Trading Edge MT5. Gain a competitive market advantage with the Supply and Demand Trading Edge MT5 indicator, a powerful tool that combines MACD signals with supply and demand zones. By
      Price Breakout pattern Scanner is the automatic scanner for traders and investors. It can detect following patterns automatically from your chart. Head and Shoulder - Common tradable pattern. Reverse Head and Shoulder - This pattern is the reverse formation of the Head and Shoulder. Double Top - When the price hits resistance level twice and decline toward the support level, the trader can anticipate sudden bearish breakout through the support level. Double Bottom - The double bottom pattern is
      Contact me for instruction, any questions! Introduction V Bottoms and Tops  (or Fibonacci Retracement)  are popular   chart patterns   among traders due to their potential for identifying trend reversals. These patterns are characterized by sharp and sudden price movements, creating a V-shaped or inverted V-shaped formation on the   chart . By recognizing these patterns, traders can anticipate potential shifts in market direction and position themselves accordingly.  V pattern is a powerful bul
      Eabotpro Signals v3.0 A professional MetaTrader 5 indicator designed to deliver high-precision trading signals with real-time notifications, trade management tools, and a clean interface. "Recommended Base time frame is 4H Fibo From input . and trade time frame 1 mint , and 5 mint " Key Features: High-Accuracy Signals : Optimized for precision and consistency across different market conditions. Smart Trade Panel : Displays entry price, targets, stop levels, performance stats, and profit trackin
      Le niveau Premium est un indicateur unique avec une précision de plus de 80 % des prédictions correctes ! Cet indicateur a été testé par les meilleurs Trading Specialists depuis plus de deux mois ! L'indicateur de l'auteur que vous ne trouverez nulle part ailleurs ! À partir des captures d'écran, vous pouvez constater par vous-même la précision de cet outil ! 1 est idéal pour le trading d'options binaires avec un délai d'expiration de 1 bougie. 2 fonctionne sur toutes les paires de devises
      The   Supply and Demand Zones indicator   is one of the best tools we have ever made. This great tool automatically draws supply and demand zones, the best places for opening and closing positions. It has many advanced features such as multi timeframe zones support, displaying the width of zones, alert notifications for retouched zones, and much more. Because of market fractality, this indicator can be used for any kind of trading. Whether you are a positional, swing, or intraday trader does no
      MetaCOT 2 is a set of indicators and specialized utilities for the analysis of the U.S. Commodity Futures Trading Commission reports. Thanks to the reports issued by the Commission, it is possible to analyze the size and direction of the positions of the major market participants, which brings the long-term price prediction accuracy to a new higher-quality level, inaccessible to most traders. These indicators, related to the fundamental analysis, can also be used as an effective long-term filter
      MACD Advanced
      Stanislav Korotky
      This indicator provides you with MACD formula applied to volume-aware Accumulation/Distribution and OnBalance Volumes indicators. In addition to tick volumes it supports special pseudo-real volumes, synthesized for Forex symbols where real volumes are unknown. More details on the volume surrogates may be found in description of another indicators - TrueVolumeSurrogate and OnBalanceVolumeSurrogate (algorithm of the latter is used internally in MACDAD for AD and OBV calculation before they procee
      Les acheteurs de ce produit ont également acheté
      Divergence Bomber
      Ihor Otkydach
      4.98 (66)
      Chaque acheteur de cet indicateur reçoit également gratuitement : L’outil exclusif « Bomber Utility », qui accompagne automatiquement chaque opération de trading, fixe les niveaux de Stop Loss et de Take Profit, et clôture les positions selon les règles de la stratégie Des fichiers de configuration (set files) pour adapter l’indicateur à différents actifs Des set files pour configurer le Bomber Utility selon différents modes : « Risque Minimum », « Risque Équilibré » et « Stratégie d’Attente » U
      Grabber System MT5
      Ihor Otkydach
      5 (16)
      Je vous présente un excellent indicateur technique : Grabber, qui fonctionne comme une stratégie de trading "tout-en-un", prête à l'emploi. En un seul code sont intégrés des outils puissants d'analyse technique du marché, des signaux de trading (flèches), des fonctions d'alerte et des notifications push. Chaque acheteur de cet indicateur reçoit également gratuitement : L'utilitaire Grabber : pour la gestion automatique des ordres ouverts Un guide vidéo étape par étape : pour apprendre à installe
      Combien de fois avez-vous acheté un indicateur de trading avec d' excellents backtests, des preuves de performance sur compte réel avec des chiffres fantastiques et des statistiques partout , mais après l'avoir utilisé, vous finissez par faire sauter votre compte ? Vous ne devriez pas faire confiance à un signal seul, vous devez savoir pourquoi il est apparu en premier lieu, et c'est ce que RelicusRoad Pro fait de mieux ! Manuel d'utilisation + Stratégies + Vidéos de formation + Groupe privé ave
      Quantum Trend Sniper
      Bogdan Ion Puscasu
      4.73 (51)
      Présentation       Quantum Trend Sniper Indicator   , l'indicateur révolutionnaire MQL5 qui transforme la façon dont vous identifiez et négociez les inversions de tendance ! Développé par une équipe de traders expérimentés avec une expérience commerciale de plus de 13 ans,       Indicateur Quantum Trend Sniper       est conçu pour propulser votre parcours de trading vers de nouveaux sommets grâce à sa manière innovante d'identifier les inversions de tendance avec une précision extrêmement élevée
      Algo Pumping
      Ihor Otkydach
      4.74 (19)
      PUMPING STATION – Votre stratégie personnelle «tout compris» Nous vous présentons PUMPING STATION – un indicateur Forex révolutionnaire qui transformera votre façon de trader en une expérience à la fois efficace et passionnante. Ce n’est pas seulement un assistant, mais un véritable système de trading complet, doté d’algorithmes puissants pour vous aider à trader de manière plus stable. En achetant ce produit, vous recevez GRATUITEMENT : Fichiers de configuration exclusifs : pour un réglage auto
      Top indicator for MT5   providing accurate signals to enter a trade without repainting! It can be applied to any financial assets:   forex, cryptocurrencies, metals, stocks, indices .  Watch  the video  (6:22) with an example of processing only one signal that paid off the indicator! MT4 version is here It will provide pretty accurate trading signals and tell you when it's best to open a trade and close it. Most traders improve their trading results during the first trading week with the help of
      Indicateur unique qui met en œuvre une approche professionnelle et quantitative pour signifier le trading de réversion. Il capitalise sur le fait que le prix dévie et revient à la moyenne de manière prévisible et mesurable, ce qui permet des règles d'entrée et de sortie claires qui surpassent largement les stratégies de trading non quantitatives. [ Installation Guide | Update Guide | Troubleshooting | FAQ | All Products ] Des signaux de trading clairs Étonnamment facile à échanger Couleurs et t
      Présentation       Quantum Breakout PRO   , l'indicateur révolutionnaire MQL5 qui transforme la façon dont vous négociez les zones d'évasion ! Développé par une équipe de traders expérimentés avec une expérience commerciale de plus de 13 ans,       Évasion quantique PRO       est conçu pour propulser votre parcours commercial vers de nouveaux sommets grâce à sa stratégie de zone de discussion innovante et dynamique. Quantum Breakout Indicator vous donnera des flèches de signalisation sur les z
      Quantum TrendPulse
      Bogdan Ion Puscasu
      5 (16)
      Présentation de   Quantum TrendPulse   , l'outil de trading ultime qui combine la puissance de   SuperTrend   ,   RSI   et   Stochastic   dans un seul indicateur complet pour maximiser votre potentiel de trading. Conçu pour les traders qui recherchent précision et efficacité, cet indicateur vous aide à identifier les tendances du marché, les changements de dynamique et les points d'entrée et de sortie optimaux en toute confiance. Caractéristiques principales : Intégration SuperTrend :   suivez f
      TPSproTREND PrO MT5
      Roman Podpora
      4.72 (18)
      VERSION MT4        —        ИНСТРУКЦИЯ RUS           —        INSTRUCTIONS  ENG Fonctions principales : Signaux d'entrée précis SANS RENDU ! Si un signal apparaît, il reste d’actualité ! Il s'agit d'une différence importante par rapport aux indicateurs de redessinage, qui peuvent fournir un signal puis le modifier, ce qui peut entraîner une perte de fonds en dépôt. Vous pouvez désormais entrer sur le marché avec plus de probabilité et de précision. Il existe également une fonction de coloration
      L'indicateur « Dynamic Scalper System MT5 » est conçu pour la méthode de scalping, permettant de trader au sein des vagues de tendance. Testé sur les principales paires de devises et l'or, il est compatible avec d'autres instruments de trading. Fournit des signaux pour l'ouverture de positions à court terme le long de la tendance, avec un support supplémentaire pour les fluctuations de prix. Principe de l'indicateur : De grandes flèches déterminent la direction de la tendance. Un algorithme de
      ACB Breakout Arrows MT5
      KEENBASE SOFTWARE SOLUTIONS
      5 (1)
      L’indicateur ACB Breakout Arrows fournit un signal d’entrée crucial sur le marché en détectant un modèle de rupture spécifique. Il analyse en continu le graphique à la recherche d’un momentum établi dans une direction et déclenche un signal précis juste avant le mouvement principal. Obtenez le scanner multi-actifs et multi-unités de temps ici - Scanner pour ACB Breakout Arrows MT5 Fonctionnalités principales Les niveaux de Stop Loss et Take Profit sont fournis par l’indicateur. Inclut un table
      AriX
      Temirlan Kdyrkhan
      1 (2)
      AriX Indicator for MT5 A powerful trend-following and signal-evaluation tool AriX is a custom MT5 indicator that combines Moving Averages and ATR-based risk/reward logic to generate clear buy/sell signals. It visualizes dynamic SL/TP levels, evaluates past trade outcomes, and displays win/loss statistics in a clean on-chart panel. Key features include: Buy/Sell signals based on MA crossovers ATR-based SL/TP1/TP2/TP3 levels with visual lines and labels Signal outcome tracking with real-time stat
      PZ Trend Trading MT5
      PZ TRADING SLU
      3.8 (5)
      Capture every opportunity: your go-to indicator for profitable trend trading Trend Trading is an indicator designed to profit as much as possible from trends taking place in the market, by timing pullbacks and breakouts. It finds trading opportunities by analyzing what the price is doing during established trends. [ Installation Guide | Update Guide | Troubleshooting | FAQ | All Products ] Trade financial markets with confidence and efficiency Profit from established trends without getting whip
      Trend Forecaster
      Alexey Minkov
      5 (7)
      The Trend Forecaster indicator utilizes a unique proprietary algorithm to determine entry points for a breakout trading strategy. The indicator identifies price clusters, analyzes price movement near levels, and provides a signal when the price breaks through a level. The Trend Forecaster indicator is suitable for all financial assets, including currencies (Forex), metals, stocks, indices, and cryptocurrencies. You can also adjust the indicator to work on any time frames, although it is recommen
      PZ Day Trading MT5
      PZ TRADING SLU
      2.83 (6)
      Effortless trading: non-repainting indicator for accurate price reversals This indicator detects price reversals in a zig-zag fashion, using only price action analysis and a donchian channel. It has been specifically designed for short-term trading, without repainting or backpainting at all. It is a fantastic tool for shrewd traders aiming to increase the timing of their operations. [ Installation Guide | Update Guide | Troubleshooting | FAQ | All Products ] Amazingly easy to trade It provides
      ARIPoint
      Temirlan Kdyrkhan
      ARIPoint is a powerful trading companion designed to generate high-probability entry signals with dynamic TP/SL/DP levels based on volatility. Built-in performance tracking shows win/loss stats, PP1/PP2 hits, and success rates all updated live. Key Features: Buy/Sell signals with adaptive volatility bands Real-time TP/SL/DP levels based on ATR Built-in MA Filter with optional ATR/StdDev volatility Performance stats panel (Success, Profit/Loss, PP1/PP2) Alerts via popup, sound, push, or email Cu
      PZ Swing Trading MT5
      PZ TRADING SLU
      5 (5)
      Protect against whipsaws: revolutionize your swing trading approach Swing Trading is the first indicator designed to detect swings in the direction of the trend and possible reversal swings. It uses the baseline swing trading approach, widely described in trading literature. The indicator studies several price and time vectors to track the aggregate trend direction and detects situations in which the market is oversold or overbought and ready to correct. [ Installation Guide | Update Guide | Tro
      TrendCatcher Indicator - Features and Usage Guide =============================================== Overview -------- TrendCatcher is a MetaTrader 5 (MT5) custom indicator designed for identifying trend changes using Exponential Moving Average (EMA) crossovers with optional Average Directional Index (ADX) filtering. It provides visual signals, alerts, and dynamic trend zones for better trading decisions. Key Features ------------ 1. EMA Crossover Signals    - Fast EMA (default: 20-period) and Sl
      Shock Pullback
      Suleiman Alhawamdah
      Indicateur Shock Pullback - Une véritable révolution dans l'analyse de marché L'indicateur Shock Pullback représente une avancée majeure dans la détection des retracements et zones d'accumulation. Basé sur un algorithme complètement innovant, il permet aux traders d'identifier des opportunités de trading, de suivre les mouvements de prix, et de détecter facilement et avec une clarté absolue les retracements, zones d'accumulation, gaps et cassures. Caractéristiques principales : Lignes Shock Pull
      TPSpro RFI Levels MT5
      Roman Podpora
      4.53 (19)
      Zones de retournement - niveaux / Zones actives d'un acteur majeur INSTRUCTIONS RUS   /   INSTRUCTIONS   ENG   /   Version MT4 CHAQUE ACHETEUR DE CET INDICATEUR       OBTENEZ EN PLUS   GRATUITEMENT   : 3 mois       accès aux signaux de trading du service       SUPER SIGNAUX       — points d’entrée prêts à l’emploi selon l’algorithme TPSproSYSTEM. 3 mois       accès à des supports de formation avec des mises à jour régulières - immersion dans la stratégie et la croissance professionnelle. Assist
      Berma Bands
      Muhammad Elbermawi
      5 (7)
      L'indicateur Berma Bands (BB) est un outil précieux pour les traders qui cherchent à identifier et à capitaliser sur les tendances du marché. En analysant la relation entre le prix et les BB, les traders peuvent déterminer si un marché est dans une phase de tendance ou de range. Visitez le [ Berma Home Blog ] pour en savoir plus. Les bandes de Berma sont composées de trois lignes distinctes : la bande de Berma supérieure, la bande de Berma moyenne et la bande de Berma inférieure. Ces lignes sont
      The AX Forex Indicator MT5 is a sophisticated trading tool designed to provide traders with a comprehensive analysis of multiple currency pairs. This   powerful indicator   simplifies the complex nature of the forex market, making it accessible for both novice and experienced traders. AX Forex Indicator uses   advanced algorithms   to detect trends, patterns and is an essential tool for traders aiming to enhance their forex trading performance. With its robust features, ease of use, and reliabl
      Advanced Supply Demand MT5
      Bernhard Schweigert
      4.5 (14)
      La meilleure solution pour tout commerçant débutant ou expert ! Cet indicateur est un outil de trading unique, de haute qualité et abordable car nous avons intégré un certain nombre de fonctionnalités propriétaires et une nouvelle formule. Avec cette mise à jour, vous pourrez afficher des zones à double horaire. Vous pourrez non seulement afficher un TF plus élevé, mais afficher les deux, le graphique TF, PLUS le TF supérieur : AFFICHAGE DES ZONES NICHÉES. Tous les traders Supply Demand vont ado
      ARICoins
      Temirlan Kdyrkhan
      ARICoin is a powerful trading companion designed to generate high-probability entry signals with dynamic TP/SL/DP levels based on volatility. Built-in performance tracking shows win/loss stats, PP1/PP2 hits, and success rates all updated live. Key Features: Buy/Sell signals with adaptive volatility bands Real-time TP/SL/DP levels based on ATR Built-in MA Filter with optional ATR/StdDev volatility Performance stats panel (Success, Profit/Loss, PP1/PP2) Alerts via popup, sound, push, or email Cust
      Support Resistance Catcher Indicator Features and Explanation Overview: The Support Resistance Catcher is a custom MT5 indicator designed to identify and visualize supply (resistance) and demand (support) zones based on candlestick price action. It detects zones where price has reversed after rallies or drops, using wick rejections and clustering. The indicator draws horizontal rectangles for active and historical zones, with customizable colors, labels, and alerts. Key Features: 1. Zone Det
      Overview The Professional CDV with Aggressive Score is a comprehensive volume analysis tool that combines visual Cumulative Delta Volume (CDV) representation with an advanced aggressive scoring system. Built using proven Professional Orderflow Platform methodology, this indicator provides traders with deep insights into market microstructure and volume dynamics. Key Features Professional Orderflow CDV Implementation Authentic Professional Orderflow Platform delta multiplier calculation methodolo
      MetaForecast M5
      Vahidreza Heidar Gholami
      5 (3)
      MetaForecast prédit et visualise l'avenir de n'importe quel marché en se basant sur les harmoniques des données de prix. Bien que le marché ne soit pas toujours prévisible, s'il y a un motif dans les prix, MetaForecast peut prédire l'avenir aussi précisément que possible. Comparé à d'autres produits similaires, MetaForecast peut générer des résultats plus précis en analysant les tendances du marché. Paramètres d'entrée Past size (Taille passée) Spécifie le nombre de barres que MetaForecast util
      Meta Cipher A
      SILICON HALLWAY PTY LTD
      5 (1)
      Meta Cipher A: Precision Overlay Suite for Price Action Meta Cipher A brings the popular Market Cipher A concept to MetaTrader 5 as a precision overlay indicator. Engineered to display preemptive signals directly on your price chart, it combines an 8 EMA ribbon, WaveTrend analysis, and eight distinct signal types to help you spot entries, exits, and high risk environments before they fully develop. While Meta Cipher A stands strong on its own, it is designed to pair naturally with Meta Ciphe
      Unlock hidden profits: accurate divergence trading for all markets Tricky to find and scarce in frequency, divergences are one of the most reliable trading scenarios. This indicator finds and scans for regular and hidden divergences automatically using your favourite oscillator. [ Installation Guide | Update Guide | Troubleshooting | FAQ | All Products ] Easy to trade Finds regular and hidden divergences Supports many well known oscillators Implements trading signals based on breakouts Displays
      Plus de l'auteur
      Introduction to Fractal Pattern Scanner Fractal Indicator refers to the technical indicator that makes use of the fractal geometry found in the financial market. Fractal Pattern Scanner is the advanced Fractal Indicator that brings the latest trading technology after the extensive research and development work in the fractal geometry in the financial market. The most important feature in Fractal Pattern Scanner is the ability to measure the turning point probability as well as the trend probabi
      Introduction Harmonic Patterns are best used to predict potential turning point. Traditionally, Harmonic Pattern was identified manually connecting peaks and troughs points in the chart. Manual harmonic pattern detection is painfully tedious and not suitable for everyone. You are often exposed under subjective pattern identification with manual pattern detection. To avoid these limitations, Harmonic Pattern Plus was designed to automate your harmonic pattern detection process. The functionality
      Introduction to Chart Pattern MT Chart Pattern MT is a chart pattern scanner to detect the triangle pattern, falling wedge pattern, rising wedge pattern, channel pattern and so on. Chart Pattern MT uses highly sophisticated chart pattern detection algorithm. However, we have designed it in the easy to use with intuitive user interface. Chart Pattern MT will show all the patterns in your chart in the most efficient format for your trading. You do not have to do tedious manual pattern detection an
      Introduction Harmonic Patterns are best used to predict potential turning point. Traditionally, Harmonic Pattern was identified manually connecting peaks and troughs points in the chart. Manual harmonic pattern detection is painfully tedious and not suitable for everyone. You are often exposed under subjective pattern identification with manual pattern detection. To avoid these limitations, Harmonic Pattern Plus was designed to automate your harmonic pattern detection process. The functionality
      Elliott Wave Trend was designed for the scientific wave counting. This tool focuses to get rid of the vagueness of the classic Elliott Wave Counting using the guideline from the template and pattern approach. In doing so, firstly Elliott Wave Trend offers the template for your wave counting. Secondly, it offers Wave Structural Score to assist to identify accurate wave formation. It offers both impulse wave Structural Score and corrective wave Structure Score. Structural Score is the rating to sh
      Introduction to X3 Chart Pattern Scanner X3 Cherart Pattern Scanner is the non-repainting and non-lagging indicator detecting X3 chart patterns including Harmonic pattern, Elliott Wave pattern, X3 patterns, and Japanese Candlestick patterns. Historical patterns match with signal patterns. Hence, you can readily develop the solid trading strategy in your chart. More importantly, this superb pattern scanner can detect the optimal pattern of its kind. In addition, you can switch on and off individu
      Peak Trough Analysis is the great tool to detect peaks and troughs in your chart. Peak Trough Analysis tool can use three different peaks and troughs detection algorithm. The three algorithm include the orignal Fractals Indicator by Bill Williams, the Modified Fractals indicator and ZigZag indicator. You can use this peak and trough analysis tool to detect the price pattern made up from Equilibrium Fractal-Wave process. For further usage, there are good guide line on how to use this peak trough
      FREE
      Elliott Wave Trend was designed for the scientific wave counting. This tool focuses to get rid of the vagueness of the classic Elliott Wave Counting using the guideline from the template and pattern approach. In doing so, firstly Elliott Wave Trend offers the template for your wave counting. Secondly, it offers Wave Structural Score to assist to identify accurate wave formation. It offers both impulse wave Structural Score and corrective wave Structure Score. Structural Score is the rating to sh
      Introduction This indicator detects volume spread patterns for buy and sell opportunity. The patterns include demand and supply patterns. You might use each pattern for trading. However, these patterns are best used to detect the demand zone (=accumulation area) and supply zone (=distribution area). Demand pattern indicates generally potential buying opportunity. Supply pattern indicates generally potential selling opportunity. These are the underlying patterns rather than direct price action. T
      FREE
      Auto Chart Alert MT5
      Young Ho Seo
      3.83 (6)
      Introduction Auto Chart Alert is a convenient tool to set alert for your trading in your chart. With Auto Chart Alert, you can set the alert line in one click in your desired location in your chart. You can even set alert over the sloped lines in your chart. Auto Chart Alert is a great tool when you have to watch out importnat support and resistance levels for your trading. You can receive the sound alert, email and push notification when the price hit the alert line at you desired location. Au
      FREE
      Introduction to Sideways Market Analyzer Notable period of Low volatility and non-trending movements in the financial market is considered as Sideways Market. Sooner or later, the low volatility will increase and the price will pick up a trend after Sideways Market. In terms of trading point of view, Sideways Market can serve as the very good entry timing for traders. Sideways Market is also quite often the representation of accumulation of large orders from big investors. Therefore, knowing the
      EFW Pattern Trader is a powerful pattern scanner for Forex and Stock trading. The pattern detection in EFW Pattern Trader uses the Fractal Wave Theory, which captures the endless up and down movement of the market. Therefore, EFW Pattern Trader can be considered as the robust price action indicator. Any patterns in EFW Pattern Trader can be backtested visually in your strategy tester. Visual backtesting with pattern will show you how pattern will likely behave in the live trading. Therefore, you
      Introduction to Harmonic Pattern Scenario Planner The present state of Forex market can go through many different possible price paths to reach its future destination. Future is dynamic. Therefore, planning your trade with possible future scenario is an important step for your success. To meet such a powerful concept, we introduce the Harmonic Pattern Scenario Planner, the first predictive Harmonic Pattern Tool in the world among its kind. Main Features Predicting future patterns for scenario
      Introduction to Harmonic Pattern Scenario Planner The present state of Forex market can go through many different possible price paths to reach its future destination. Future is dynamic. Therefore, planning your trade with possible future scenario is an important step for your success. To meet such a powerful concept, we introduce the Harmonic Pattern Scenario Planner, the first predictive Harmonic Pattern Tool in the world among its kind. Main Features Predicting future patterns for scenario
      Peak Trough Analysis is the great tool to detect peaks and troughs in your chart. Peak Trough Analysis tool can use three different peaks and troughs detection algorithm. The three algorithm include the orignal Fractals Indicator by Bill Williams, the Modified Fractals indicator and ZigZag indicator. You can use this peak and trough analysis tool to detect the price pattern made up from Equilibrium Fractal-Wave process. For further usage, there are good guide line on how to use this peak trough
      FREE
      Mean Reversion Supply Demand Indicator Mean Reversion Supply Demand is the indicator to detect the important supply demand zone in your chart. The concept of supply demand trading relies on the quantity mismatching between buying and selling volumes in the financial market. Typically, supply demand zone serves to predict the turning point. The wave pattern, for any supply demand zone to work as an successful trade, looks like the price must touch the base zone, move away and then return to zone
      Mean Reversion Supply Demand Indicator Mean Reversion Supply Demand is the indicator to detect the important supply demand zone in your chart. The concept of supply demand trading relies on the quantity mismatching between buying and selling volumes in the financial market. Typically, supply demand zone serves to predict the turning point. The wave pattern, for any supply demand zone to work as an successful trade, looks like the price must touch the base zone, move away and then return to zone
      Introduction This indicator detects volume spread patterns for buy and sell opportunity. The patterns include demand and supply patterns. You might use each pattern for trading. However, these patterns are best used to detect the demand zone (=accumulation area) and supply zone (=distribution area). Demand pattern indicates generally potential buying opportunity. Supply pattern indicates generally potential selling opportunity. These are the underlying patterns rather than direct price action. T
      Introduction to Fractal Moving Average Fractal Moving Average indicator was designed as part of Fractal Pattern Scanner. Inside Fractal Pattern Scanner, Fractal Moving Average Indicator was implemented as multiple of chart objects. With over thousands of chart object, we find that it was not the best and efficient ways to operate the indicator. It was computationally too heavy for the indicator. Hence, we decide to implement the indicator version of Fractal Moving Average indicator to benefit ou
      FREE
      Introduction To Time Box Indicator Time Box Indicator is a must have indicator for any trader. It will display daily, weekly and Monthly box according to your preferences. Yet, you can extend any important price levels in your chart automatically. You can use them as the significant support and resistance levels. It is very simple but effective tool for your trading. Graphic Setting Use White Chart Line Style for Current Open price Daily Setting Update Timeframe for daily box Number of days to
      FREE
      Introduction This indicator detects volume spread patterns for buy and sell opportunity. The patterns include demand and supply patterns. You might use each pattern for trading. However, these patterns are best used to detect the demand zone (=accumulation area) and supply zone (=distribution area). Demand pattern indicates generally potential buying opportunity. Supply pattern indicates generally potential selling opportunity. These are the underlying patterns rather than direct price action. T
      FREE
      Introduction to GARCH Indicator GARCH is the short initial for Generalized Autoregressive Conditional Heteroskedasticity and it is the volatility prediction model commonly used in financial industry. GARCH model was first appeared in the work by Danish Economist, Tim Peter Bollerslev in 1986. The 2003 Nobel Prize winner, Robert F Engle also added much contribution for the refinement of GARCH model with Tim’s work. Our GARCH INM predictor took the original method of Nelder Mead for GARCH model bu
      FREE
      Introduction to Order Risk Management EA ORM EA is specially designed for fast and accurate market order execution to be used with our Price Action and Econometric Trading strategies listed below. ORM EA is fully automatic and ORM EA is also very easy to use. ORM EA is totally free of charge. You can also use this robust order execution feature of this ORM EA for any other your own trading strategy. Trading Strategy Guide Order Risk Management EA provides the guide for the risk management for y
      FREE
      Introduction to Fractal Pattern Scanner Fractal Indicator refers to the technical indicator that makes use of the fractal geometry found in the financial market. Fractal Pattern Scanner is the advanced Fractal Indicator that brings the latest trading technology after the extensive research and development work in the fractal geometry in the financial market. The most important feature in Fractal Pattern Scanner is the ability to measure the turning point probability as well as the trend probabil
      Introduction to Fractal Moving Average Fractal Moving Average indicator was designed as part of Fractal Pattern Scanner. Inside Fractal Pattern Scanner, Fractal Moving Average Indicator was implemented as multiple of chart objects. With over thousands of chart object, we find that it was not the best and efficient ways to operate the indicator. It was computationally too heavy for the indicator. Hence, we decide to implement the indicator version of Fractal Moving Average indicator to benefit o
      FREE
      Introduction To Time Box Indicator Time Box Indicator is a must have indicator for any trader. It will display daily, weekly and Monthly box according to your preferences. Yet, you can extend any important price levels in your chart automatically. You can use them as the significant support and resistance levels. It is very simple but effective tool for your trading. Graphic Setting Use White Chart Line Style for Current Open price Daily Setting Update Timeframe for daily box Number of days to
      FREE
      This innovative technical indicator was created to detect quiet market period before the beginning of the high volatile market. Like many good technical indicators, this Market Activity Index is very stable and it is widely applicable to many financial and non financial instruments without too much restriction. The Market Activity Index can be used best to visualize the alternating form of low and high volatile market. It is very useful tool to pick up the quiet market but ironically this is the
      Introduction to Fibonacci Volatility Indicator Volatility indicator can help you to detect any statistical advantage for your trading. Especially, if you are trading with Price Action and Price Patterns, then we recommend to use the Volatility indicator together with your strategy. Especically, Fibonacci Volatility indicator combines the market volatiltiy with Fibonacci Analysis to provide you more advanced volatiltiy indicator. Main Features Fibonacci Volatility in Z score Configuration Mode Fi
      Introduction Excessive Momentum Indicator is the momentum indicator to measure the excessive momentum directly from raw price series. Hence, this is an extended price action and pattern trading. Excessive Momentum Indicator was originally developed by Young Ho Seo. This indicator demonstrates the concept of Equilibrium Fractal Wave and Practical Application at the same time. Excessive Momentum detects the market anomaly. Excessive momentum will give us a lot of clue about potential reversal and
      Introduction Excessive Momentum Indicator is the momentum indicator to measure the excessive momentum directly from raw price series. Hence, this is an extended price action and pattern trading. Excessive Momentum Indicator was originally developed by Young Ho Seo. This indicator demonstrates the concept of Equilibrium Fractal Wave and Practical Application at the same time. Excessive Momentum detects the market anomaly. Excessive momentum will give us a lot of clue about potential reversal and
      Filtrer:
      rodnaya
      216
      rodnaya 2022.01.15 18:17 
       

      Спасибо супер:)))

      jorge luna
      146
      jorge luna 2021.06.02 00:46 
       

      I found it to be an excellent indicator, it seems to me that the developer needs to give us more information about its potential, since there is no description of the entire use of the configuration buttons, otherwise, it has helped me make good decisions regarding my trading, many thanks to the developer for this great tool.

      Jose Luis
      103
      Jose Luis 2020.06.26 20:28 
       

      EXCELLENT INDICATOR, VERY POWERFUL AND RELIABLE...VERY RECOMMENDED!!!

      Répondre à l'avis