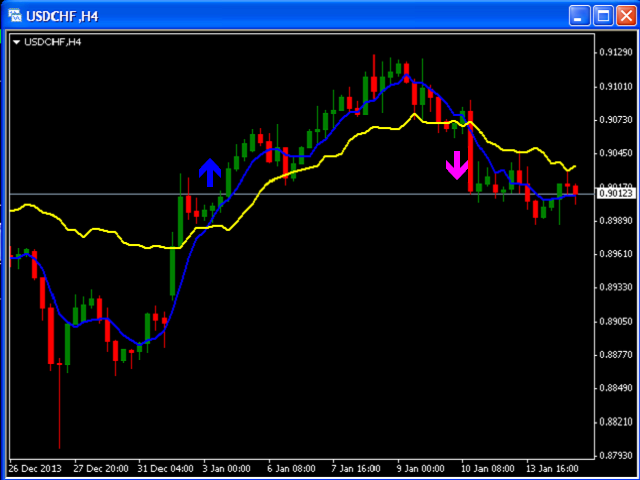
Fibonacci Moving Averages with Buy and Sell Arrows

Fibonacci sequence is defined by integer sequence: 0, 1, 1, 2, 3, 5, 8, 13, 21, 34, 55, 89, 144, ...

By definition, it starts from 0 and 1, the next number is calculated as a sum of two previous numbers.

Instead of the standard moving average, the indicator uses the following calculation of average price: Bar0 + Bar1 + Bar2 + Bar3 + Bar5 + Bar8 + Bar13 + Bar21 + ...

Input parameters:

  • fiboNum - numbers in the following integer sequence for Fibo Moving Average 1. 5 on default.
  • fiboNum2 - numbers in the following integer sequence Fibo Moving Average 2. 15 on default.
Produits recommandés
Free automatic Fibonacci is an indicator that automatically plots a Fibonacci retracement based on the number of bars you select on the BarsToScan setting in the indicator. The Fibonacci is automatically updated in real time as new highest and lowest values appears amongst the selected bars. You can select which level values to be displayed in the indicator settings. You can also select the color of the levels thus enabling the trader to be able to attach the indicator several times with differe
FREE
Fibonacci sequence is defined by integer sequence: 0, 1, 1, 2, 3, 5, 8, 13, 21, 34, 55, 89, 144, ... By definition, it starts from 0 and 1, the next number is calculated as a sum of two previous numbers. Instead of the standard moving average, the indicator uses the following calculation of average price: Bar0 + Bar1 + Bar2 + Bar3 + Bar5 + Bar8 + Bar13 + Bar21 + ... This indicator shows 2 moving Fibonacci lines and arrows when 2 these lines crossing each other. If an Aqua line is crossing a Yell
Auto Fib Retracements
Ross Adam Langlands Nelson
4.2 (5)
Automatic Fibonacci Retracement Line Indicator. This indicator takes the current trend and if possible draws Fibonacci retracement lines from the swing until the current price. The Fibonacci levels used are: 0%, 23.6%, 38.2%, 50%, 61.8%, 76.4%, 100%. This indicator works for all charts over all timeframes. The Fibonacci levels are also recorded in buffers for use by other trading bots. Any comments, concerns or additional feature requirements are welcome and will be addressed promptly. 
FREE
Développement de la version précédente de l'indicateur ZigZag WaveSize MT4 ZigZag WaveSize - indicateur standard ZigZag modifié avec ajout d'informations sur la longueur d'onde en points, niveaux et différentes logiques d'alertes Améliorations générales : Adaptation du code pour MetaTrader 5 Travail optimisé avec les objets graphiques Nouveautés : Niveaux horizontaux aux extrêmes Choix du type de niveaux : horizontal/rayons/segments Filtre de niveaux liquides (non percés par le prix) Tampon po
FREE
L'indicateur   "Haven Key Levels PDH PDL"   aide les traders à visualiser les niveaux clés sur le graphique. Il marque automatiquement les niveaux suivants : DO (Daily Open)   — Niveau d'ouverture du jour. NYM (New York Midnight)   — Niveau de minuit à New York. PDH (Previous Day High)   — Plus haut du jour précédent. PDL (Previous Day Low)   — Plus bas du jour précédent. WO (Weekly Open)   — Niveau d'ouverture de la semaine. MO (Monthly Open)   — Niveau d'ouverture du mois. PWH (Previous Week
FREE
Fibonacci Trend Indicator
Vinoth Durairaj Durairaj
Fibonacci Trend Indicator for MT5 Unlock the power of Fibonacci analysis on your MetaTrader 5 charts! Our   Fibonacci Trend Indicator   automatically plots dynamic support and resistance levels so you can spot trends, reversals, and breakout opportunities at a glance. Features & Advantages Automatic Fibonacci Levels Instantly displays seven key Fibonacci retracement levels based on the highest and lowest prices from your chosen lookback period — no manual work required. Dynamic Trend Adaptatio
FREE
Donchian Channel DC is the indicator of Donchian Channels, that plots maximum and minimum values of a specific period, besides mean value line. It´s possible to configure simple period for analysis and the indicator will plot all three values. You can trade with this indicator as trend or reversal, according to each strategy. Do not let to test others indicators as soon as others expert advisors.
How the day starts
Sergio Antoni Escudero Tirado
This indicator draws the high intraday price and the low intraday price of the first n minutes of the day. The chart shows the days with vertical lines and two horizontal lines to indicate the max and the min close price of the n first minutes of the day. The max/min lines start and end with the day calculated. With this indicator you can see how starts the day compared with the previous days. It is valid for any market inasmuch as the start time is calculated with the data received. Parameter
FREE
Raymond Cloudy Day Indicator for MT5 – Pivot-Based Reversal and Trend Levels Raymond Cloudy Day Indicator is a pivot-based level indicator for MetaTrader 5 (MT5). It was developed by Ngo The Hung based on Raymond’s original idea and is designed to give a structured view of potential reversal zones, trend extensions and support/resistance levels directly on the chart. The default settings are optimised for XAUUSD on the H1 timeframe, but the indicator can be tested and adjusted for other symbols
FREE
Necessary for traders: tools and indicators Waves automatically calculate indicators, channel trend trading Perfect trend-wave automatic calculation channel calculation , MT4 Perfect trend-wave automatic calculation channel calculation , MT5 Local Trading copying Easy And Fast Copy , MT4 Easy And Fast Copy , MT5 Local Trading copying For DEMO Easy And Fast Copy , MT4 DEMO Easy And Fast Copy , MT5 DEMO Advanced Bollinger Bands: 1. The Bollinger rail will change color with the direction" 2. The
FREE
Necessary for traders: tools and indicators Waves automatically calculate indicators, channel trend trading Perfect trend-wave automatic calculation channel calculation , MT4 Perfect trend-wave automatic calculation channel calculation , MT5 Local Trading copying Easy And Fast Copy , MT4 Easy And Fast Copy , MT5 Local Trading copying For DEMO Easy And Fast Copy , MT4 DEMO Easy And Fast Copy , MT5 DEMO Fibo: from KTrade 1. Automatically calculate and analyze the band. -> Get the desired band 2.
FREE
1. Overview The ATR Dynamic Stop (CE) is a powerful technical indicator designed to help traders identify and follow market trends. Its core function is to provide a dynamic trailing stop-loss based on price volatility, as measured by the Average True Range (ATR) indicator. The main objectives of the ATR Dynamic Stop are: Profit Optimization: It helps you ride a strong trend by setting a reasonable stop-loss, preventing premature exits due to minor market noise and fluctuations. Risk Management:
FREE
This is Gekko's Cutomized Cutomized Average Directional Index (ADX), a customized version of the famous ADX indicator. Use the regular ADX and take advantage two entry signals calculations and different ways of being alerted whenever there is potential entry or exit point. Inputs Period: Period for the ADX calculation; PlotSignalType: How will the indicator calculate entry (swing) signals: 1- ShowSwingsOnTrendLevel : Show Signals for Trend Confirmation Swings; 2- ShowSwingsOnTrendLevelDirection
EMAs Mago Trader
Flavio Javier Jarabeck
5 (2)
For those traders and students who follow the famous brazilian trader Igor Rodrigues (Mago Trader) here it is his famous 2 EMAs - based on Phi ratios - and packed with a twist: a Filling Area , to easily and visually spot the corresponding trend on the chart. You can turn On and Off this filling. If you don't know Igor Rodrigues and you are a brazilian trader and student, just google for him... Very simple and useful indicator. If you are looking also for the MACD -based indicator of this trade
FREE
This indicators automatically draws the   support and resistances   levels (key levels) for you once you've dropped it on a chart. It reduces the hustle of drawing and redrawing these levels every time you analyse prices on a chart. With it, all you have to do is drop it on a chart, adjust the settings to your liking and let the indicator do the rest. But wait, it gets better; the indicator is absolutely free! For more information:  https://youtu.be/rTxbPOBu3nY For more free stuff visit:  https:
FREE
This indicator is an automated version of the Fibonacci retracement (Fib) indicator. Deciding the best areas to use when drawing the fib can be tricky and this  indicator was made with that in mind. When you drop it on the chart it will automatically choose the best points to draw the fib with, but in case you aren't satisfied with those regions, you can adjust it as you wish.
FREE
Renko System
Marco Montemari
This indicator can be considered as a trading system. It offers a different view to see the currency pair: full timeless indicator, can be used for manual trading or for automatized trading with some expert advisor. When the price reaches a threshold a new block is created according to the set mode. The indicator beside the Renko bars, shows also 3 moving averages. Features renko mode median renko custom median renko 3 moving averages wicks datetime indicator for each block custom notification
FlatBreakout MT5 (Free Version) Flat Range Detector and Breakout Panel for MT5 — GBPUSD Only FlatBreakout MT5   is the free version of the professional FlatBreakoutPro MT5 indicator, specially designed for flat (range) detection and breakout signals on the   GBPUSD   pair only. Perfect for traders who want to experience the unique fractal logic of FlatBreakout MT5 and test breakout signals on a live market without limitations. Who Is This Product For? For traders who prefer to trade breakout of
FREE
AUTO FIBONACCI MULTI-TIMEFRAME TOOLKIT Technical analysis tool that automatically draws Fibonacci levels for 4H, Daily, Weekly, and Monthly sessions. AUTOMATIC FIBONACCI RETRACEMENTS (7 CLASSIC LEVELS): - 0.0% (Previous session Low - support level) - 23.6% (Fibonacci Golden Ratio - early entry level) - 38.2% (Strong retracement level) - 50.0% (Key pivot level highlighted in YELLOW - market equilibrium) - 61.8% (Main Golden Ratio - critical decision level) - 78.6% (Deep retracement level) - 100.0
PZ Penta O MT5
PZ TRADING SLU
3.5 (4)
The Penta-O is a 6-point retracement harmonacci pattern which usually precedes big market movements. Penta-O patterns can expand and repaint quite a bit. To make things easier this indicator implements a twist: it waits for a donchian breakout in the right direction before signaling the trade. The end result is an otherwise repainting indicator with a very reliable trading signal. The donchian breakout period is entered as an input. [ Installation Guide | Update Guide | Troubleshooting | FAQ | A
FREE
It predicts the most likely short-term price movement based on advanced mathematical calculations. Features Estimation of immediate price movement; Calculation of the real market trend; Calculation of the most important support and resistance levels; Algorithms optimized for making complex mathematical calculations with a minimal drain of system resources; Self-adjusting for better performance, so it’s able to work properly at any symbol (no matter how exotic it is) and any timeframe; Compatibl
FREE
ICT Institutional Levels
Aesen Noah Remolacio Perez
This indicator automatically draws horizontal lines at 00s, 20s, 50s and 80s levels.  If you trade ICT concepts and are an ICT Student, then you know that these levels are used as institutional support/resistance levels and/or fibonacci retracement anchor points.  Features Draws horizontal lines at 00, 20, 50 and 80 levels above and below current market price . Choose the amount of levels to show on chart Customizable line colors  Recommended for forex currency pairs. Saves time looking for thes
FREE
Fvg Edge
Ahmad Meftah Abdulsalam Alawwami
5 (1)
FVG Smart Zones – Édition Gratuite Indicateur de Détection des Gaps de Valeur Juste pour MetaTrader 5 (MT5) Vous recherchez un véritable outil de trading – pas juste un autre indicateur au hasard ? FVG Smart Zones – Édition Gratuite offre une vision professionnelle du marché en détectant automatiquement les Gaps de Valeur Juste (FVG) et en mettant en évidence des zones de trading à haute probabilité directement sur votre graphique. Conçu pour les traders suivant : Smart Money Concepts (
FREE
Statistical Arbitrage Spread Generator for Cointegration [MT5] What is Pair Trading? Pair trading is a market-neutral strategy that looks to exploit the relative price movement between two correlated assets — instead of betting on the direction of the market. The idea? When two assets that usually move together diverge beyond a statistically significant threshold, one is likely mispriced. You sell the expensive one, buy the cheap one , and profit when they converge again. It’s a statistica
FREE
Market Trend Indicator Analog Copyright 2025, Jose María Molina Sánchez molinatrader67@gmail.com | Version 1.00 Introduction Le Market Trend Indicator Analog est un indicateur avancé conçu pour mesurer la force et la direction de la tendance du marché en temps réel. Contrairement aux oscillateurs traditionnels, cet indicateur utilise un système de filtrage adaptatif qui réagit dynamiquement aux conditions du marché, offrant une représentation analogique précise entre -100 et +100. Son
Индикатор iVeles_Perfect_Oscilator является опережающим и одним из самых лучших осциляторов на сегодняшний день,  использует специализированный расчет текущих цен графика.  Очень качественно и своевременно показывает смену направления, очень точный подход к уровням перекупленности и перепроданности, что позволяет своевременно принять решение по сделке.  Работает качественно на любом ТФ и с любым инструментом. Параметры: Period - период расчетов Average  - усреднение  МА Method - применяемый мето
Fibonacci Moving Averages
Brendan Jonathan Stoyanowski-campbell
2 (1)
OVERVIEW The Fibonacci Moving Averages are a toolkit which allows the user to configure different types of Moving Averages based on key Fibonacci numbers. Moving Averages are used to visualise short-term and long-term support and resistance which can be used as a signal where price might continue or retrace. Moving Averages serve as a simple yet powerful tool that can help traders in their decision-making and help foster a sense of where the price might be moving next. The aim of this scrip
FREE
Description générale Cet indicateur est une version améliorée du Canal Donchian classique, enrichie de fonctionnalités pratiques pour le trading réel. En plus des trois lignes standard (supérieure, inférieure et ligne médiane), le système détecte les cassures et les affiche visuellement avec des flèches sur le graphique, en montrant uniquement la ligne opposée à la direction actuelle de la tendance pour une lecture plus claire. L’indicateur comprend : Signaux visuels : flèches colorées lors des
FREE
SC MTF Stochastic MT5
Krisztian Kenedi
4.87 (15)
Highly configurable Stochastic indicator. Features: Highly customizable alert functions (at levels, crosses, direction changes via email, push, sound, popup) Multi timeframe ability Color customization (at levels, crosses, direction changes) Linear interpolation and histogram mode options Works on strategy tester in multi timeframe mode (at weekend without ticks also) Adjustable Levels Parameters: Stochastic Timeframe:  You can set the lower/higher timeframes for Stochastic. Stochastic    Bar S
FREE
Auto Optimized RSI   est un indicateur fléché intelligent et facile à utiliser, conçu pour fournir des signaux d’achat et de vente précis. Il utilise des simulations de trading sur des données historiques pour déterminer automatiquement les niveaux RSI les plus efficaces pour chaque instrument et période. Cet indicateur peut être utilisé comme un système de trading autonome ou intégré dans votre stratégie existante, et il est particulièrement utile pour les traders à court terme. Contrairement a
Les acheteurs de ce produit ont également acheté
Si vous achetez cet indicateur, vous recevrez mon Gestionnaire de Trading Professionnel + EA  GRATUITEMENT. Tout d'abord, il convient de souligner que ce système de trading est un indicateur non repeint, non redessiné et non retardé, ce qui le rend idéal pour le trading manuel et automatisé. Cours en ligne, manuel et téléchargement de préréglages. Le "Système de Trading Smart Trend MT5" est une solution de trading complète conçue pour les traders débutants et expérimentés. Il combine plus de 10
Divergence Bomber
Ihor Otkydach
4.99 (77)
Chaque acheteur de cet indicateur reçoit également gratuitement : L’outil exclusif « Bomber Utility », qui accompagne automatiquement chaque opération de trading, fixe les niveaux de Stop Loss et de Take Profit, et clôture les positions selon les règles de la stratégie Des fichiers de configuration (set files) pour adapter l’indicateur à différents actifs Des set files pour configurer le Bomber Utility selon différents modes : « Risque Minimum », « Risque Équilibré » et « Stratégie d’Attente » U
Gold Sniper Scalper Pro
Ich Khiem Nguyen
5 (4)
Gold Sniper Scalper Pro - Système de Trading d'Or (XAU/USD) sur MetaTrader 5 Pour le trader sérieux: Abordez le trading d'Or avec une méthodologie structurée et axée sur les données, combinant plusieurs facteurs d'analyse de marché. Cet outil est conçu pour soutenir votre analyse du trading d'Or. Opportunité de Prix Limitée C'est une chance de posséder Gold Sniper Scalper Pro avant que le prix n'augmente.  Le prix du produit augmentera de $50 après chaque série de 10 achats subséquents. Prix Fi
Entry In The Zone and SMC Multi Timeframe est un outil d’analyse de marché en temps réel développé sur la base des Smart Money Concepts (SMC). Il est conçu pour aider les traders à analyser la structure du marché de manière systématique et à obtenir une vision plus claire de la direction globale du marché. Le système analyse automatiquement les Points de Retournement, les Zones Clés et la Market Structure sur plusieurs unités de temps, tout en affichant les Points of Interest (POI), les signaux
Atomic Analyst MT5
Issam Kassas
4.31 (26)
Tout d'abord, il convient de souligner que cet indicateur de trading n'est ni repainting, ni redrawing et ne présente aucun délai, ce qui le rend idéal à la fois pour le trading manuel et automatisé. Manuel de l'utilisateur : réglages, entrées et stratégie. L'Analyste Atomique est un indicateur d'action sur les prix PA qui utilise la force et le momentum du prix pour trouver un meilleur avantage sur le marché. Équipé de filtres avancés qui aident à éliminer les bruits et les faux signaux, et à
FX Power MT5 NG
Daniel Stein
5 (28)
FX Power : Analysez la force des devises pour des décisions de trading plus intelligentes Aperçu FX Power est l'outil essentiel pour comprendre la force réelle des principales devises et de l'or, quelles que soient les conditions du marché. En identifiant les devises fortes à acheter et les faibles à vendre, FX Power simplifie vos décisions de trading et révèle des opportunités à forte probabilité. Que vous suiviez les tendances ou anticipiez les retournements à l'aide de valeurs extrêmes de D
SynaptixQuant Dominance Matrix
Devie Arevalo Montemayor
5 (1)
SynaptixQuant Dominance Matrix: Institutional-Grade Market State Extraction Engineered for traders who require a data-driven view of market behaviour beyond surface-level indicators. The Synaptix Quant (SQ) Dominance Matrix is not a conventional currency strength display. Behind its intentionally streamlined interface runs a sophisticated analytical architecture designed to quantify market conditions with precision. Every output is generated through layered signal processing built to identify d
Grabber System MT5
Ihor Otkydach
4.79 (19)
Je vous présente un excellent indicateur technique : Grabber, qui fonctionne comme une stratégie de trading "tout-en-un", prête à l'emploi. En un seul code sont intégrés des outils puissants d'analyse technique du marché, des signaux de trading (flèches), des fonctions d'alerte et des notifications push. Chaque acheteur de cet indicateur reçoit également gratuitement : L'utilitaire Grabber : pour la gestion automatique des ordres ouverts Un guide vidéo étape par étape : pour apprendre à installe
Quantum TrendPulse
Bogdan Ion Puscasu
5 (19)
Présentation de   Quantum TrendPulse   , l'outil de trading ultime qui combine la puissance de   SuperTrend   ,   RSI   et   Stochastic   dans un seul indicateur complet pour maximiser votre potentiel de trading. Conçu pour les traders qui recherchent précision et efficacité, cet indicateur vous aide à identifier les tendances du marché, les changements de dynamique et les points d'entrée et de sortie optimaux en toute confiance. Caractéristiques principales : Intégration SuperTrend :   suivez f
Tout d'abord, il convient de souligner que cet outil de trading est un indicateur non repeint, non redessiné et non retardé, ce qui le rend idéal pour le trading professionnel. Cours en ligne, manuel utilisateur et démonstration. L'indicateur Smart Price Action Concepts est un outil très puissant à la fois pour les nouveaux et les traders expérimentés. Il regroupe plus de 20 indicateurs utiles en un seul, combinant des idées de trading avancées telles que l'analyse du trader Inner Circle et le
Trend indicator AI mt5
Ramil Minniakhmetov
5 (12)
L'indicateur Trend Ai est un excellent outil qui améliorera l'analyse du marché d'un trader en combinant l'identification des tendances avec des points d'entrée exploitables et des alertes d'inversion. Cet indicateur permet aux utilisateurs de naviguer dans les complexités du marché forex avec confiance et précision Au-delà des signaux primaires, l'indicateur Trend Ai identifie les points d'entrée secondaires qui surviennent lors des retraits ou des retracements, permettant aux traders de capit
FX Volume MT5
Daniel Stein
4.79 (24)
FX Volume : Découvrez le Sentiment du Marché tel que perçu par un Courtier Présentation Rapide Vous souhaitez faire passer votre approche de trading au niveau supérieur ? FX Volume vous fournit, en temps réel, des informations sur la manière dont les traders particuliers et les courtiers sont positionnés—bien avant la publication de rapports retardés comme le COT. Que vous visiez des gains réguliers ou recherchiez simplement un avantage plus solide sur les marchés, FX Volume vous aide à repére
TPSproTREND PrO MT5
Roman Podpora
4.72 (18)
Achetez TREND PRO maintenant et obtenez gratuitement un autre indicateur de tendance avancé Pour recevoir, écrivez en messages privés. VERSION MT4        —        ИНСТРУКЦИЯ RUS           —        INSTRUCTIONS  ENG Fonctions principales : Signaux d'entrée précis SANS RENDU ! Si un signal apparaît, il reste d’actualité ! Il s'agit d'une différence importante par rapport aux indicateurs de redessinage, qui peuvent fournir un signal puis le modifier, ce qui peut entraîner une perte de fonds en d
Top indicator for MT5   providing accurate signals to enter a trade without repainting! It can be applied to any financial assets:   forex, cryptocurrencies, metals, stocks, indices .  Watch  the video  (6:22) with an example of processing only one signal that paid off the indicator! MT4 version is here It will provide pretty accurate trading signals and tell you when it's best to open a trade and close it. Most traders improve their trading results during the first trading week with the help of
Combien de fois avez-vous acheté un indicateur de trading avec d' excellents backtests, des preuves de performance sur compte réel avec des chiffres fantastiques et des statistiques partout , mais après l'avoir utilisé, vous finissez par faire sauter votre compte ? Vous ne devriez pas faire confiance à un signal seul, vous devez savoir pourquoi il est apparu en premier lieu, et c'est ce que RelicusRoad Pro fait de mieux ! Manuel d'utilisation + Stratégies + Vidéos de formation + Groupe privé ave
TrendLine PRO MT5
Evgenii Aksenov
4.67 (33)
L'indicateur   Trend Line PRO   est une stratégie de trading indépendante. Il montre le changement de tendance, le point d'entrée de la transaction, ainsi que le calcul automatique de trois niveaux de protection Take Profit et Stop Loss. Trend Line PRO   est parfait pour tous les symboles Meta Trader : devises, métaux, crypto-monnaies, actions et indices. L'indicateur est utilisé dans le trading sur des comptes réels, ce qui confirme la fiabilité de la stratégie. Pour le moment, l'indicateur
Market Structure Patterns
Samuel Manoel De Souza
4.47 (19)
Disponible pour   MT4   et   MT5 . Rejoignez le canal Market Structure Patterns pour télécharger des documents d'étude et/ou des informations supplémentaires. Articles connexes : Market Structure Patterns - Introduction Market Structure Patterns   est un indicateur basé sur les   Smart Money Concepts   qui affiche les   éléments SMC/ICT   pouvant améliorer vos décisions de trading. Profitez des   alertes ,   notifications push   et   emails   pour être informé lorsqu’un élément se forme sur le
Atbot
Zaha Feiz
4.62 (55)
AtBot : Comment ça fonctionne et comment l'utiliser ### Comment ça fonctionne L'indicateur "AtBot" pour la plateforme MT5 génère des signaux d'achat et de vente en utilisant une combinaison d'outils d'analyse technique. Il intègre la Moyenne Mobile Simple (SMA), la Moyenne Mobile Exponentielle (EMA) et l'indice de la Plage Vraie Moyenne (ATR) pour identifier les opportunités de trading. De plus, il peut utiliser des bougies Heikin Ashi pour améliorer la précision des signaux. Laissez un avis ap
Quantum Trend Sniper
Bogdan Ion Puscasu
4.74 (53)
Présentation       Quantum Trend Sniper Indicator   , l'indicateur révolutionnaire MQL5 qui transforme la façon dont vous identifiez et négociez les inversions de tendance ! Développé par une équipe de traders expérimentés avec une expérience commerciale de plus de 13 ans,       Indicateur Quantum Trend Sniper       est conçu pour propulser votre parcours de trading vers de nouveaux sommets grâce à sa manière innovante d'identifier les inversions de tendance avec une précision extrêmement élevée
L'indicateur identifie quand une divergence se produit entre le prix et un oscillateur/indicateur. Il identifie à la fois les divergences régulières et cachées. Il dispose d'une option de filtre RSI qui permet de filtrer uniquement les configurations les plus puissantes. L'indicateur offre également des options pour attendre une formation engloutissante, une cassure du canal Donchian ou que le prix croise une moyenne mobile   (voir capture d'écran #3)       pour confirmer la divergence avant de
Trend Forecaster
Alexey Minkov
5 (7)
The Trend Forecaster indicator utilizes a unique proprietary algorithm to determine entry points for a breakout trading strategy. The indicator identifies price clusters, analyzes price movement near levels, and provides a signal when the price breaks through a level. The Trend Forecaster indicator is suitable for all financial assets, including currencies (Forex), metals, stocks, indices, and cryptocurrencies. You can also adjust the indicator to work on any time frames, although it is recommen
ARIScalping
Temirlan Kdyrkhan
ARIScalp is a powerful trading companion designed to generate high-probability entry signals with dynamic TP/SL/DP levels based on volatility. Built-in performance tracking shows win/loss stats, PP1/PP2 hits, and success rates all updated live. Key Features: Buy/Sell signals with adaptive volatility bands Real-time TP/SL/DP levels based on ATR Built-in MA Filter with optional ATR/StdDev volatility Performance stats panel (Success, Profit/Loss, PP1/PP2) Alerts via popup, sound, push, or email Cus
Opening Range Breakouts MT5
Thushara Dissanayake
4.5 (4)
L'   indicateur Opening Range Breakouts   est un outil de trading basé sur les sessions, conçu pour les traders qui suivent les concepts de trading institutionnel, tels que   l'ICT (Inner Circle Trader), le Smart Money Concepts (SMC)   et les stratégies basées sur   le volume   ou   le flux d'ordres   . Cet indicateur trace les principaux intervalles d'ouverture de session, permettant aux traders d'identifier les potentiels   mouvements de liquidité, les zones de cassure, les fake outs   et   le
La meilleure solution pour tout débutant ou trader expert ! Cet indicateur est un outil de trading unique, de haute qualité et abordable car nous avons incorporé un certain nombre de caractéristiques exclusives et une nouvelle formule. Avec seulement UN graphique, vous pouvez lire la force de la devise pour 28 paires Forex ! Imaginez comment votre trading va s'améliorer parce que vous êtes capable de repérer le point de déclenchement exact d'une nouvelle tendance ou d'une opportunité de scalpi
Was: $249  Now: $99   Market Profile defines a number of day types that can help the trader to determine market behaviour. A key feature is the Value Area, representing the range of price action where 70% of trading took place. Understanding the Value Area can give traders valuable insight into market direction and establish the higher odds trade. It is an excellent addition to any system you may be using. Inspired by Jim Dalton’s book “Mind Over Markets”, this indicator is designed to suit the
Blahtech Supply Demand MT5
Blahtech Limited
4.54 (13)
Was: $299  Now: $99  Supply Demand uses previous price action to identify potential imbalances between buyers and sellers. The key is to identify the better odds zones, not just the untouched ones. Blahtech Supply Demand indicator delivers functionality previously unavailable on any trading platform. This 4-in-1 indicator not only highlights the higher probability zones using a multi-criteria strength engine, but also combines it with multi-timeframe trend analysis, previously confirmed swings a
Shock Pullback
Suleiman Alhawamdah
5 (1)
Tout simplement, vous pouvez commencer à trader lorsque le mouvement des chiffres blancs — appelés « pips » — commence à apparaître à côté de la bougie actuelle. Les « pips » blancs indiquent qu’un ordre d’achat ou de vente est actuellement actif et évolue dans la bonne direction, comme le montre leur couleur blanche. Lorsque le mouvement des pips blancs s’arrête et devient vert statique, cela signale la fin de la dynamique en cours. La couleur verte des chiffres représente le profit total réal
Super Signals Channel Indicator Its channel is a non-repaint indicator that reacts more with recent price movements. For this reason, the Super Signals Channel Indicator is a better match for short-term or day trading strategy. The Super Signals Channel only plots swing trading opportunities. So most of its trade signals appear during consolidation or sidelined periods of the market. Super Signals Channel Indicator for MT5 Explanation The green band below the price shows the dynamic support lev
Volume Profile Pro Signals  Analyse précise du volume et génération automatique de signaux. Ce que fait l’outil Volume Profile Pro Signals construit une représentation en direct, fondée sur les données, des zones où le volume de trading se concentre réellement — révélant les zones où le prix est accepté ou rejeté. Il met en évidence POC, VAH, VAL et identifie avec précision les zones HVN/LVN. À partir de ces informations il génère des signaux de breakout en temps réel (VAH/VAL) et trace des ni
MACD Intraday Trend PRO est un indicateur développé grâce à une adaptation du MACD original créé par Gerald Appel dans les années 1960. Au fil des années de négociation, il a été observé qu'en modifiant les paramètres du MACD avec les proportions de Fibonacci, nous obtenons une meilleure présentation de la continuité des mouvements de tendance, ce qui permet de détecter plus efficacement le début et la fin d'une tendance de prix. En raison de son efficacité à détecter les tendances de prix, i
Plus de l'auteur
This indicator is based on a classic  DeMarker indicator. Multi TimeFrame indicator MTF-DeMarker shows data from the 4 timeframes by your choice. By default this indicator has external parameters: TF1 = 1; TimeFrame2b = true; TF2 = 5; TimeFrame3b = true; TF3 = 15; TimeFrame4b = true; TF4 = 60; InpPeriod = 14; You can change TF1-TF4 in the next limits: TF1 from M1 (1) to H4 (240) TF2 from M5 (5) to D1 (1440) TF3 from M15 (15) to W1 (10080) TF4 from M30 (30) to MN1 (43200) All chosen TFs should be
This is a self-explanatory indicator - do nothing when the current price in the "fence" (flat) mode. Definition of a flat market: A market price that is neither Up nor Down. The input parameter  counted_bars  determines on how many bars the indicator's lines will be visible starting from the current Bar backward. The input parameter  barsNum  is used as a Period for aqua "fence" calculation.
This Multi TimeFrame indicator is based on the "Fractals" classical indicator. 2 Inputs: TimeFrame1; TimeFrame2; You can put any available TimeFrame values (from M1 (Period_M1) to MN1 (Period_MN1)) equal or greater ( >= ) than the Period of the current Time Frame. The last Fractals will shown as color lines (Dots Line) of Support and Resistance for the Price moving.
This is a Multi-Time indicator which allows to display RSI and Stochastic indicators from upper timeframes on a single chart. As an example: a single chart EURUSD M5 and RSI (blue line) and Stochastic (yellow line) from H1. Red Histogram is representing Lower trend and Green Histogram is representing Upper trend.
When you put this Multi TimeFrame Parabolic SAR indicator on the chart it will automatically use Parabolic SAR from next available 3 timeframes. Green arrow will show the beginning of Up trend and Red arrow will show the beginning of Down trend. If AlertsEnabled = true, the indicator will show the Alert (message window) with a text like this: "Price going Down on ", Symbol(), " - ", Period(), " min", " price = ", Bid; If eMailEnabled = true the Indicator will send you an eMail with the same text
The zero line is characterized the Flat trend. V-shaped impulse indicates the entrance to the opposite direction. U-shaped impulse = entry orders in the same direction. If AlertsEnabled = true, the indicator will show the Alert (message window) with a text like this: "Price going Down on ", Symbol(), " - ", Period(), " min", " price = ", Bid; If eMailEnabled = true the indicator will send you an eMail with the same text an Alert message with subject: "Trinity-Impolse" (of course you have to chec
The indicator displays the usual Moving Average with input parameters: maPeriod_1; maMethod_1; maAppPrice_1. Then it calculates and displays MA on MA1 with input parameters: maPeriod_2; maMethod_2. Then it calculates and displays MA on MA2 with input parameters: maPeriod_3; maMethod_3. If AlertsEnabled = true the Indicator will show the Alert (message window) with a text like this: "Price going Down on ", Symbol(), " - ", Period(), " min", " price = ", Bid; If eMailEnabled = true the Indicator w
Multi TimeFrame Indicator "MTF CCI Trigger" based on the Commodity Channel Index from the upper TF (input parameter "TimeFrame") yellow line. Aqua line is representing ATR envelopes from the current TF. Green and Red arrows is triggered by CCI and represented UP and DOWN trends accordingly.
The BBImpulse indicator is based on the standard Moving Average indicator. You have MA input parameters: maPeriod - Moving Average period; maMODE - Moving Average mode (0 = MODE_SMA; 1 = MODE_EMA; 2 = MODE_SMMA; 3 = MODE_LWMA); maPRICE - Applied price (0=PRICE_CLOSE; 1=PRICE_OPEN; 2=PRICE_HIGH; 3=PRICE_LOW; 4=PRICE_MEDIAN; 5=PRICE_TYPICAL; 6=PRICE_WEIGHTED). Green Histogram is representing an UP-trend, Red Histogram is representing a Down-trend.
Multi TimeFrame indicator MTF ADX with Histogram shows ADX indicator data from the TF by your choice. You may choose a TimeFrame equal or greater than current TF. Yellow line is representing a price trend from the upper TF. Green line is representing +DI from the upper TF. Red line is representing -DI from the upper TF. Green histogram is displaying an Up-trend. Red histogram is displaying a Down-trend.
This Indicator creates 2 white lines based on Exponential Moving Averag e of High and Low prices. You can regulate how many bars will be involved in the calculation with input parameter HL_Period. Red and Blue arrows are displaying the moment to go Short and Long trades accordingly.
The most common way to interpreting the price Moving Average is to compare its dynamics to the price action. When the instrument price rises above its Moving Average, a buy signal appears, if the price falls below its moving average, what we have is a sell signal. To avoid a spontaneous entries one may use this update from Moving Average Indicator = Stepper-MA.
Envelopes technical Indicator is formed with two Moving Averages one of which is shifted upward and another one is shifted downward. Envelopes define the upper and the lower margins of the price range. Signal to sell appears when the price reaches the upper margin of the band; signal to buy appears when the price reaches the lower margin. To avoid a spontaneous entries one may use this update from Envelopes Indicator = Envelopes-Stepper.
The interpretation of the Bollinger Bands is based on the fact that the prices tend to remain in between the top and the bottom line of the bands. Abrupt changes in prices tend to happen after the band has contracted due to decrease of volatility; If prices break through the upper band, a continuation of the current trend is to be expected; If the pikes and hollows outside the band are followed by pikes and hollows inside the band, a reverse of trend may occur; The price movement that has starte
Fibonacci sequence is defined by integer sequence: 0, 1, 1, 2, 3, 5, 8, 13, 34, 55, 89, 144, ... By definition, it starts from 0 and 1, the next number is calculated as a sum of two previous numbers. Instead of the standard moving average, the indicator uses the caluclation of average price in form: Bar0 + Bar1 + Bar2 + Bar3 + Bar5 + Bar8 + Bar13 +... Input parameters:  FiboNumPeriod (15) - Fibonacci period; nAppliedPrice (0) - applied price (PRICE_CLOSE=0; PRICE_OPEN=1; PRICE_HIGH=2; PRICE_LOW=
This indicator present a main Moving Average line with input parameters maPeriod_1, maMethod_1 and maAppPrice_1. The second line will be a calculation of the Moving Average data of a first line with input parameters maPeriod_2, maMethod_2. The third line will be a calculation of the Moving Average data of a second line with input parameters maPeriod_3, maMethod_3. To avoid a spontaneous entries one may use this indicator-stepper.
This indicator (as almost all others) is based on classical Moving Averages. It shows the Average Bar under the current bar colored in aqua or over the current bar colored in orange. Input Parameters: ma_Period and ma_Method. The Average Bar maybe helpful to predict where the price will move in the nearest future. Of course, this "near future" depends of the current time frame.
Buy when the market is falling and sell when the market is rising. When the market is moving down you start observing and looking for buy signals. When the market is moving up you start looking for sell signals. This indicator points to the moments to Buy (Blue arrow) and to Sell (Orange arrow). Two input parameters: barsNumber and step for optimization (depending on symbol and Time Frame).
This indicator shows: A green light in case the price goes up; A red light in case the price goes down; A yellow light in case there are a sideways trend. A sideways trend is the horizontal price movement that occurs when the forces of supply and demand are nearly equal. This typically occurs during a period of consolidation before the price continues a prior trend or reverses into a new trend
This indicator is created for M1 timeframe. It shows how many ticks has occurred during current minute and ( after the slash) the sum of points Up (aqua color) and Down (orange color). In times of a high trading activity a grow up number of ticks Up and Down will signal of a big move of the price in the near future. In times of a high trading activity a grow up number of sum of points Up and Down will signal of a big move of the price in the near future too.
Two yellow lines. This is similar to classical Envelopes but with automatic deviation. The Envelopes indicator is   a tool that attempts to identify the upper and lower bands of a trading range. Aqua line. This is a classical Commodity Channel Index added to the Envelopes on the chart, not in a separate window. The Commodity Channel Index ( CCI ) is a technical   indicator   that measures the difference between the current price and the historical average price.
Probability deals with the likelihood of an event happening.   Forex   probability indicates a possibility at a specific time. This is because the forex market is highly volatile, and predicting future events affecting it is impossible. This indicator will show a positive number above the current High or negative number under the current Low as a probability of the trend. Higher time frames usually show a higher probability, even more then 100%.
Envelopes is an excellent indicator when the market is trending. Open Long position when the ClosePrice crossed the upper Aqua band. Close Long position when the Price crossed the upper Yellow band moving down. Open Short position when the ClosePrice crossed the lower Aqua band. Close Short position when the Price crossed the lower Yellow band moving up.
Moving Average Bars is a self-explanatory indicator with one input parameter: nPeriod. When the previous Price Close is above the previous indicator Bar, the probability to go Long is very high.   When the previous Price Close is under the previous indicator Bar, the probability to go Short is very high.
This indicator is based on the same idea as https://www.mql5.com/en/market/product/2406 , but instead of Average Bars it uses series or Fibonacci sequence. When the previous Price Close is above the previous indicator Bar, the probability to go Long is very high. When the previous Price Close is under the previous indicator Bar, the probability to go Short is very high.
This indicator is based on two ideas: Correlations between 5 main currency pairs: EURUSD, GBPUSD, USDCHF, USDJPY, USDCAD; US Dollar Index = the value of the United States dollar relative to a basket of foreign currencies. The use of the indicator is the same as classical  Commodity Channel Index  (CCI) indicator. CCI is calculated with the following formula:  (Typical Price - Simple Moving Average) / (0.015 x Mean Deviation) (Typical Price - Simple Moving Average) / (0.015 x Mean Deviation)
A  tick  is a measure of the minimum upward or downward movement in the  price  of a security. A  tick  can also refer to the change in the  price  of a security from one trade to the next trade.  This indicator will show amounts of ticks when the price goes up and down. This indicator is designed for M1 time frame and shows: Sum of points when the price goes up (Green Histogram). Sum of points when the price goes down (Red Histogram). 
This indicator is a combination of 2 classical indicators MA and RVI. The Relative Vigor Index (RVI) is a momentum indicator used in technical analysis that measures the strength of a trend by comparing a security's closing price to its trading range while smoothing the results using a simple moving average   The input parameter  counted_bars  determines how many bars the indicator's lines will be visible. The input parameter MaRviPeriod  is used for MA and RVI calculation.
This indicator is a combination of 2 classical indicators: MA and Force Index. The input parameter  counted_bars  determines on how many bars the indicator lines will be visible. The input parameter  MaForcePeriod  is used for MA and Force calculation. You may go Long if the current price crossed Up the Ribbon (HISTOGRAM)  and you may go Short if the current price crossed Down the Ribbon (HISTOGRAM)
This indicator is a combination of 2 classical indicators: MA and CCI. Two moving averages form Upper and Lower bands. The input parameter  counted_bars  determines on how many bars the indicator's lines will be visible. The input parameter  barsNum  is used for MA and CCI calculation.
Filtrer:
Aucun avis
Répondre à l'avis