Themis SMC
- Indicateurs
- Version: 1.0
- Activations: 5

Introducing Themis SMC, a Smart Money Concepts indicator that puts market structure, order blocks, liquidity, fair value gaps, premium and discount zones and rule-based entry signals on one clean chart overlay.
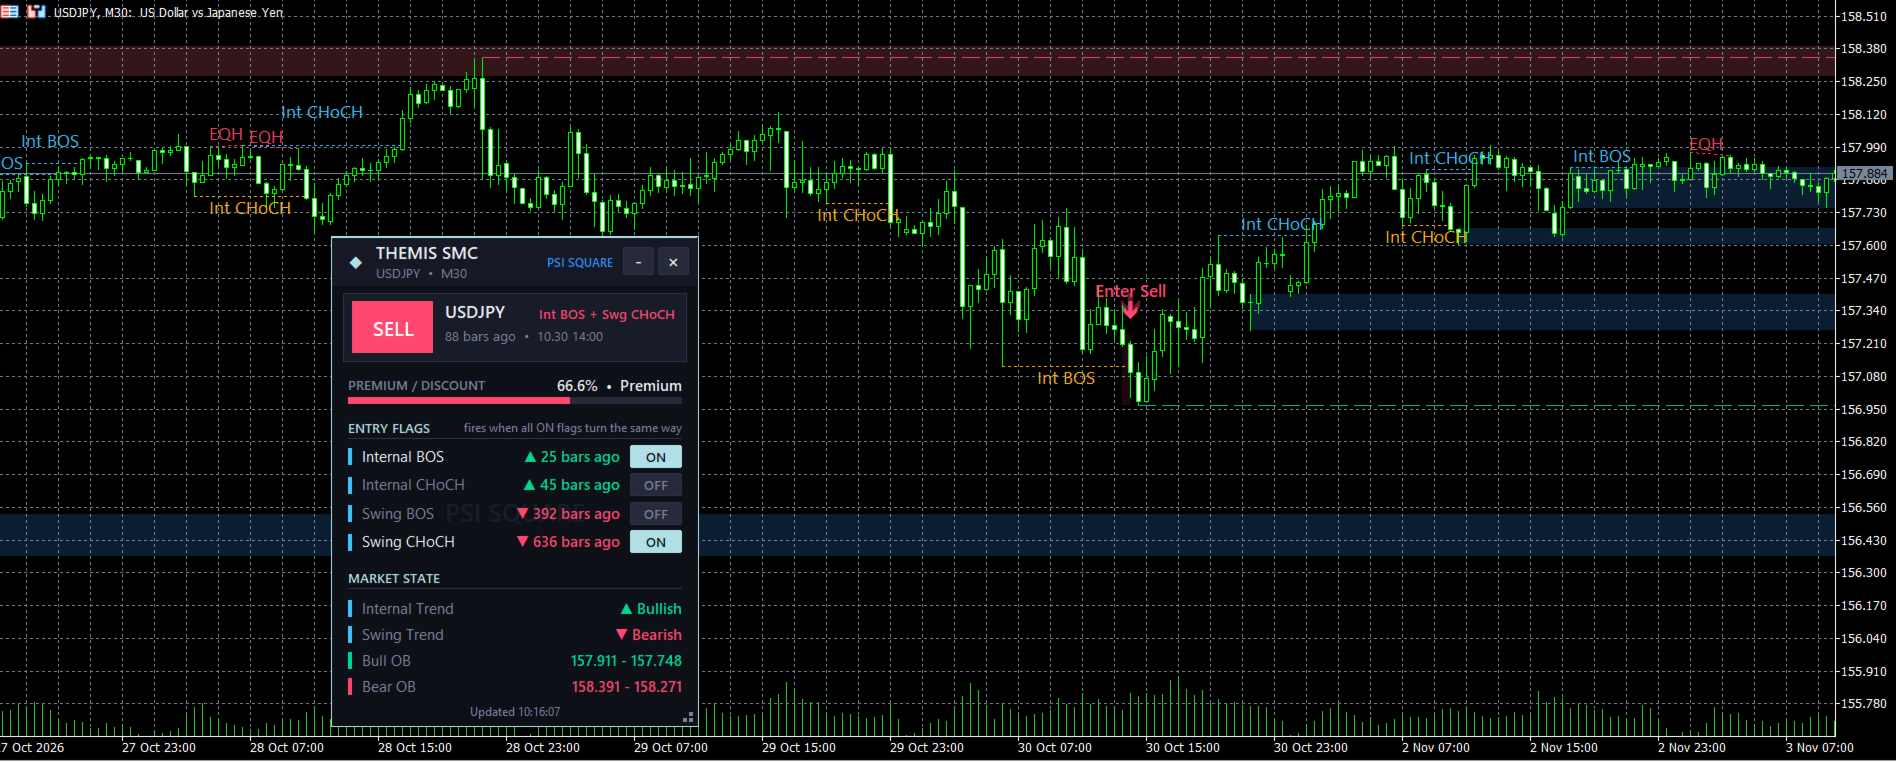
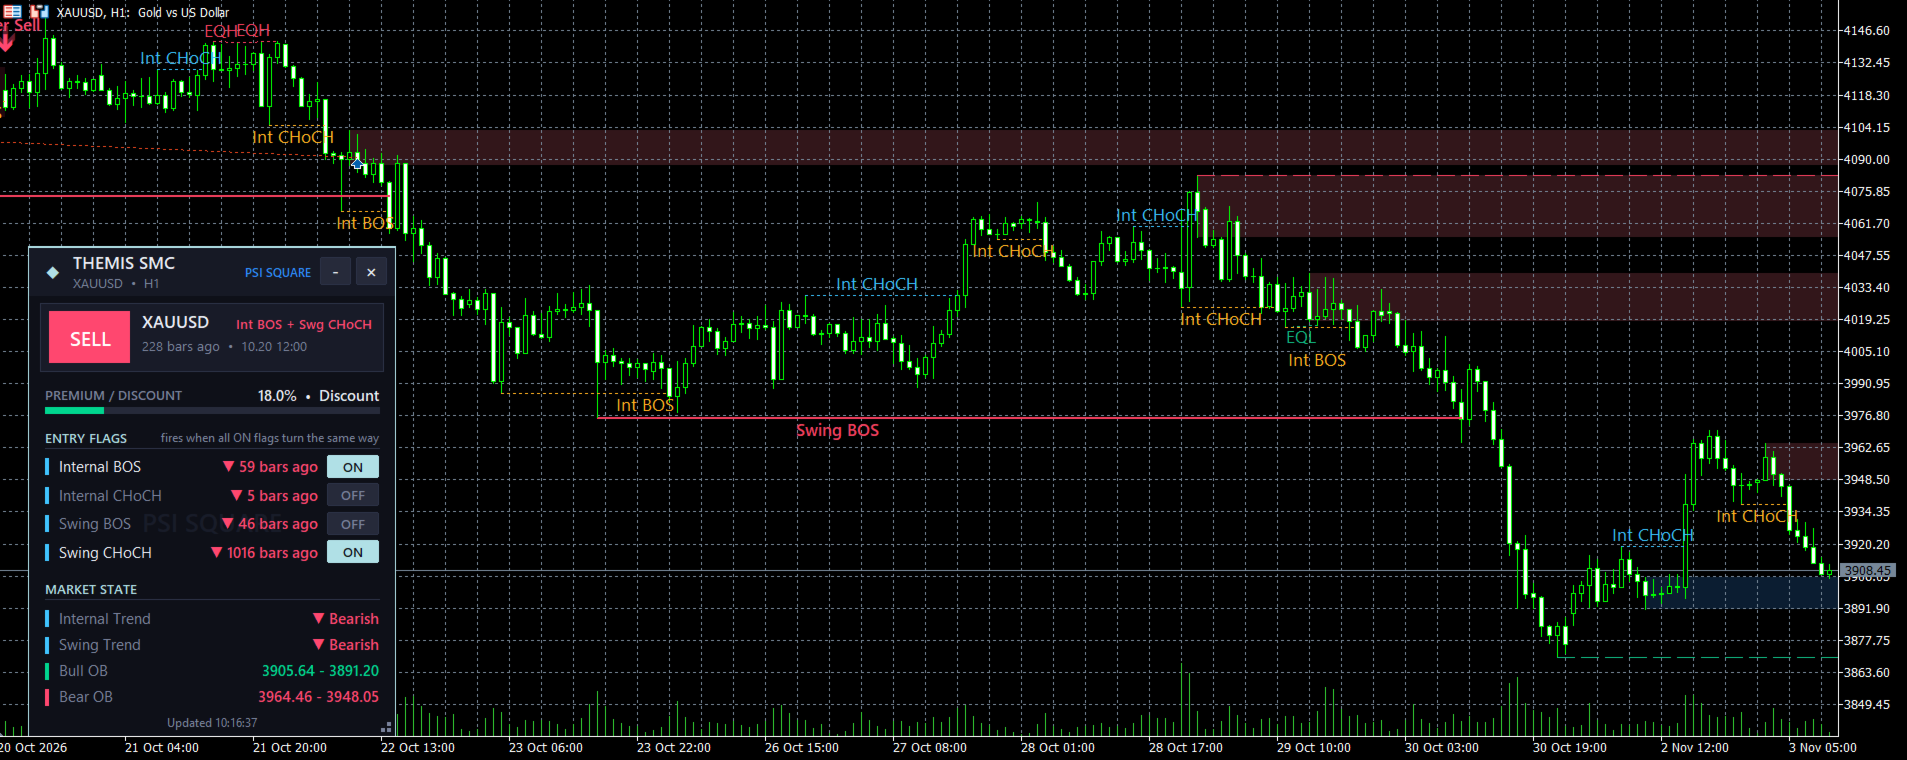
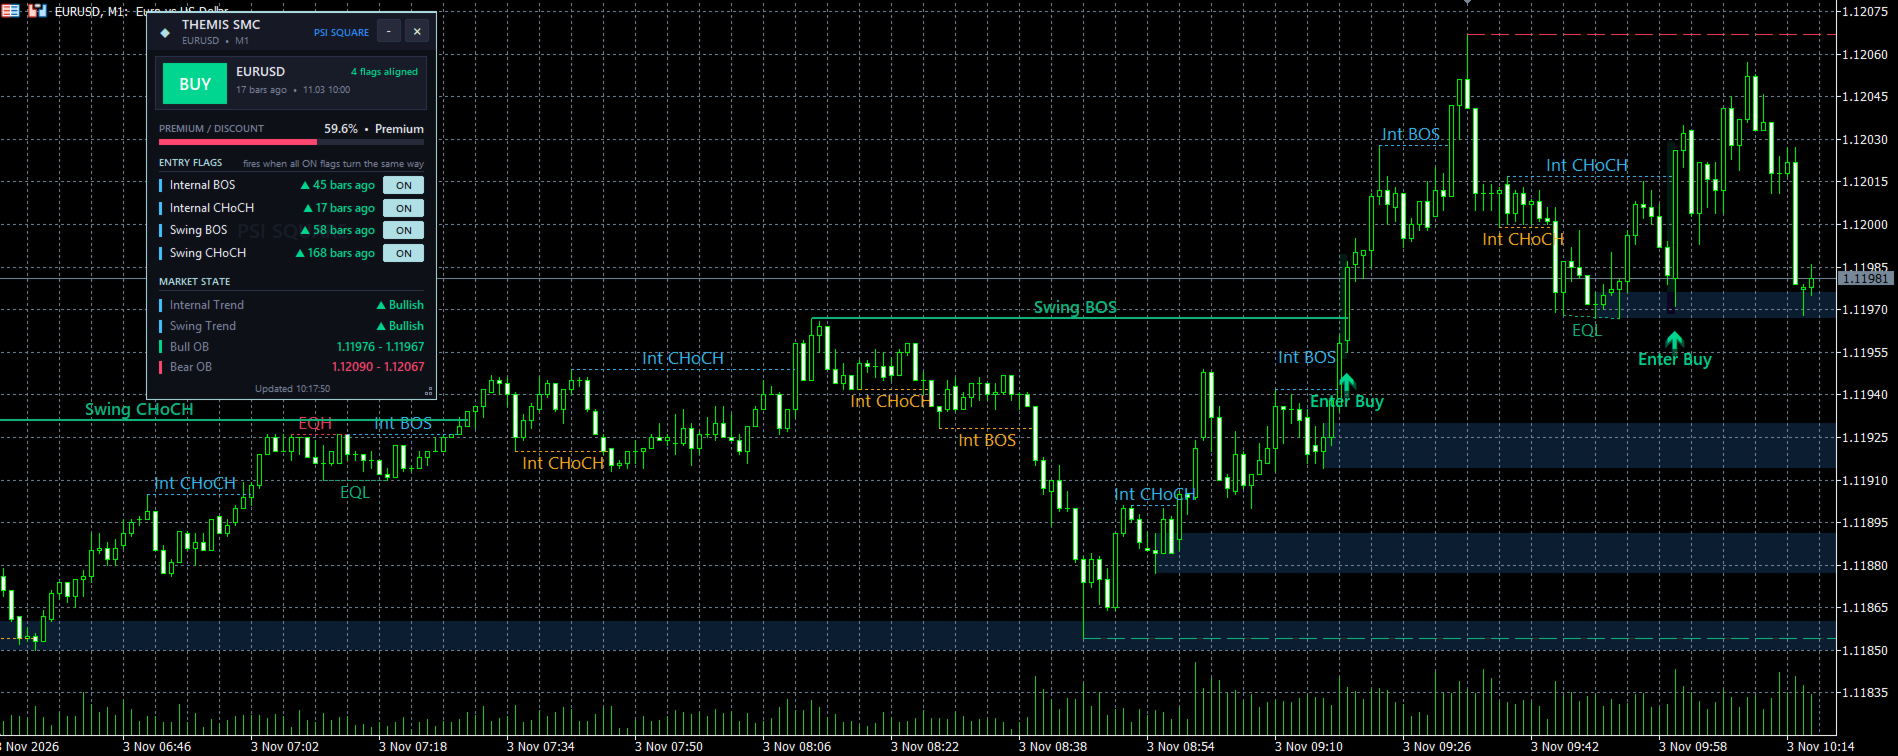
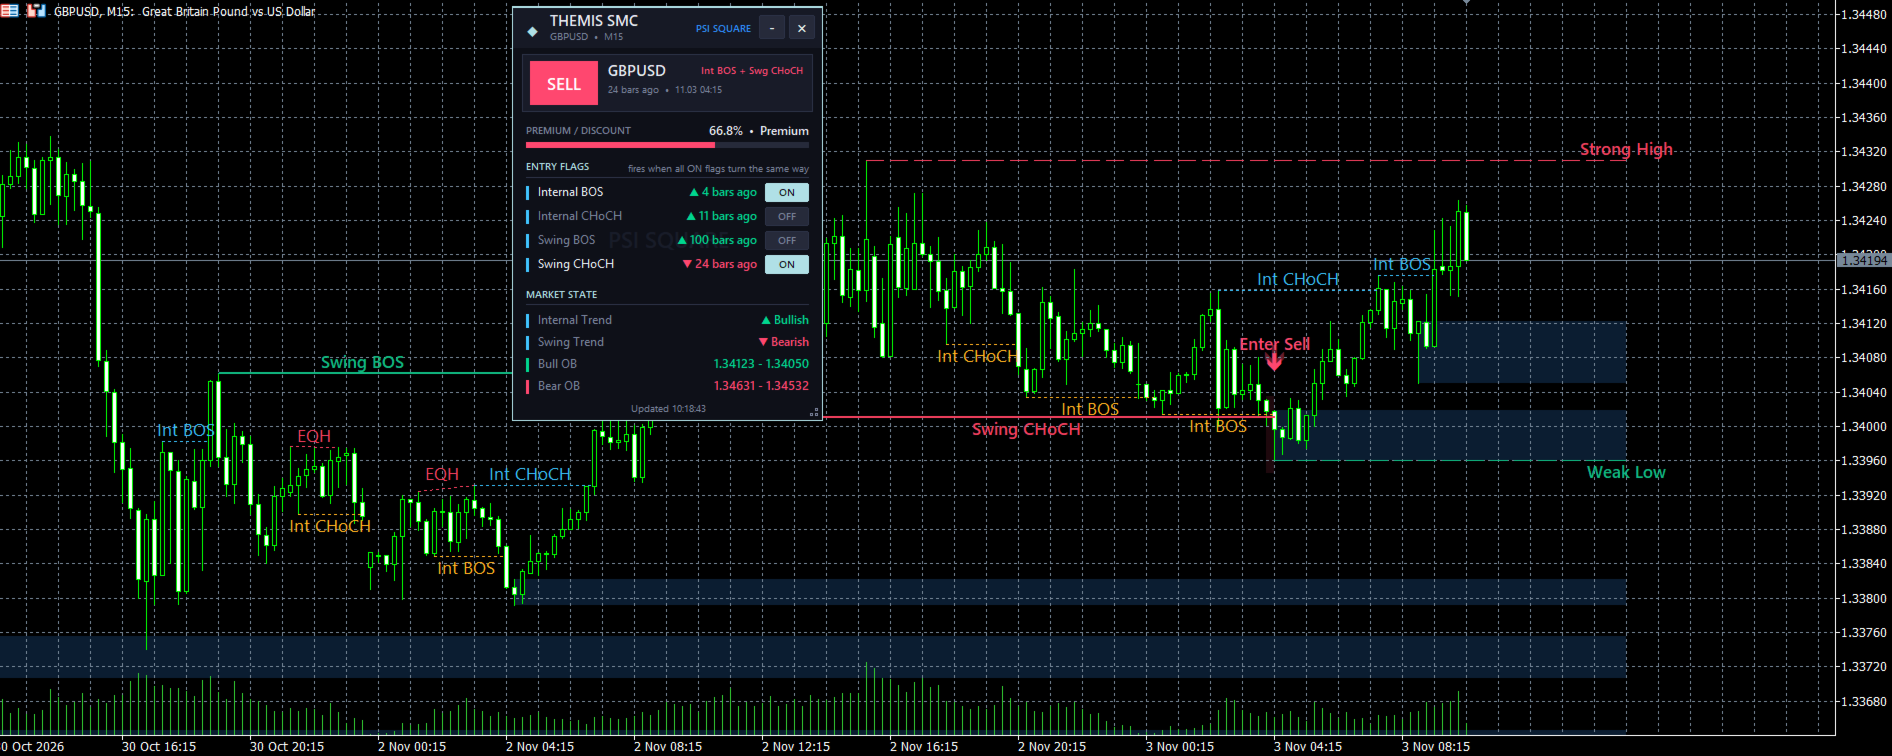
Themis reads the market in layers. Internal and swing structure show every Break of Structure (BOS) and Change of Character (CHoCH). Order blocks mark the zones where price is likely to react. Equal highs and lows show resting liquidity. Fair value gaps show imbalance. The premium and discount range shows whether price is expensive or cheap. You choose which structure events count as an entry, and when they all point the same way, Themis marks the bar with an arrow and an Enter Buy / Enter Sell label. You see structure, zones and entry timing in one glance.
Key Features:
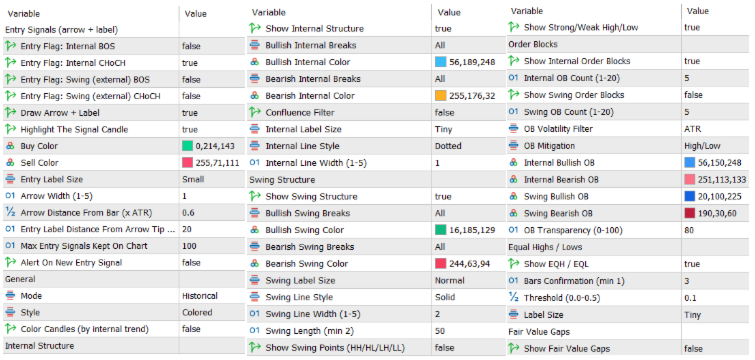
- Rule-Based Entry Signals: Four entry flags (Internal BOS, Internal CHoCH, Swing BOS, Swing CHoCH) can each be switched on or off. When more than one flag is on, the signal fires on the bar where the last flag turns the same direction as all the others, no matter how many bars ago the others happened. With one flag, it fires on every event of that flag. Each signal gets an arrow with a soft glow, an Enter Buy / Enter Sell label and an optional candle highlight. An optional alert can fire when a new entry signal appears.
- Internal and Swing Structure: Both levels of structure are drawn with BOS and CHoCH lines and labels, in different colors, line styles and widths so you can tell them apart. Filter bullish and bearish breaks separately (all, BOS only or CHoCH only). An optional confluence filter is available for internal breaks. Swing length is adjustable.
- Order Blocks: Internal and swing order blocks with an adjustable count. Choose the volatility filter (ATR or cumulative mean range) and the mitigation method (close or high/low). Colors and transparency are adjustable.
- Equal Highs and Lows: EQH and EQL levels with adjustable confirmation bars and threshold.
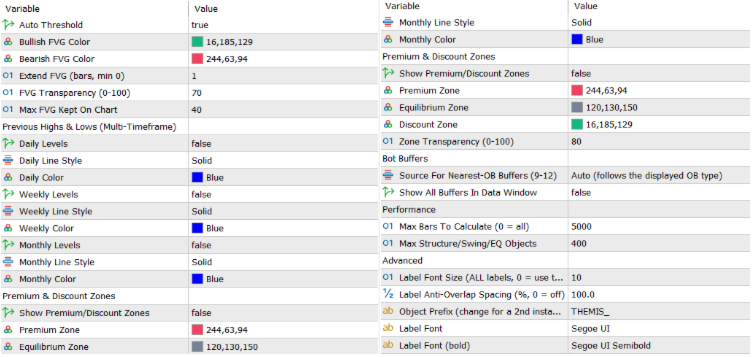
- Fair Value Gaps: Bullish and bearish gaps with an automatic threshold, an adjustable extension and a cap on how many are kept on the chart.
- Strong/Weak High and Low and Swing Points: Trailing Strong/Weak High and Low levels, plus optional HH / HL / LH / LL swing point labels.
- Premium, Discount and Equilibrium Zones: Shaded zones inside the current swing range, so you can see at once whether price is in premium or discount.
- Previous Highs and Lows: Previous daily, weekly and monthly highs and lows drawn as lines, each with its own style and color.
- Labels That Stay Out of the Way: All labels use one font size, are spaced so they do not overlap each other or the entry arrows, and are re-spaced when you zoom. The Enter Buy / Enter Sell label sits right next to its arrow, and its distance is adjustable.
- Live Dashboard Panel: Shows the latest entry signal with how many bars ago it appeared, its time and its source, the position of price inside the premium/discount range, and the nearest bull and bear order blocks. It also shows internal and swing trend, and the last event of each of the four entry flags with its direction and age. The four flags are ON/OFF buttons right on the panel, and clicking one re-checks all the history on your chart instantly. The panel scales automatically to your screen size and can be dragged, resized and minimized to a small crystal. It keeps its position and your flag choices when you change timeframe, and it always stays above the chart drawings.
- Customizable Display: Show or hide each module individually. Choose colored or monochrome style, historical or present-only mode, and optional candle coloring by internal trend. Control how many bars are calculated and how many objects are kept on the chart, so the indicator stays fast.
- Works on any symbol and timeframe: Forex, gold, indices and crypto, from scalping to swing trading.
Whether you're a beginner who wants clear entry marks or an experienced trader who wants a full structure, liquidity and zone map to build your own strategy on, Themis SMC helps you trade with structure instead of a guess.
Specifications:
- Entry signals come from your chosen BOS/CHoCH flags, with arrows and labels on the chart
- Structure and signals are calculated on closed bars only. A signal never appears or disappears after its bar has closed. Swing points are confirmed after the swing length, as in the original concept.
- Buffers for EAs: internal and swing trend, break events and levels, nearest and newly created order blocks, fair value gaps, equal high/low events, premium/discount position, ATR, and the entry signal (+1 buy, −1 sell) with its price
- Trading involves risk. Always test on a demo account first.
Contact
If you have any questions or need help, contact me via Private Message.