Nova Exhaustion
- Indicateurs
- Version: 1.0
- Activations: 5

Introducing Nova Exhaustion, a trend exhaustion indicator that finds the bar where a move runs out of steam. It combines a 9-count setup, a filled SuperTrend and automatic support and resistance levels, all on one clean chart overlay.
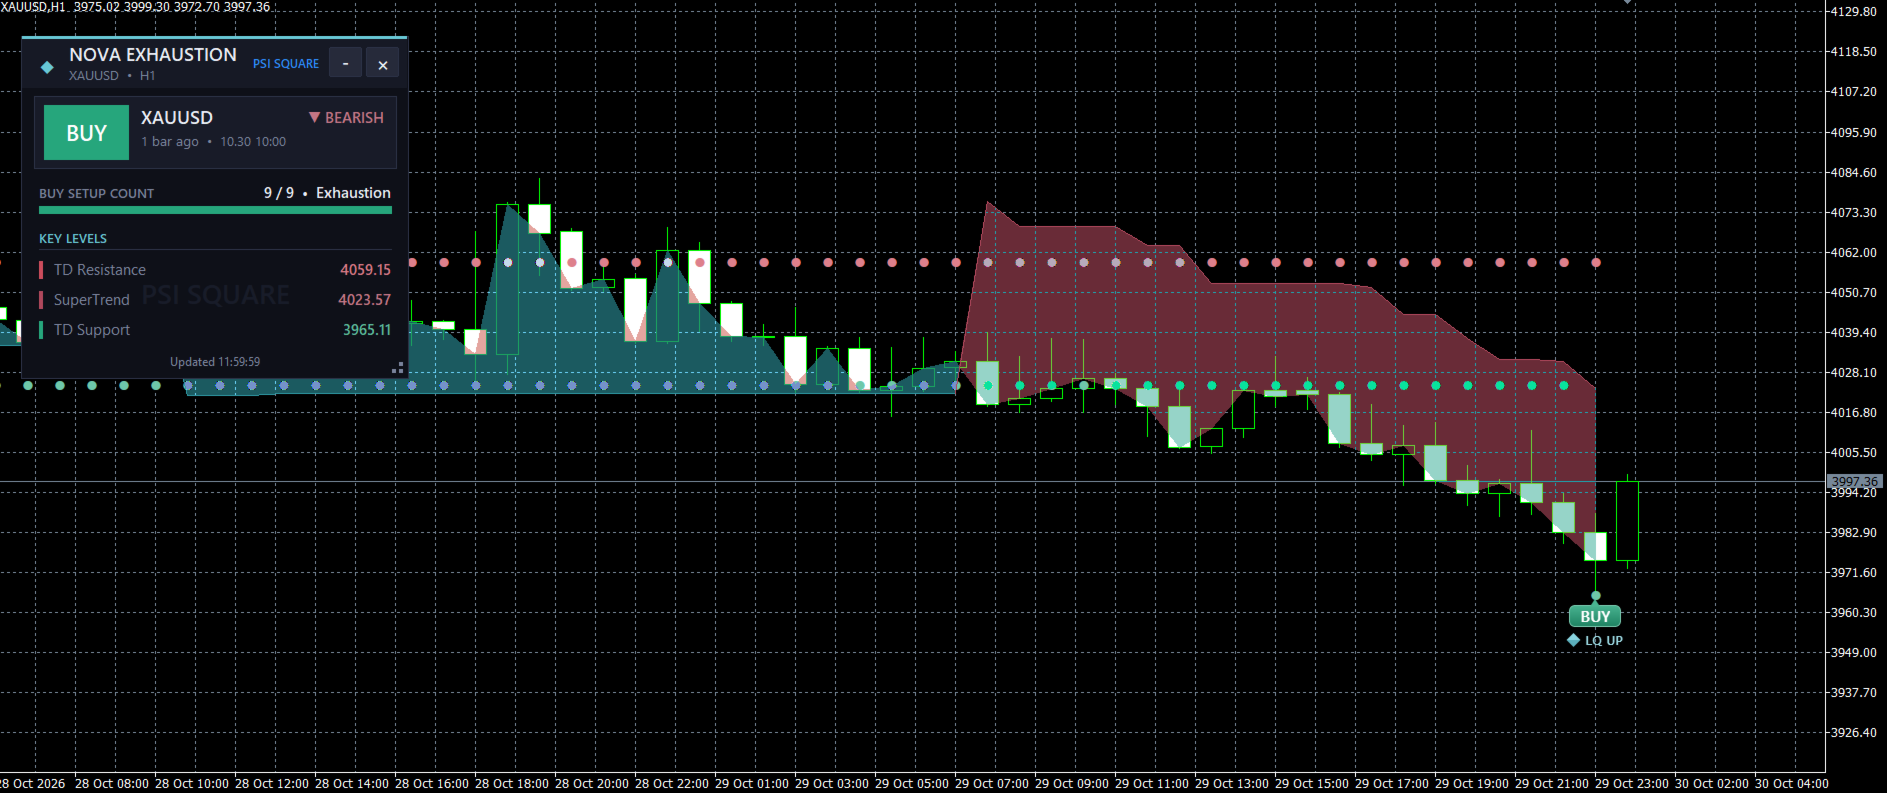
Nova Exhaustion counts consecutive closes against the close four bars earlier. Nine closes in a row below it mark selling exhaustion and a BUY. Nine closes in a row above it mark buying exhaustion and a SELL. The counts at 7 and 8 warn you early that a 9 is close. The SuperTrend shows the trend direction and the TD levels show where the last exhaustion happened, so you see the setup, the trend and the key levels in one glance.
Key Features:
- 9-Count Exhaustion Signals: A BUY or SELL callout box appears on the bar where the count reaches 9, with a pointer to the candle. In the default mode each box carries an LQ UP / LQ DOWN crystal tag. The count only runs on closed bars, so a signal never appears or disappears after the bar has closed.
- Early Warning at 7 and 8: Small markers on counts 7 and 8 (Buy 7, Sell 7, Buy 8, Sell 8) show when exhaustion is building. The 8 bar also gets a Buy++ / Sell++ marker, so you can get ready before the 9 prints.
- Two Display Modes: With SuperTrend on, you get the crystal callouts and the filled trend line. With it off, you get classic arrow and dot markers (choose the shape for each: hand arrow, arrow, circle, dot, cross, diamond, square, X), with BUY ++ / SELL ++ pills and an adjustable marker size.
- SuperTrend with Fill: An ATR-based SuperTrend with adjustable period and multiplier, a colored line for bullish and bearish and a shaded fill between the line and price. Fill brightness and colors are adjustable.
- TD Support and Resistance: The low of the latest completed Buy 9 and the high of the latest completed Sell 9 are drawn as trailing levels, with your choice of shape and color. They show where the last exhaustion happened and where price may react.
- Live Dashboard Panel: Shows the latest signal (BUY, SELL or WAIT) with its symbol, how many bars ago it appeared and its time. It also shows the SuperTrend direction, the current setup count from 0 to 9 on a progress bar with its zone (Building, Near exhaustion, Exhaustion, Extended), and the key levels: TD Resistance, SuperTrend and TD Support.
- Fully Customizable Colors: Box colors, crystal colors, TD line colors, SuperTrend colors and every marker color can be changed, so the indicator fits any chart theme.
- Works on any symbol and timeframe: Forex, gold, indices and crypto, from scalping to swing trading.
Whether you're a beginner who wants clear BUY and SELL marks or an experienced trader who wants exhaustion counts, trend and key levels on one chart, Nova Exhaustion helps you spot where moves are running out of steam instead of guessing.
Specifications:
- Signals come from 9 consecutive closes above (SELL) or below (BUY) the close four bars earlier
- Calculated on closed bars only, with no repainting. The forming bar is never evaluated
- Buffers for EAs: Buy, Sell, Buy 7, Sell 7, Buy 8, Sell 8, LQ Up, LQ Down, Buy++, Sell++, TD support and resistance levels, SuperTrend line and its color
- Trading involves risk. Always test on a demo account first.
Contact
If you have any questions or need help, contact me via Private Message.