AnchorVWAPMulti
- Indicateurs
- Version: 1.51
- Activations: 20

Overview
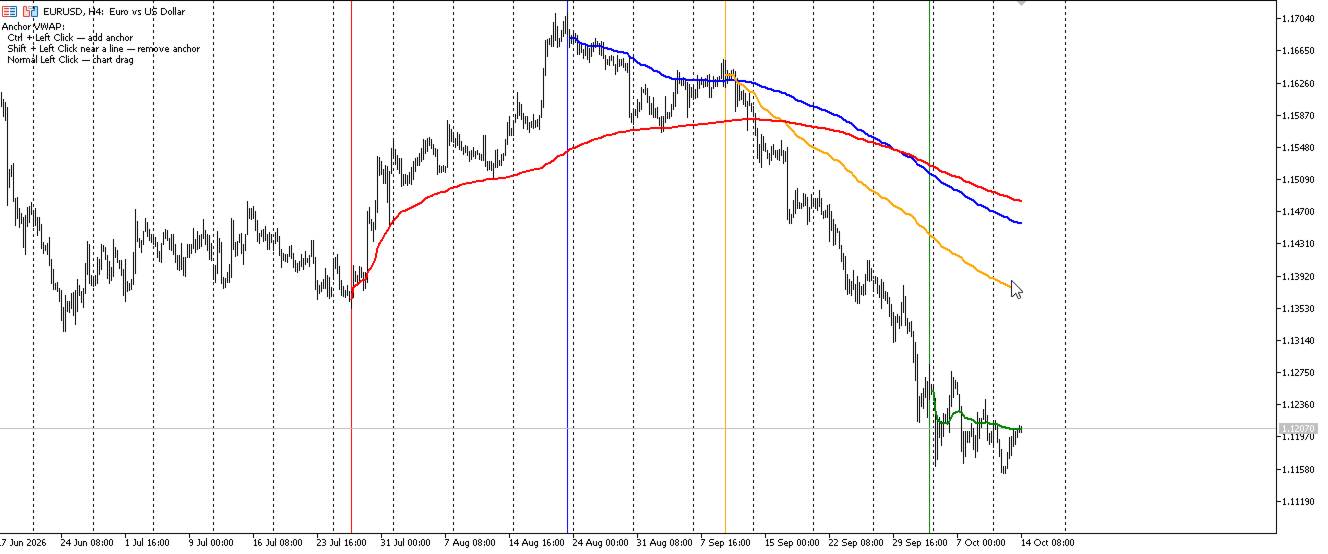
Anchor VWAP Multi is a professional-grade MetaTrader 5 indicator that solves a common problem for traders who work with Anchored VWAP: the need to see multiple anchored VWAPs simultaneously without opening several chart windows or running multiple indicator instances.
You can now plot up to 10 independent Anchored VWAP lines on one chart, each anchored to its own bar, with its own color and — optionally — its own pair of standard-deviation envelopes. Anchors are placed directly on the chart with simple mouse gestures, and they are automatically preserved between timeframe changes and terminal restarts.
The indicator is built for scalpers, intraday, and swing traders who rely on Anchored VWAP as a reference for fair value, institutional positioning, and dynamic support/resistance.
Why Use Multi-Anchor VWAP?
Classic Anchored VWAP indicators typically only support one anchor at a time. As soon as you want to compare, for example, the VWAP anchored to the daily open with the VWAP anchored to the most recent swing high, you need to add another instance of the indicator — which means duplicate windows, duplicated calculations, and no unified view.
Anchor VWAP Multi eliminates this. Each of the 10 anchor slots has its own:
-
anchor timestamp,
-
color,
-
VWAP line,
-
optional ±1σ and ±2σ bands.
You control the whole set of anchors from a single, lightweight indicator.
Key Features
-
Up to 10 simultaneous Anchored VWAP lines on a single chart.
-
Interactive placement — Ctrl + Left Click adds an anchor at the clicked bar.
-
Interactive removal — Shift + Left Click within ±3 bars of a vertical anchor line removes that anchor.
-
Automatic persistence — anchors are stored in terminal global variables and survive timeframe changes, symbol switches, and MT5 restarts.
-
Smart change detection — if you modify an anchor's date/enabled input, the saved state for that slot is invalidated, so your new input takes effect immediately.
-
Standard deviation bands — optional ±1σ and ±2σ envelopes around each VWAP, with dashed/dotted styling.
-
Incremental recalculation — only the forming bar is updated on every tick, so the indicator is extremely fast even on M1 with long history.
-
No repaint on closed bars — VWAP values are fixed once a bar closes.
-
Per-symbol memory — each symbol keeps its own set of anchors.
-
Configurable price source — HLC/3, HL/2, OHLC/4, Close, or Open.
How to Use
-
Attach the indicator to any chart.
-
To add an anchor, hold Ctrl and left-click on any bar. A vertical line will appear at that bar, and the VWAP will start to be calculated from that point.
-
Repeat for up to 10 anchors. Each click goes to the first free slot.
-
To remove an anchor, hold Shift and left-click near its vertical line (within ±3 bars).
-
Normal left-click keeps the standard MT5 chart-pan behavior — the indicator does not interfere.
-
To configure colors, dates, or SD multipliers, open Indicator Properties ( Ctrl + I on chart, or right-click → Indicator List).
A short reminder of the controls is displayed in the top-left corner of the chart.
Inputs
General
| Input | Default | Description |
|---|---|---|
| Price source | HLC/3 | Price used as the VWAP numerator. Options: HLC/3, HL/2, OHLC/4, Close, Open |
| Show standard deviation bands | false | Enable ±1σ and ±2σ bands around each VWAP |
| SD multiplier #1 | 1.0 | Multiplier for the first pair of bands |
| SD multiplier #2 | 2.0 | Multiplier for the second pair of bands |
| Remember clicked anchors between TF changes | true | Persist anchors to terminal global variables |
| Reset saved anchors (set true, apply, then false) | false | Wipe all saved anchors for the current symbol |
Anchor 1 … Anchor 10
Each of the 10 anchor groups contains:
| Input | Description |
|---|---|
| Enabled | Turns this anchor on by default |
| Year / Month / Day / Hour / Minute | Initial anchor timestamp (used when no saved state exists for the slot) |
| Color | Line color for this VWAP and its bands |
Controls Summary
| Action | Result |
|---|---|
| Ctrl + Left Click on chart | Add a new anchor at the clicked bar |
| Shift + Left Click near a vertical anchor line (±3 bars) | Remove that anchor |
| Left Click (no modifiers) | Standard chart drag/pan — no anchor is created |
| Right-click → Indicator Properties | Change dates, colors, SD multipliers, reset memory |