SwingStrength Pro
- Indicateurs
- Version: 1.0
- Activations: 5

SwingStrength Pro – Swing High & Low Strength Scoring for MT5
Not every swing high or low is equal. Some are formed by a sharp rejection on heavy volume and hold for weeks; others are minor pauses that break at the first retest. SwingStrength Pro finds every swing high and swing low that price has not yet closed through, scores each one from 0 to 100, and shows you the strongest resistance and support directly on your chart.
How it works
- Finds swings. The indicator scans the chosen timeframe for fractal highs and lows: bars that are higher (or lower) than a minimum number of bars on each side.
- Removes broken levels. Any swing that price has already closed beyond is discarded. Only levels that are still intact are kept.
- Scores each swing (0–100). Every remaining swing is rated on eight factors, each with an adjustable weight:
- Leg size (x ATR): how far price moved away from the swing, measured in ATR
- Fractal order: how many bars on each side the swing dominates
- Rejection wick: the size of the wick on the rejection side, as a share of the bar's range
- Tick volume: swing-bar volume compared with the average of the previous bars
- Break of structure: whether the move away from the swing broke the previous opposite swing
- Retests: how many times price returned to test the level (1–2 tests score highest; frequent tests weaken a level)
- Retracement: how far price has pulled back toward the swing
- Speed: how quickly the move away from the swing happened
- Estimates break risk. For each swing, a break-risk estimate combines the strength score, the distance from the current price, the number of retests and recent momentum toward the level. This is a formula-based guide, not a statistical probability.
On the chart
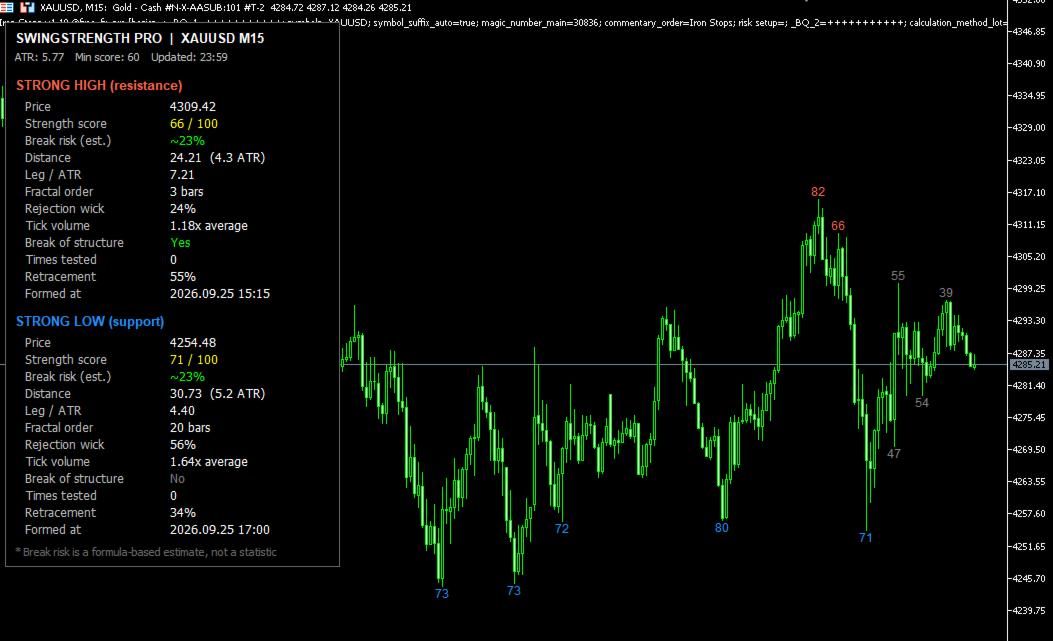
- A score label is printed at every unbroken swing.
- Swings at or above your minimum score are colored (red for highs, blue for lows by default); weaker swings are shown in gray.
The dashboard
The dashboard shows the symbol, analysis timeframe, current ATR, your minimum score and the last update time. Below that it shows two panels: the nearest Strong High (resistance) and the nearest Strong Low (support) that meet your minimum score. Each panel lists:
- Price: the swing level
- Strength score: 0–100 (green at 75 or above)
- Break risk (est.): estimated risk of the level breaking, color-coded green, orange or red
- Distance: distance from the current price, in price and in ATR
- Leg / ATR: size of the move away from the swing
- Fractal order: number of bars the swing dominates on each side
- Rejection wick: wick size as a percentage of the bar's range
- Tick volume: swing-bar volume relative to the average
- Break of structure: Yes or No
- Times tested: number of retests (highlighted at 3 or more)
- Retracement: how much of the move has been retraced
- Formed at: date and time of the swing bar
For EA developers
Two indicator buffers, Swing High Score and Swing Low Score, hold the score at each swing bar and are visible in the Data Window. You can read them from your own Expert Advisor with iCustom() .
Main inputs
- Analysis timeframe: analyze a higher timeframe while viewing a lower one
- ATR period
- Minimum / maximum fractal order
- Bars to scan
- Minimum score for a strong swing
- Eight score weights
- Show or hide score labels and the dashboard; dashboard position; colors
Notes
- Works on any symbol and any timeframe.
- Updates once per new bar of the analysis timeframe, so it uses very little CPU.
- The indicator does not open or manage trades.
- Scores and break-risk values are analytical tools to support your own decisions. They do not predict the future and do not guarantee any trading result.