Ichimoku wave Pro

Ichimoku Wave Pro

PRÉSENTATION

Ichimoku Wave Pro est un indicateur graphique pour MetaTrader 4 destiné à l'étude de la théorie des vagues, des prix et du temps d'Ichimoku dans un seul environnement.

L'indicateur recherche automatiquement des structures A-B-C haussières et baissières, les traite comme des candidates à une vague N, calcule les projections classiques V, N, E et NT, suit la confirmation au-delà du point B et affiche les principaux comptes temporels Ichimoku.

Il comprend aussi un tableau de bord interactif, des filtres Ichimoku optionnels, un contexte de timeframe supérieur, des guides de structure P/Y, des points A/B/C déplaçables et des alertes optionnelles.

Il s'agit d'un outil d'analyse. Il n'ouvre, ne modifie et ne ferme aucune position.

FONCTIONS PRINCIPALES

- Détection automatique des structures A-B-C haussières et baissières.
- Statut distinct pour candidate N et troisième jambe confirmée.
- Projections classiques V, N, E et NT.
- Projection E de degré supérieur en option.
- Suivi des objectifs atteints.
- Nombres Kihon : 9, 17, 26, 33, 42, 65, 76, 129 et 172.
- Projections de temps correspondant basées sur les durées A-B et B-C.
- Lignes temporelles verticales et compteur de barres en direct.
- Guides P contraction et Y expansion selon les swings récents.
- Filtre géométrique Kumo optionnel.
- Filtre de confluence Ichimoku avec Tenkan/Kijun, prix/Kumo et Chikou/prix passé.
- Contexte Ichimoku optionnel d'une unité de temps supérieure.
- Niveau de confirmation B et niveau d'invalidation A.
- Ligne active de C au prix actuel.
- Points A, B et C déplaçables manuellement.
- Accrochage optionnel des points aux barres.
- Modes AUTO et FROZEN/manuel.
- Boutons sur le graphique pour mode, objectifs, temps, P/Y, actualisation et visibilité.
- Alertes optionnelles pour nouvelle structure, confirmation et objectif atteint.
- Position, taille et couleurs du panneau configurables.

PROJECTIONS DE PRIX

V = B + (B - C)
N = C + (B - A)
E = B + (B - A)
NT = C + (C - A)

Ces niveaux sont des projections analytiques et ne garantissent pas les prix futurs.

CONFIRMATION DE LA VAGUE

Une structure A-B-C est d'abord considérée comme candidate. La troisième jambe est confirmée lorsque le prix clôture au-delà de B dans la direction attendue. Il est possible d'afficher les candidates ou uniquement les structures confirmées.

THÉORIE DU TEMPS

Les nombres Kihon peuvent être projetés depuis A, B ou C. L'indicateur compare aussi le nombre de barres écoulées avec les durées A-B et B-C et affiche les temps correspondants.

Les positions temporelles futures sont des approximations basées sur le temps du graphique. Les week-ends, sessions et historiques du courtier peuvent déplacer les lignes.

COMMANDES

AUTO / FROZEN — bascule entre recherche automatique et analyse manuelle figée.
TARGET — affiche ou masque les projections de prix.
TIME — affiche ou masque la théorie du temps.
P/Y — affiche ou masque les structures contraction/expansion.
REFRESH — revient en mode automatique et rescane le graphique.
HIDE — masque ou restaure les objets d'analyse.

REMARQUES

- La détection des swings est de type ZigZag ; le pivot le plus récent peut évoluer.
- InpMinPivotAge permet d'éviter le pivot encore en formation.
- Push et Email nécessitent une configuration dans MetaTrader 4.
- L'indicateur est un outil d'analyse et ne garantit aucun profit.

PARAMÈTRES D'ENTRÉE

Détection des vagues

InpDepth — profondeur de recherche des swings.
InpDeviation — déviation minimale du moteur de swings.
InpBackstep — backstep minimal entre extrêmes.
InpMaxBars — nombre maximal de barres analysées.
InpDetectBullish — activer les structures haussières.
InpDetectBearish — activer les structures baissières.
InpRequireCloseBeyondB — afficher seulement les structures dont la troisième jambe clôture au-delà de B.
InpMinPivotAge — âge minimal de C en barres clôturées ; 0 autorise le pivot en direct.

Kumo et Ichimoku

InpUseKumoFilter — activer le filtre géométrique Kumo.
InpTenkan — période Tenkan-sen.
InpKijun — période Kijun-sen et déplacement Ichimoku.
InpSenkouB — période Senkou Span B.
InpKumoReference — choisir le Kumo visible au point ou le Kumo projeté depuis le point.
InpRequireOppositeKumo — exiger l'orientation Kumo attendue pour la direction de la vague.
InpUseIchiConfluenceFilter — activer le filtre de confluence Ichimoku en C.
InpMinIchiConfluence — score minimum de confluence de 0 à 3.
InpUseHigherTFContext — afficher le contexte Ichimoku d'une unité supérieure.
InpHigherTF — unité de temps utilisée pour ce contexte.

Théorie du temps

InpShowTimeTheory — activer l'affichage de Time Theory.
InpTimeOrigin — choisir A, B ou C comme origine.
InpMaxTimeNumber — plus grand nombre Kihon/correspondant affiché.
InpTimeTolerance — tolérance en barres pour une confluence temporelle.
InpShowCorresponding — afficher les temps correspondants de A-B et B-C.
InpShowTimeVerticals — tracer les lignes temporelles verticales.

Affichage et comportement

InpAutoRefresh — recalcul automatique sur nouvelle barre.
InpShowTargets — afficher V, N, E et NT.
InpShowTargetPrices — afficher les prix des objectifs.
InpShowHigherDegreeE — afficher E de degré supérieur.
InpHigherDegreeMultiplier — multiplicateur de la projection E supplémentaire.
InpShowStructure — afficher P contraction ou Y expansion.
InpShowDecisionLevels — afficher confirmation B et invalidation A.
InpShowActiveLeg — tracer la ligne de C au prix actuel.
InpSnapHandlesToBars — accrocher les points A/B/C déplacés aux barres.
InpShowLegacyScales — afficher les anciennes règles A-B, B-C et A-C.

Alertes

InpAlertOnNewWave — alerte terminal lors d'une nouvelle structure.
InpAlertOnConfirmation — alerte lors de la confirmation de la troisième jambe.
InpAlertOnTargetHit — alerte lorsqu'un objectif est atteint.
InpPushNotifications — envoyer les alertes activées en Push.
InpEmailNotifications — envoyer les alertes activées par Email.

Panneau

InpPanelCorner — coin du graphique utilisé par le panneau.
InpPanelX — décalage horizontal.
InpPanelY — décalage vertical.
InpPanelWidth — largeur du panneau.
InpPanelHeight — hauteur du panneau.

Couleurs

InpBullWaveColor — couleur de vague haussière.
InpBearWaveColor — couleur de vague baissière.
InpTriangleColor — couleur de la structure A-B-C.
InpPointTextColor — couleur des étiquettes A/B/C.
InpActiveLegColor — couleur de la jambe active.
InpConfirmColor — couleur du niveau de confirmation.
InpInvalidColor — couleur du niveau d'invalidation.
InpPWaveColor — couleur P contraction.
InpYWaveColor — couleur Y expansion.
InpTimeColor — couleur des marqueurs Kihon.
InpCorrespondColor — couleur des marqueurs de temps correspondant.
InpVColor — couleur de l'objectif V.
InpNColor — couleur de l'objectif N.
InpEColor — couleur de l'objectif E.
InpNTColor — couleur de l'objectif NT.

Produits recommandés
Dark Bands
Marco Solito
4.95 (164)
Dark Bands   is an Indicator for intraday trading. This Indicator is based on   Counter Trend  strategy but use also Volatility. We can enter in good price with this Indicator, in order to follow the inversions on the current instrument. Key benefits Easily visible take profit/stop loss lines Reliable bands lines with futuristic colors, and  Intuitive directional arrows Useful   statistics , which indicate the   win rate   of the signals   Plus Package  available, leave a feedback to receive

FREE
MTF Currency Strength Panel MT4
Narayanan Mohanan Mohanan Krishnan
MTF Currency Strength Panel for MetaTrader 4 Indicateur de force des devises multi-unités de temps : les 28 paires majeures sur un seul graphique. Ce panneau de force des devises montre où se situent les huit principales devises à l'instant présent, et comment chacune des 28 paires majeures a évolué sur neuf unités de temps à la fois, de M1 à MN1. Les deux lectures tiennent sur un seul graphique et sont actualisées par un minuteur. Le classement des paires en soi est trompeur. Lorsqu'une seule d
FREE
TILLSON MOVING AVERAGE Également appelé indicateur TMA ou T3. Il s'agit d'une moyenne mobile qui utilise EMA et DEMA dans sa formule et est calculée avec une expansion binomiale du 3e degré. Avantages; 1-      signaux erronés rencontrés dans d'autres moyennes mobiles ( zig continu zag ) a été réduit autant que possible. 2-       a empêché les retards observés dans les moyennes mobiles classiques . 3-       Très réussi dans les tendances Les inconvénients 1-       Il n'est pas efficace sur les ma
FREE
Индикатор сглаженного DeMarker  Oscillator (xDeM) Входные параметры: Period - период усреднения Принцип работы Индикатор перерассчитывает стандартный технический индикатор DeMarker Oscillato r (дважды усредняет получаемые значения). Период усреднения индикатора соответствует двойному периоду стандартного DeMarker  Oscillato r . Например : xDeM с периодом усреднения 7 соответствует DeM c периодом 14. Индикаторный буфер не перерисовывается.
FREE
MA Crosses Show
Faran Ataeiraveshti
Hello.  Another free indicator from Sepehr! ;) You can determine the trend with this tool. Using crosses of two Moving averages, you can say that the trend is going to be bullish or bearish; A fast-moving average and a slow one. When the fast-moving crosses up the slow-moving, it's going to be an uptrend and when it crosses down the slow-moving, it means that you are going to have a downtrend. That's easy ;) Hope to enjoy it Sepehr(Faran)
FREE
Custom Candle
Robby Suhendrawan
Custom Candle – Multi-Timeframe Visualization Analyzing multiple timeframes is essential for accurate trading decisions, but switching between charts can be inconvenient and inefficient. The Custom Candle indicator solves this problem by overlaying higher-timeframe (HTF) candles directly onto your lower-timeframe (LTF) chart. This allows you to see the bigger picture at a glance, align with the higher trend, and improve trade accuracy—without leaving your current chart. Key Features Multi-Timefr
FREE
Lisek Stochastic
Darius Hans Lischka
2.83 (6)
Lisek Stochastic   oscillator indicator with Alarm, Push Notifications and e-mail  Notifications. The Stochastic indicator is a momentum indicator that shows you how strong or weak the current trend is. It helps you identify overbought and oversold market conditions within a trend. The Stochastic indicator is lagging indicator, which means it don't predict where price is going, it is only providing data on where price has been !!! How to trade with Stochastic indicator: Trend following: As long
FREE
Adaptive Flow MAs
Vincent Jose Proenca
Adaptive Flow MAs is a moving average indicator designed to naturally adjust to market movements. Unlike traditional averages, it dynamically adapts its periods based on recent volatility and the current trend. The EMA closely follows rapid price swings to capture every impulse, while the SMA remains smoother, providing a stable and reliable reference. With a clean display showing the current adaptive periods, this tool helps traders feel the “flow” of the market without visual clutter. It’s cr
FREE
FastTMALine_mth_PRT is non-redrawn channel indicator and can be used to identify trend and support and resistance levels. Indicator settings allow you to assign a specific coefficient to each price channel, which makes it possible to narrow or expand each channel separately. The   FastTMALine_mth_PRT   indicator is a multicurrency instrument, so the choice of a timeframe depends solely on the trader’s preference.   FastTMALine_mth_PRT   indicator   can be used on any time frame, so you can eas
FREE
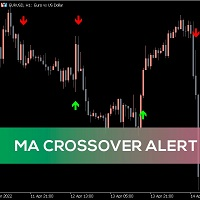
Cross EMA with Trend Filter   is an arrow indicator that generates buy and sell signals when two exponential moving averages (EMA 9 and EMA 21) cross. The indicator features built-in trend filters (ADX or EMA slope), which significantly reduce the number of false signals in sideways (ranging) markets. The indicator displays clear arrows on the chart:   Green Up Arrow   — Buy signal   Red Down Arrow   — Sell signal Signals Buy Signal The fast EMA (9) crosses the slow EMA (21)   from below t
FREE
The Market Sessions indicator is a popular tool among forex and stock traders for visually representing global trading sessions on a price chart. It highlights the time periods for major trading sessions — such as the   Asian (Tokyo) ,   European (London) , and   American (New York)   sessions — directly on the chart. This helps traders identify when markets open and close, allowing for better decision-making based on session-specific trading behavior. - Asian Session (Default: 00:00-09:00) - Lo
FREE
MACD Scanner With Alerts
Niravkumar Maganbhai Patel
4 (2)
MACD Dashboard Panel   This indicator helps you to scan symbols which are in the Market Watch window and filter out a trend according to MACD. Moving Average Convergence Divergence (MACD) is a trend-following momentum indicator that shows the relationship between two moving averages of a security’s price. The MACD is calculated by subtracting the 26-period Exponential Moving Average (EMA) from the 12-period EMA. The result of that calculation is the MACD line. A nine-day EMA of the MACD called
FREE
EMA Multi meter
Abir Pathak
4.92 (13)
How the Indicator Works: This is a Multi-timeframe MA multimeter indicator which studies if price is above or below a particular EMA range and shows Red/Green/Yellow signals. Red: Price Below EMA range Green: Price above range Yellow: Price within range Indicator Properties: EMA Settings: - Default Period is 200. You can change all MA Settings like Period, MA Method (SMA, EMA, etc) or MA Applied Price (Close, Open, etc). - EMA Range list is a comma separated value list for different timeframes
FREE
FxSProMT
Sergiy Podolyak
5 (1)
The FxSProMT indicator shows the current market trend and trend change. Indicator Parameters Ind_Period - the number of previous bars used to calculate actual values. Number_Bars - the number of bars to display the indicator.. Too many bars may significantly slow down the operation of the trading terminal. Signal_Sound - sound alert to notify of trend change. The sound can be played multiple times until the signal is confirmed (the bar closes). Default is disabled. Signal_Alert - an alert to no
FREE
Aurora Momentum Explosion (AME) Is a clean momentum indicator for any instrument and timeframe. It shows, in a sub-window, how strongly price is being pushed in a direction and whether that push is expanding or fading: Trend-power histogram — green for up-momentum, red for down-momentum Explosion line — momentum expanding beyond volatility signals real drive Dead-zone threshold — filters out weak, going-nowhere momentum Works on any symbol and timeframe (built with defaults suited to
FREE
For those who like trend the Force will be a very useful indicator. This is because it is based on the famouse ADX, which measure the strenght of a trend, but without its 3 confusing lines. Force has its very simple interpretation: if the histogram is above zero level the trend is up, otherwise it is down. You can use it to find divergences too, which is very profitable. If you have any doubt or suggestion, please, contact me. Enjoy! MT5 version:  https://www.mql5.com/en/market/product/41928 T
FREE
Forex strength meter is a useful indicator with which novice traders and professionals can analyze the market and see when and where to open a deal. Forex strength meter is an analytical complex for Metatrader4 which, in the form of lines on the chart, shows the trader the direction of the trend and its reversals. The interpretation of the indicator is very simple. When the indicator draws a red line above the blue line on the chart, it means that the trend is now going down. At this point, it
FREE
What is Squeeze Momentum? Squeeze Momentum is an innovative technical analysis indicator popularized by John Carter in "Mastering the Trade" that detects compression periods in markets. This indicator analyzes volatility changes using a combination of Bollinger Bands and Keltner Channel. What Does It Do? Squeeze Detection : Identifies periods when Bollinger Bands move inside the Keltner Channel Momentum Measurement : Shows momentum changes through linear regression calculations Color-Coded Signa
FREE
MA Dev Chanel
Alexandr Gladkiy
Индикатор показывает максимальное отклонение от скользящей средней за заданный период. Границы канала могут послужить своего рода зонами перекупленности/перепроданности, от которых может произойти откат цены к центру канала. За этими уровнями и стоит искать дополнительные сигналы для входа в сделку.  В настройках индикатора всего 2 параметра -  период, за который будет расчитываться индикатор и метод усреднения скользящей средней.
FREE
The Magic SMMA indicator is of great help in determining trend direction. It can be an excellent addition to your existing strategy or the basis of a new one. We humans can make better decisions when we see better visually. So we designed it to show a different color for rising and falling trends. Everyone can customize this in the way that suits them best. By setting the Trend Period, we can optimize it for longer or shorter trends for our strategy. It is great for all time frames. IF YOU NEE
FREE
Currency Scoring
Mr Nukool Chanchingchit
5 (4)
What is a tool ? This indicator use for comparison of 8 major currency from 28 pairs and multiple timeframes and calculates a score of strength from 0-100. How to use Place the indicator on any pair any timeframe, And entering only the value of X Y position to be displayed in the graph. Pair   : Any Timeframe   : Any Input Parameter Start X Position   : Value of X on chart Start Y Position  : Value of Y on chart Visit my products Target Profit Magic Target Profit All The Profit Tracker Currency
FREE
AD Trend line
Pavel Shutovskiy
5 (1)
AD Trend line draws trend lines on the basis of A/D indicator (Accumulation/Distribution). When A/D indicator breaks a trend line, the probability of the trend reversal is very high. This is a multitimeframe indicator which can display values from higher timeframes. Parameters Time-frame — Select a timeframe; zero is the current timeframe of the chart; Trend Line — Display lines on the chart; Apply to — Apply lines to close the candle's highest/lowest value; Width line — Width of the line; Style
FREE
Growing Bands Sh
Nikolay Likhovid
3 (2)
Do you use dynamic ranges (like Bollinger Bands or Envelopes) in your trading? A fixed period is usually used for such calculations. But is such approach relevant to the very nature of the market? In fact, the price chart consists of a series of successive processes - trends and flats. In this case, we can talk about the internal development logic inside a single process only. Therefore, the nature of the market is better described by dynamic ranges designed for the processes occurring "here and
FREE
Just INDY
Pankom Sriboonlue
5 (1)
Just INDY is a simple, and easy to use trend and reversal indicator. It will continuously monitor the movement of the price actions searching for new trends establishing or strong reversals at extreme overbought, and oversold levels. Parameters Signal Perios Sent Notification Please Test it with Strategy Tester and see how it work. Happy Trading...
FREE
StarBody
Gabriele Tedeschi
StarBody è un indicatore istogramma che rappresenta la dimensione delle candele in relazione al loro volume ed evidenzia quelle più grandi delle precedenti. La formula per il calcolo dell'altezza dell'istogramma è semplice quanto efficace: Ampiezza * Volume La grafica indicherà tutte le candele più estese delle precedenti in base alle impostazioni scelte. L'indicatore può essere utile, a volte indispensabile, nelle strategie che prevedono lo sfruttamento della continuazione del trend. Le strate
FREE
Skan
Niravkumar Maganbhai Patel
4.75 (4)
SKAN   This indicator helps you to scan all symbols which are in the Market Watch window and filter out a trend with alerts. It works on five most effective indicators which are used by most of traders for trading: Moving Average Super Trend (ST) Bolinger Band (BB) OPRC BFD It calculates two bars for scanning. When box colour changes to coral or royal blue colour, it indicates you for trend change for long and short entry. And also you will get alert on screen. When it changes to royal blue, it
FREE
Latest Changes in 1.6 :  Added Signal Modes input. Mode 1 : HPF positive go long blue, HPF negative go short red. Mode 2 : slow envelope only, HPF above upper envelope go long blue, HPF below lower envelope go short red. Mode 3 : HPF above both upper envelopes - go long blue, HPF below both lower envelopes go short red. Mode 4 : Go long blue if HPF crosses above upper slow, but fast upper should be below slow upper at the time, exit when HPF crosses below upper fast, reverse logic for short red
FREE
A powerful trend analysis tool for traders of all levels Super Trend Analyzer is a technical analysis tool that uses the Relative Strength Index (RSI) and Moving Average (MA) indicators to identify trends in the market. It is a versatile tool that can be used by traders of all levels of experience. How does it work An uptrend begins when the main trend line and the auxiliary trend line cross from below and the lower minor oscillator is on the rise. A downtrend begins when the main trend line an
FREE
REI Oscillator AM
Andrii Matviievskyi
The presented product is the author's implementation of the REI (Range Expansion Index) indicator developed by Thomas DeMark. REI Oscillator AM is an indicator that measures the rate of price change and signals overbought/oversold conditions if the price shows weakness or strength. The indicator value changes within the range from -100 to +100. Thomas DeMark suggests using the default period of 8 and the following algorithm for using the indicator: When the price rises above level 60 and then fa
FREE
What is the Super Ichi Indicator? Super Ichi is an advanced combination of Ichimoku Kinko Hyo and SuperTrend indicators. This powerful technical analysis tool is designed to identify market trends and generate trading signals. What Does It Do? Dual-Level Trend Analysis : Uses customized versions of Tenkan-sen and Kijun-sen lines Automatic Signal Generation : Displays visual markers (arrows) at crossover points Real-Time Alert System : Provides audio and visual alerts when new signals occur Dynam
FREE
Les acheteurs de ce produit ont également acheté
SR Liquidity
Oleg Rodin
5 (2)
SR Liquidity est un indicateur de trading conçu pour révéler les zones cachées où se concentre la liquidité du marché et où le prix réagit avec le plus d'intensité. Ces zones de liquidité spécifiques agissent comme de puissants niveaux de support et de résistance, vous offrant une cartographie claire des points où le marché est le plus susceptible de se retourner. Plutôt que de tracer des lignes de support et de résistance classiques, l'indicateur SR Liquidity analyse le comportement réel des pr
Trend SniperX MT4
Sarvarbek Abduvoxobov
5 (2)
Trend Sniper X est un indicateur de suivi de tendance multi-temporalité pour MetaTrader 5 qui aide les traders à identifier la direction de la tendance et les points de retournement potentiels avec clarté et précision. Pour MT5 : https://www.mql5.com/en/market/product/181101 Information sur le prix : Le prix actuel est une offre promotionnelle et peut évoluer au fur et à mesure de la sortie des prochaines mises à jour et nouvelles fonctionnalités. Canal Code2Profit Maîtrisez le marché grâce à l'
M1 Sniper
Oleg Rodin
4.97 (29)
M1 SNIPER est un système d'indicateurs de trading facile à utiliser. Il s'agit d'un indicateur à flèche conçu pour l'unité de temps M1. Cet indicateur peut être utilisé seul pour le scalping sur l'unité de temps M1 ou intégré à votre système de trading existant. Bien que conçu spécifiquement pour le trading sur l'unité de temps M1, ce système peut également être utilisé avec d'autres unités de temps. Initialement, j'avais conçu cette méthode pour le trading du XAUUSD et du BTCUSD. Cependant, je
Volume Break Oscillator est un indicateur qui fait correspondre le mouvement des prix aux tendances des volumes sous la forme d'un oscillateur. Je souhaitais intégrer l'analyse des volumes dans mes stratégies mais j'ai toujours été déçu par la plupart des indicateurs de volume, tels que l'OBV, le Money Flow Index, l'A/D mais aussi le Volume Weighted Macd et bien d'autres. J'ai donc écrit cet indicateur pour moi-même, je suis satisfait de son utilité, et j'ai donc décidé de le publier sur le ma
Quantum Breakout Indicator PRO
Bogdan Ion Puscasu
4.96 (26)
Présentation       Quantum Breakout PRO   , l'indicateur révolutionnaire MQL5 qui transforme la façon dont vous négociez les zones d'évasion ! Développé par une équipe de traders expérimentés avec une expérience de trading de plus de 13 ans,   Quantum Breakout PRO   est conçu pour propulser votre parcours de trading vers de nouveaux sommets grâce à sa stratégie de zone de discussion innovante et dynamique. Quantum Breakout Indicator vous donnera des flèches de signalisation sur les zones d'év
Actuellement 30% de réduction ! La meilleure solution pour tout débutant ou trader expert ! Ce logiciel de tableau de bord fonctionne sur 28 paires de devises. Il est basé sur 2 de nos principaux indicateurs (Advanced Currency Strength 28 et Advanced Currency Impulse). Il donne un excellent aperçu de l'ensemble du marché Forex. Il montre les valeurs de l'Advanced Currency Strength, la vitesse de mouvement des devises et les signaux pour 28 paires de devises dans tous les (9) délais. Imaginez
Neuro Poseidon MT4
Daria Rezueva
4.74 (46)
Neuro Poseidon is a new indicator by Daria Rezueva. It combines precise trading signals with adaptive TP/SL levels - creating best possible trades as a result! Message me and get  Neuro Poseidon Assistant  as a gift to automize your trading process! What makes it stand out? 1. Proven profitability on all assets and timeframes 2. Only confirmed BUY and SELL signals present on the chart 3. Adaptive TP & SL levels generated by the software for each trade 4. Easy to understand - suitable for all
Currency Strength Wizard est un indicateur très puissant qui vous offre une solution tout-en-un pour un trading réussi. L'indicateur calcule la puissance de telle ou telle paire de devises en utilisant les données de toutes les devises sur plusieurs périodes. Ces données sont représentées sous la forme d'un indice de devise facile à utiliser et de lignes électriques de devise que vous pouvez utiliser pour voir la puissance de telle ou telle devise. Tout ce dont vous avez besoin est d'attacher l'
DayTrader PRO MT4
Davit Beridze
4.5 (8)
DayTrader PRO MT5:  https://www.mql5.com/en/market/product/186222 DayTrader PRO est un indicateur de trading avancé qui combine le filtre Laguerre de John Ehlers avec un puissant moteur d'auto-optimisation. Au lieu d'utiliser des paramètres fixes, l'indicateur recherche automatiquement les meilleurs réglages en fonction des conditions récentes du marché, vous aidant à vous adapter à la volatilité changeante sans ajustements manuels constants. L'indicateur génère des signaux clairs d'ACHAT (BUY)
Ce produit a été mis à jour pour le marché 2026 et optimisé pour les dernières versions de MT5. AVIS DE MISE À JOUR DU PRIX : Smart Trend Trading System est actuellement disponible à $99 . Le prix passera à $199 après les 30 prochains achats . OFFRE SPÉCIALE : Après avoir acheté Smart Trend Trading System, envoyez-moi un message privé pour recevoir Smart Universal EA GRATUITEMENT et transformer vos signaux Smart Trend en trades automatisés. Smart Trend Trading System est un système de trading c
All in One Trade
Alexey Minkov
4.52 (29)
All-in-One Trade Indicator (AOTI) automatically calculates daily target levels for 14 currency pairs and brings together technical analysis tools for any trading instrument in a single window: Double Channel for trend detection, Price Channel, MA Bands, Climax Bars detector, Fibonacci levels, support/resistance micro-levels, and arrow reversal signals. Works on the MetaTrader 4 platform. Daily levels are calculated for EURUSD, EURJPY, GBPUSD, USDCHF, EURGBP, EURCAD, EURAUD, AUDJPY, GBPAUD, GBPCA
Gann Made Easy
Oleg Rodin
4.84 (172)
Gann Made Easy est un système de trading Forex professionnel et facile à utiliser qui est basé sur les meilleurs principes de trading en utilisant la théorie de mr. WD Gann. L'indicateur fournit des signaux d'ACHAT et de VENTE précis, y compris les niveaux Stop Loss et Take Profit. Vous pouvez échanger même en déplacement en utilisant les notifications PUSH. VEUILLEZ ME CONTACTER APRÈS L'ACHAT POUR RECEVOIR GRATUITEMENT DES INSTRUCTIONS DE TRADING ET D'EXCELLENTS INDICATEURS SUPPLÉMENTAIRES! Vou
Neo Wave PRO
Nikolay Raykov
5 (1)
Price & Time Market Structure Indicator A professional market structure tool that analyzes waves through both price and time — not price alone. Main Description NeoWave PRO is a professional market structure indicator for MetaTrader 4 designed for traders who want to move beyond traditional one-dimensional wave tools such as ZigZag, swing indicators, and basic high/low systems. Most wave indicators analyze only one thing: Price. But a real market wave is not only a price movement. A true wave de
CRT Candle Range Theory HTF MT4.   Ultimate CRT Indicator: Advanced ICT Concepts and Malaysian SnR Trading System Master the Market Maker's Footprints with the Most Advanced Candle Range Theory Indicator Unlock the true power of  Smart Money Concepts (SMC)  and trade precisely like the institutions with the  Ultimate CRT Indicator . Built exclusively for serious traders, this indicator automates the highly effective  Candle Range Theory (CRT) , a core pillar of  ICT Concepts (Inner Circle Trader
Identify key turning points with reliable fractal analysis This indicator examines the price structure of fractals of different periods to determine possible reversal points in the market, providing timing to positional traders that already have a fundamental or technical valuation model. Unlike its younger brother, Reversal Fractals , this indicator won't miss reversals because of the period selected, and will find reversal fractals on a zig-zag fashion, ignoring those reversals which do not
Le système PRO Renko est un système de trading très précis spécialement conçu pour le trading de graphiques RENKO. Il s'agit d'un système universel qui peut être appliqué à divers instruments de négociation. Le système neutralise efficacement ce qu'on appelle le bruit du marché en vous donnant accès à des signaux d'inversion précis. L'indicateur est très facile à utiliser et n'a qu'un seul paramètre responsable de la génération du signal. Vous pouvez facilement adapter l'outil à n'importe que
Reversal Master
Alexey Minkov
4.81 (16)
Reversal Master helps you read the current direction of price movement and spot potential reversal points on the chart. It is built for traders who want a clearer view of the market situation before making a decision. You can use it as a standalone tool, as an add-on to a ready-made trading system, or as a building block for developing your own strategies. To locate reversal points, Reversal Master evaluates several market conditions at once, since combined analysis gives a more complete picture
RFI levels PRO
Roman Podpora
5 (1)
L'indicateur montre avec précision les points de retournement et les zones de retour des prix où le       Acteurs majeurs   . Vous repérez les nouvelles tendances et prenez des décisions avec une précision maximale, en gardant le contrôle de chaque transaction. VERSION MT5     -     Révèle son potentiel maximal lorsqu'il est combiné à l'indicateur   TREND LINES PRO Ce que l'indicateur montre : Structures et niveaux d'inversion avec activation au début d'une nouvelle tendance. Affichage des nive
Oversold and Overbought Candles, Trendlines, and BUY-SELL arrows in the single Indicator. Built from 8 default MT4 Indicators. Stochastic,RSI,SAR,CCI,RVI,DeMarker,WPR and MA. It is " NON REPAINT " indicator. All buffers do not repaint.  Double Trendline buffers that can also be used to identify sideway market and support resistance area.  Any timeframes and any currency pairs. Parameters: Show Trend . TRUE/FALSE to show trendlines on the chart Follow Trend. If TRUE , Dapitrend will show only
Surveillez chaque symbole et chaque unité de temps avec vos indicateurs préférés depuis un seul graphique. L’Ultimate Indicator Dashboard vous offre une vue complète multi-symboles, multi-indicateurs et multi-unités de temps — le tout dans un panneau propre et déplaçable. Arrêtez de passer d’un graphique à l’autre. Voyez RSI, MACD, Bollinger Bands, Ichimoku, ATR, le volume, et bien plus encore sur tous vos instruments en un coup d’œil. Les signaux à code couleur vous montrent exactement où se tr
Advanced Supply Demand
Bernhard Schweigert
4.91 (302)
Offre spéciale : 30 % de réduction La solution idéale pour les traders débutants comme experts ! Cet indicateur est un outil de trading unique, performant et abordable grâce à l’intégration de nombreuses fonctionnalités exclusives et d’une nouvelle formule. Cette mise à jour vous permet d’afficher des zones sur deux unités de temps. Vous pourrez ainsi visualiser non seulement une unité de temps supérieure, mais aussi l’unité de temps du graphique, ainsi que l’unité de temps supérieure : des z
Accès Officiel à l’Écosystème BlueDigitsFx Recevez les mises à jour de l’infrastructure, les ressources de workflow, les nouveaux produits et l’accès à l’écosystème officiel BlueDigitsFx. Écosystème Telegram Site Web Version MT5 BlueDigitsFx Easy 123 System — Puissant système de détection des retournements et cassures pour MT4 Système tout-en-un sans repaint pour identifier les retournements et les cassures du marché — conçu pour les traders qui privilégient la structure, la clarté et les pri
M1 Arrow Scalping - shows signals on the M1 period, does not redraw entry points and can work on all major currency pairs + metals (gold/silver). The indicator analyzes the market using algorithms for determining price patterns and shows the trader the price reversal points on the chart. The red dot shows that the price will turn down and the blue dot shows that the price will turn up. The indicator also sends signals to the phone in the form of PUSH notifications. Therefore, you do not need to
PZ Trend Trading
PZ TRADING SLU
4.8 (5)
Capture every opportunity: your go-to indicator for profitable trend trading Trend Trading is an indicator designed to profit as much as possible from trends taking place in the market, by timing pullbacks and breakouts. It finds trading opportunities by analyzing what the price is doing during established trends. [ Installation Guide | Update Guide | Troubleshooting | FAQ | All Products ] Trade financial markets with confidence and efficiency Profit from established trends without getting whips
Zoryk Gold mt4
Reda El Koutbane
5 (1)
ZORYK — Système avancé de signaux et de planification pour XAUUSD sur MetaTrader 4 Vous connaissez probablement cette situation. Vous analysez l’or, attendez l’entrée, puis ouvrez enfin la position. Le prix part immédiatement contre vous. Vous fermez trop tôt, déplacez le Stop Loss ou hésitez quelques secondes. Peu après, le marché atteint exactement la direction et l’objectif que vous aviez prévus, mais sans vous. Le problème n’était pas toujours la direction. Le véritable problème était l
The Storm Prices indicator is trendy, arrow family. It is easy to work and understand when the first red arrow appears, you need to buy, when the first blue arrow appears, sell. The indicator is used for scalping and pipsing. The indicator makes calculations based on several technical indicators. Determines the direction of the trend and gives a fairly clear indication of the position. The indicator allows you to determine the opportunities for entering the market for a short time. There is a sw
Liquidity Flow Analyzer (LFA) v2.2 Détecte en temps réel où le volume institutionnel entre sur le marché — avant le mouvement du prix. Ce que vous voyez Histogramme vert/rouge — flux net de liquidité par bougie Vert = acheteurs dominants Rouge = vendeurs dominants LFA Line — tendance lissée du flux de liquidité sur la période définie Ligne EMA Signal — le croisement entre LFA et EMA indique un changement de momentum (similaire au MACD) Flèches — signaux d’ Accumulation ↑ et de Distribution ↓ , c
Prop Firm Sniper
Mohamed Hassan
4.33 (6)
Prop Firm Sniper MT4  is a professional market structure indicator that automatically identifies high-probability BUY and SELL opportunities using BOS and CHoCH analysis. Recommended Timeframes: For backtesting, use the indicator on   M5 or M15   for Gold (XAUUSD), and   M15 or H1   for more volatile Forex pairs such as   GBPUSD, USDJPY, EURGBP , and similar markets. CONTACT ME AFTER PURCHASE TO CLAIM YOUR FREE BONUSES! Prop Firm Sniper  is a professional market structure indicator designed t
Currency Strength Exotics
Bernhard Schweigert
4.88 (33)
ACTUELLEMENT 20% DE RÉDUCTION ! La meilleure solution pour tout débutant ou trader expert ! Cet indicateur est spécialisé pour montrer la force de la devise pour tous les symboles comme les paires exotiques, les matières premières, les indices ou les contrats à terme. C'est le premier de son genre, n'importe quel symbole peut être ajouté à la 9ème ligne pour montrer la force réelle de la devise de l'or, l'argent, le pétrole, DAX, US30, MXN, TRY, CNH etc. Il s'agit d'un outil de trading unique
KURAMA GOLD SIGNAL PRO (MT4) — Filtre à 7 couches · TP/SL automatique · Score de qualité · Sauvegarde de l'historique des signaux | Système de trading complet pour le XAUUSD Pas de repeint en temps réel. À l'instant où un signal apparaît, la flèche, l'entrée, le TP et le SL sont verrouillés sur place et ne bougent plus jamais ensuite. Ce que vous tradez, c'est ce signal en temps réel. Et dans la v7.20, chaque signal réellement envoyé est sauvegardé automatiquement et restauré à l'identique aprè
Plus de l'auteur
Ichimoku wave
Bardia Mohammadi
For all those traders interested or currently trading Ichimoku, you will not want to miss this article. Although I am heading out in a few hours with my girlfriend to Harbin Hot Springs, I wanted to write a brief introduction to   Ichimoku Number Theory   as there has been a lot of questions (and confusion) about Ichimoku settings, time frames, etc. The basis of Ichimoku as known to most is the 5 lines; Tenkan Line Kijun Line Senkou Span A (part of the Kumo) Senkou Span B (other part of the Kum
FREE
Filtrer:
Aucun avis
Répondre à l'avis