M1 GOLD Precision EA
- Experts
-
Ade Ruswanda
 MQL5/MT5 developer focused on XAUUSD systems.
Real tick data, 100% history quality, out-of-sample validation with data
reserved before parameters are chosen.
Questions answered within 24 hours. - Version: 1.0
- Activations: 20
M1 Gold Precision trades one specific situation on XAUUSD: an unusually large one-minute candle that prints inside a prior supply or demand zone.
Gold moves in bursts. When a single M1 candle expands beyond 2.25 times the recent average range, that move is usually driven by a short-lived imbalance rather than genuine repricing. When it happens where price has previously reversed, the odds favour a pullback.
The EA sells after an oversized bullish candle and buys after an oversized bearish one, then manages the position with a staged trailing stop.
No martingale. No grid. No averaging down. One position at a time, always with a hard stop loss attached from the moment of entry.
=== BACKTEST RESULTS ===
Broker: FBS | Symbol: XAUUSD | Timeframe: M1
Period: September 2025 to August 2026 (12 months)
Modelling: Every tick based on real ticks
History quality: 100%
Initial deposit: $100 | Lot 0.01, rising to 0.02 on candles above
800 points | Leverage 1:100
Total net profit: $502.35 (502% return)
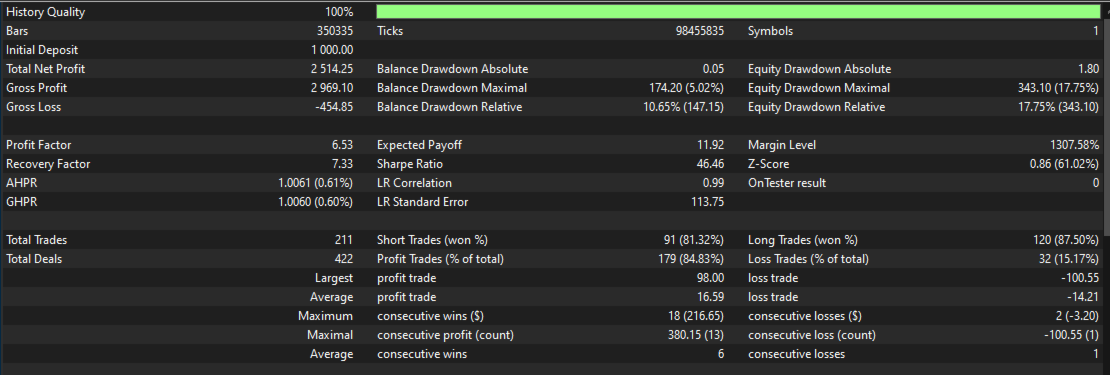
Profit factor: 6.53
Total trades: 211
Win rate: 84.83%
Short trades won: 81.32%
Long trades won: 87.50%
Balance drawdown: $34.44 (5.87%)
Equity drawdown: $68.62 (23.95%)
Largest single loss: -$20.11
Max consecutive losses: 2 (-$0.64 combined)
Max consecutive wins: 18 (+$76.03)
Recovery factor: 7.33
Results scale proportionally with lot size. The same test at 0.05/0.10 lots returned $2,514 with an identical profit factor of 6.53.
=== MONTH BY MONTH ===
Same 12-month test at 0.05 lot, rising to 0.10 on trigger candles above
800 points. Winners and losers exclude breakeven exits, counted
separately in the BE column.
"Avg float" is the average unrealised drawdown a winning trade went
through before closing in profit. It is measured from tick data, not
from the MT5 report, which does not record it.
Month Win Loss BE Profit Avg float Avg hours
-------------------------------------------------------------
Sep 2025 2 1 0 $17.80 -$6.35 0.04
Oct 2025 21 2 0 $284.65 -$29.86 0.05
Nov 2025 4 1 0 $32.20 -$9.46 0.26
Dec 2025 6 1 0 -$55.30 -$34.97 0.18
Jan 2026 13 2 0 $167.40 -$14.77 0.20
Feb 2026 26 6 0 $352.75 -$23.13 0.08
Mar 2026 23 2 1 $636.80 -$73.73 0.12
Apr 2026 17 8 0 $236.65 -$56.44 0.14
May 2026 21 2 1 $284.35 -$26.24 0.15
Jun 2026 12 2 0 $177.90 -$27.07 0.20
Jul 2026 12 2 0 $318.50 -$27.22 0.11
Aug 2026 20 3 0 $60.55 -$16.89 0.14
-------------------------------------------------------------
TOTAL 177 32 2 $2,514.25 -$31.11 0.13
Total positions: 211
Balance drawdown: -$174.20
Largest single loss: -$100.55
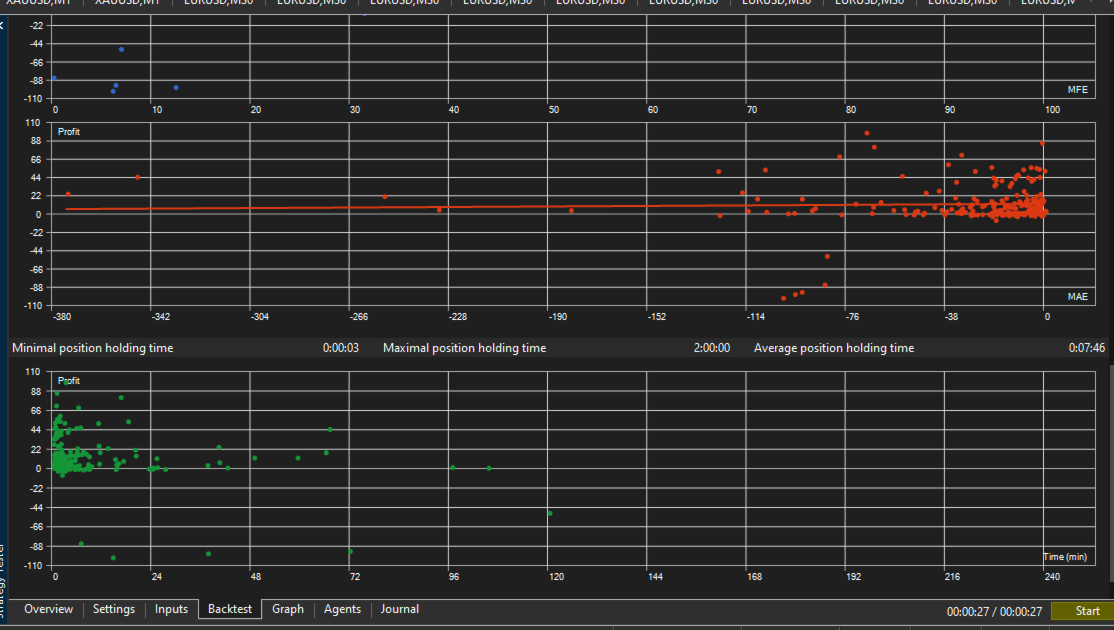
Average holding time: 8 minutes | longest: 120 minutes
Deepest single-trade floating drawdown: -$374.60
What the table is for:
Trade frequency varies considerably. September produced 3 positions,
February 32. There is no way to force a steady rate without loosening
the entry conditions, which I am not willing to do.
Most positions resolve in minutes. Average holding time is 8 minutes,
and the hard limit is 120. This is not a strategy that leaves trades
open overnight.
Winning trades still go through drawdown first. The average winner sat
at -$31 before closing in profit, and in March that average was -$74.
The deepest any single position reached was -$374 before recovering.
December 2025 lost money. One losing month in twelve is not a number to
plan around — it comes from the period the strategy was developed on.
Expect more losing months than this table shows.
=== HOW THE FILTERS WERE CHOSEN ===
Twelve months of tick data were split in half. Parameters were selected on the first half and verified on the second. Any filter that only worked on the tuning half was discarded.
Filters that were tested and rejected: ADX, RSI, StochRSI, MACD, VWAP, moving average crossovers, trendlines, golden-zone retracement, hour-of-day and day-of-week filters, and several candle-pattern conditions.
What survived: the supply/demand zone filter, the staged trailing stop, the trading window, and a time limit on open positions.
This matters because most published backtests show the result of optimisation, not validation. A system tuned on the same data it is measured on will always look good.
=== SELECTIVE BY DESIGN ===
The EA produces roughly 18 trades per month.
Some days produce one or two positions. Many days produce none at all. The trigger condition is deliberately narrow: an oversized candle is not enough on its own, it must also appear inside a zone where price previously reversed.
If you expect constant activity, this is not the right EA for you. One month is too short a sample to judge it.
=== WHAT YOU SHOULD KNOW BEFORE BUYING ===
Equity drawdown reaches 24%.
Positions are given room to breathe. The stop loss sits at Fibonacci 4.236 of the trigger candle, which is deliberately wide. You will see open positions in the red, sometimes deeply, before the trailing stop engages.
In 12 months of testing, the ten deepest floating drawdowns all closed in profit or at breakeven. Tighter stops were tested from 2.0 to 5.0 and every one of them performed worse. But you need to be comfortable watching a position sit in drawdown before it recovers.
Spread matters. The system was developed on a broker averaging 33 points spread on XAUUSD. Wider spreads will reduce performance. A spread filter is built in and enabled by default.
XAUUSD on M1 only. It has not been validated on other instruments or timeframes.
This EA has not yet accumulated a live track record. The results above are from backtesting on real tick data at 100% history quality. Download the demo and run it in your own Strategy Tester before deciding.
=== WHY TRADE FREQUENCY VARIES — PLEASE READ ===
The entry filter requires the trigger candle's range to fall between 500
and 2,000 points. That threshold is absolute, while gold's volatility
scales with its price level. The lower gold trades, the rarer a
500-point candle becomes.
This is visible inside the test period itself. Gold ranged from about
$3,660 to $5,010 across the twelve months, and the share of M1 candles
reaching 500 points moved with it:
Month Avg gold M1 candles >= 500 pts Positions
--------------------------------------------------------
Sep 2025 $3,664 0.50% 3
Oct 2025 $4,063 7.55% 23
Nov 2025 $4,083 2.39% 5
Dec 2025 $4,312 2.74% 7
Jan 2026 $4,746 13.54% 15
Feb 2026 $5,014 24.35% 32
Mar 2026 $4,884 24.66% 26
Apr 2026 $4,725 7.72% 25
May 2026 $4,588 4.91% 24
Jun 2026 $4,239 6.23% 14
Jul 2026 $4,074 2.61% 14
Aug 2026 $4,404 3.82% 23
Correlation between average gold price and monthly position count: 0.76
September 2025 produced three positions because gold was near $3,660 and
only half a percent of one-minute candles were large enough to qualify.
February 2026 produced thirty-two because gold was above $5,000 and
almost a quarter of candles qualified.
WHAT HAPPENS AT LOWER GOLD PRICES
I tested the same build on three earlier years to measure how far this
goes:
Sep 2025 - Aug 2026 gold ~$4,400 average 211 positions
Sep 2024 - Aug 2025 gold ~$2,800 average 18 positions
Sep 2023 - Aug 2024 gold ~$2,100 average 3 positions
Sep 2022 - Aug 2023 gold ~$1,850 average 3 positions
At $1,850 gold, a 500-point candle is equivalent to demanding a
1,190-point candle at today's prices. The trigger almost never fires.
WHAT THIS MEANS FOR YOU
At current gold prices the EA trades at roughly the frequency shown in
the monthly table above.
If gold falls substantially, expect the frequency to drop sharply. The
EA will not start losing money in that scenario — it will simply stop
taking trades.
If you want to keep the frequency roughly constant as prices change,
lower InpMinPoints proportionally. The tested setting of 500 points is
about 0.114% of a $4,400 price. As a rough guide:
gold $4,000 -> InpMinPoints around 456
gold $3,500 -> InpMinPoints around 399
gold $3,000 -> InpMinPoints around 342
gold $2,500 -> InpMinPoints around 285
I have not tested those adjusted values, and I am not claiming the
strategy performs equivalently at lower price levels. I am telling you
what the parameter does and leaving the decision with you.
I am also telling you this before you buy rather than letting you find
it after.
=== MINIMUM REQUIREMENTS ===
Platform: MetaTrader 5
Symbol: XAUUSD (Gold)
Timeframe: M1
Minimum deposit: $100
Recommended: $200 or higher
Leverage: 1:100 minimum
Account type: Hedging or Netting (both supported)
Broker spread: Below 40 points on XAUUSD
VPS: Strongly recommended
=== RECOMMENDED LOT SIZE ===
Capital $100 -> lot 0.01 -> expected equity drawdown around $69
Capital $200 -> lot 0.02 -> expected equity drawdown around $137
Capital $500 -> lot 0.05 -> expected equity drawdown around $343
Capital $1000 -> lot 0.10 -> expected equity drawdown around $686
All three drawdown figures quoted in this description — 24% equity
drawdown, -$69 at 0.01 lot, and -$374 at 0.05/0.10 lot — describe the
same trades at different position sizes. Drawdown scales with lot; the
percentage does not.
Based on the 12-month backtest. Past results do not predict future performance.
=== IMPORTANT SETTINGS ===
InpServerOffset - Your broker's GMT offset. Default 3 (GMT+3).
SET THIS CORRECTLY or the trading window will be wrong.
InpLot - Position size. Start at 0.01 per $100 of capital.
InpMaxSpread - Maximum spread at entry, in points. Default 100.
Lower it to 60 if your broker's spread is volatile.
All other parameters were selected through two-half validation. Changing them moves the system away from what was tested.
=== FIRST RUN CHECKLIST ===
1. Attach to an XAUUSD M1 chart
2. Open the Experts tab - the startup log prints every active setting
3. Confirm the log shows point=0.01 and digits=2
4. Set InpServerOffset to match your broker
5. Enable AutoTrading
The log records every signal and every rejection with a reason. If the EA appears idle, the log will tell you why.
=== SUPPORT ===
Questions answered within 24 hours.
Version updates and technical notes: https://www.mql5.com/en/channels/m1goldprecision
Send me your Strategy Tester report or account statement and I will help you compare it against the reference results above.
=== DISCLAIMER ===
Trading foreign exchange, gold, and CFDs involves substantial risk and may not be suitable for every investor. Past performance does not guarantee future results, and losses are possible.
Results vary between brokers due to differences in execution, spread, slippage, and liquidity.
No system can eliminate trading risk. Test on a demo account before committing real capital.