Pro RSI Divergence Breakout Hidden Signals Filter
- Indicateurs
- Version: 2.1
- Activations: 5

Breakout Divergence RSI MultiFilter is a modular technical analysis indicator for MetaTrader 5 designed to identify Regular and Hidden RSI Divergences alongside confirmed trendline breakout continuation opportunities. Equipped with an algorithmic multi-layer filtering engine comprising 16 technical filter systems, this indicator provides an analytical bridge between momentum divergence recognition and structural price action confirmation.
1. TECHNICAL OVERVIEW AND ARCHITECTURE
Breakout Divergence RSI MultiFilter operates directly on MetaTrader 5 chart windows, scanning price structure and Relative Strength Index (RSI) momentum data to detect structural discrepancies between price swings and oscillator momentum. Standard divergence indicators often present two operational limitations: early counter-trend entries in strong trending regimes, and subjective manual trendline drawing. This indicator addresses both challenges systematically:
First, divergence swing points are identified dynamically through algorithmic fractal swing geometry governed by bilateral confirmation bars (Swing_Left and Swing_Right) across a customizable historical lookback period.
Second, each validated divergence forms an active structural boundary on the chart. When price breaks and closes beyond this dynamic divergence trendline, an objective Breakout Signal (Breakout Buy or Breakout Sell) is plotted, translating a classic reversal formation into an actionable structural breakout trigger.
Third, a multi-filter architecture allows traders to cross-verify divergence setups with moving averages, trend strength indicators, momentum oscillators, dynamic support and resistance levels, and algorithmic Fibonacci retracement zones.
2. MATHEMATICAL FOUNDATION AND DETECTION MECHANICS
The indicator integrates classic oscillator calculations with structural price swing mechanics. The core calculation layers comprise:
2.1. Relative Strength Index (RSI) Engine:
The RSI calculation utilizes the Wilder exponential smoothing technique evaluated across the designated RSI_Period (default: 8) applied to the chosen price source (default: PRICE_CLOSE). An 8-period RSI delivers heightened responsiveness to short-term momentum changes, establishing distinct pivot peaks and troughs relative to standard 14-period baselines.
2.2. Pivot Point Recognition:
Pivots are defined using strict bilateral fractal geometry. A candle at bar index i qualifies as a Swing High only when its high price strictly exceeds the high prices of all candles within the Swing_Left horizon (i+1 to i+Swing_Left) and simultaneously exceeds or equals all candles within the Swing_Right horizon (i-1 to i-Swing_Right). A Swing Low is identified under identical symmetrical rules applied to bar low prices. This structural requirement ensures that swing extremes represent validated market turning points rather than intra-bar noise.
2.3. Divergence Classification Rules:
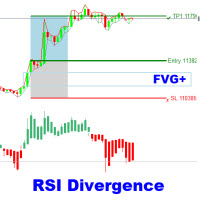
- Regular Bullish Divergence: Price forms a lower low (Low[i] < Low[prev_pivot]) while RSI forms a higher low (RSI[i] > RSI[prev_pivot]). Indicates potential exhaustion of downward momentum and an impending upward reversal.
- Regular Bearish Divergence: Price forms a higher high (High[i] > High[prev_pivot]) while RSI forms a lower high (RSI[i] < RSI[prev_pivot]). Indicates upward momentum exhaustion and potential downward reversal.
- Hidden Bullish Divergence: Price forms a higher low (Low[i] > Low[prev_pivot]) while RSI forms a lower low (RSI[i] < RSI[prev_pivot]). Indicates continuation of a dominant bullish trend following a corrective pullback.
- Hidden Bearish Divergence: Price forms a lower high (High[i] < High[prev_pivot]) while RSI forms a higher high (RSI[i] > RSI[prev_pivot]). Indicates continuation of a dominant bearish trend following a counter-trend rally.
2.4. Trendline Slope and Breakout Execution Logic:
When a valid divergence is established between historical bar 1 (t1, price1) and historical bar 2 (t2, price2), the indicator computes the linear slope across the structural coordinate space:
Slope = (price2 - price1) / (bar1 - bar2).
The dynamic trendline projection at current bar 1 is calculated as:
Line_Price = price2 + Slope * (bar2 - 1).
A Breakout Buy trigger occurs when the preceding candle close penetrates above this dynamic slope line (Close[1] > Line_Price and Close[2] <= Line_Price) following a Bullish Regular or Bullish Hidden setup.
A Breakout Sell trigger occurs when the preceding candle close penetrates below this dynamic slope line (Close[1] < Line_Price and Close[2] >= Line_Price) following a Bearish Regular or Bearish Hidden setup.
Once a breakout candle closes and fulfills all active technical filters, the divergence state is marked as broken, preventing duplicate triggers on the same swing leg.
2.5. Signal Timing and Non-Repainting Behavior:
Signals are calculated strictly upon bar close. When bar 1 closes and meets all structural divergence or breakout criteria, the arrow is drawn on the chart and notifications dispatch immediately. Plotted arrows, trendlines, and calculation buffers do not recalculate, repaint, or disappear after the signaling candle has closed.
3. COMPREHENSIVE FILTER MODULE DESCRIPTIONS
To isolate high-probability setups from low-liquidity consolidations, 16 individual filtering algorithms can be independently enabled or combined:
- RSI Cross Filter: Evaluates secondary RSI (default: 14). For Buy, RSI must cross upward out of Oversold (RSI[1] > Oversold and RSI[2] <= Oversold). For Sell, RSI must cross downward out of Overbought (RSI[1] < Overbought and RSI[2] >= Overbought).
- ADX Trend Strength Filter: Utilizes ADX (default: 10). Filters out directionless consolidation by demanding ADX >= ADX_Min_Level (default: 20.0).
- Single Moving Average Filter: Applies directional baseline (default: 50 SMA). Buy setups require Close > MA; Sell setups require Close < MA.
- Ichimoku Senkou Span B Filter: Extracts Senkou Span B with Kijun (default: 26) and Senkou B (default: 52). Longs require Close > SenkouB; shorts require Close < SenkouB.
- RSI 75 Filter: Implements long-term RSI cycle (period 75). Buys require RSI 75 > 50; Sells require RSI 75 < 50.
- Double Moving Average Filter: Combines fast EMA (default: 30) and slow EMA (default: 140). Buys require MA A > MA B; Sells require MA A < MA B.
- Awesome Oscillator (AO) Matrix: Provides granular validation via AO Volume Filter (AO >= AO_Buy_Min for longs, AO <= AO_Sell_Max for shorts), AO Color Filter (increasing for longs, decreasing for shorts), and AO Zero Line Filter (AO > 0 for longs, AO < 0 for shorts).
- Parabolic SAR Filter: Synchronizes entries with SAR dots. Buys require Close > SAR; Sells require Close < SAR.
- Heiken Ashi Filter: Computes synthetic Heiken Ashi bars dynamically. Buys require bullish bar (HA Close > HA Open); Sells require bearish bar (HA Close < HA Open).
- CCI Trend Filter: Applies CCI across period 50. Buys require CCI > 0; Sells require CCI < 0.
- CCI OB/OS Filter: Applies 14-period CCI boundaries. Buys require CCI > 100; Sells require CCI < -100.
- RVI Trend Filter: Utilizes Relative Vigor Index across 75 periods. Buys require RVI > 0; Sells require RVI < 0.
- RVI Signal Line Filter: Utilizes 20-period RVI cross. Longs require RVI main > signal; shorts require RVI main < signal.
- MACD Histogram Filter: Calculates MACD (12, 26, 9). Buys require positive histogram (Main - Signal > 0); Sells require negative histogram.
- MACD Zero Line Filter: Restricts buys to MACD Main > 0 and sells to MACD Main < 0.
- Support and Resistance Filter: Scans lookback window (default: 50 bars) for structural extremes within point zone (default: 80 points). Longs require testing support; shorts require testing resistance.
- ZigZag Fibonacci Filter: Scans swings via ZigZag (Depth: 12, Deviation: 5, Backstep: 3) to establish key Fibonacci levels (0.382 and 0.618). Trades are permitted exclusively when price action touches the defined Fibonacci zone.
4. COMPLETE INPUT PARAMETER MANUAL
Below is the exhaustive technical specification of all adjustable input parameters available in the indicator properties tab:
[DIVERGENCE SETTINGS]
- RSI_Period (Default: 8): Lookback period for primary RSI used for divergence calculation.
- RSI_Price (Default: PRICE_CLOSE): Applied price constant used for primary RSI calculation.
- Swing_Left (Default: 3): Number of bars to the left required to confirm a swing pivot.
- Swing_Right (Default: 3): Number of bars to the right required to confirm a swing pivot.
- Lookback (Default: 80): Maximum bars scanned backward from current pivot to identify comparative pivot.
- Show_Regular (Default: true): Enables detection and plotting of Regular Divergences.
- Show_Hidden (Default: true): Enables detection and plotting of Hidden Divergences.
- Show_Breakout (Default: true): Enables calculation and plotting of trendline breakout buy/sell signals.
- Draw_Trendline (Default: true): Draws graphical trendlines connecting divergence swing points.
- Alert_On (Default: true): Enables terminal pop-up alert dialog boxes upon signal bar closure.
- Sound_On (Default: true): Plays an audio file when a new signal is generated.
- Sound_File (Default: "alert.wav"): Audio filename located in the terminal Sounds directory.
- Push_On (Default: true): Sends push notifications to iOS and Android MT5 mobile terminals.
- Arrow_Offset (Default: 30): Vertical distance in points between candle extreme and plotted arrow.
[RSI CROSS FILTER]
- Use_RSI_Cross_Filter (Default: false): Toggles secondary RSI oversold/overbought crossover filter.
- RSI_Length (Default: 14): Lookback period of secondary crossover RSI.
- RSI_Price_Source (Default: PRICE_CLOSE): Applied price constant for secondary crossover RSI.
- Oversold (Default: 30.0): Numerical threshold below which market is defined as oversold.
- Overbought (Default: 70.0): Numerical threshold above which market is defined as overbought.
[ADX FILTER]
- Use_ADX_Filter (Default: false): Enables trend strength validation using ADX.
- ADX_Period (Default: 10): Lookback calculation period for ADX.
- ADX_Min_Level (Default: 20.0): Minimum baseline ADX value required to authorize signals.
[SINGLE MA FILTER]
- Use_MA_Filter (Default: false): Activates single moving average trend bias filtering.
- MA_Period (Default: 50): Number of bars incorporated in moving average smoothing.
- MA_Method (Default: MODE_SMA): Moving average averaging method (SMA, EMA, SMMA, LWMA).
- MA_Shift (Default: 0): Horizontal bar displacement applied to the moving average line.
[ICHIMOKU SENKOU SPAN B FILTER]
- Use_Ichimoku_Filter (Default: false): Enables equilibrium cloud filter using Senkou Span B.
- Ichimoku_SenkouB (Default: 52): Calculation period for Senkou Span B baseline.
- Ichimoku_Kijun (Default: 26): Calculation period and displacement setting for Kijun cycle.
[RSI 75 FILTER]
- Use_RSI75_Filter (Default: false): Toggles macro-trend directional filter via higher-period RSI.
- RSI_Filter_Period (Default: 75): Lookback cycle for macro RSI indicator.
[DOUBLE MA FILTER]
- Use_DoubleMA_Filter (Default: false): Activates dual moving average ribbon trend verification.
- MA_A_Period (Default: 30): Period of the fast moving average line.
- MA_A_Method (Default: MODE_EMA): Calculation formula for the fast moving average.
- MA_A_Applied (Default: PRICE_CLOSE): Applied price parameter for the fast moving average.
- MA_A_Shift (Default: 0): Bar shift displacement for the fast moving average.
- MA_B_Period (Default: 140): Period of the slow moving average baseline.
- MA_B_Method (Default: MODE_EMA): Calculation formula for the slow moving average.
- MA_B_Applied (Default: PRICE_CLOSE): Applied price parameter for the slow moving average.
- MA_B_Shift (Default: 0): Bar shift displacement for the slow moving average.
[AWESOME OSCILLATOR FILTER]
- Use_AO_Filter (Default: false): Master switch enabling Awesome Oscillator validation suite.
- Use_AO_Volume_Filter (Default: false): Filters signals based on minimum absolute AO histogram magnitude.
- AO_Buy_Min (Default: 4.0): Minimum positive AO threshold required for long signal confirmation.
- AO_Sell_Max (Default: -4.0): Maximum negative AO threshold required for short signal confirmation.
- Use_AO_Color_Filter (Default: false): Validates signals based on AO histogram directional bar slope.
- Use_AO_Zero_Filter (Default: false): Enforces AO above zero for buys and below zero for sells.
[PARABOLIC SAR FILTER]
- Use_SAR_Filter (Default: false): Activates trailing dynamic trendline filtering via Parabolic SAR.
- SAR_Step (Default: 0.02): Incremental price acceleration factor step.
- SAR_Maximum (Default: 0.2): Upper ceiling cap for Parabolic SAR acceleration factor.
[HEIKEN ASHI FILTER]
- Use_HeikenAshi_Filter (Default: false): Evaluates smoothed synthetic candle color alignment.
[CCI TREND FILTER]
- Use_CCI_Filter (Default: false): Activates CCI zero-line directional trend confirmation.
- CCI_Period (Default: 50): Lookback averaging period for trendline CCI calculations.
- CCI_Applied (Default: PRICE_CLOSE): Price base array used for trend CCI computation.
[CCI OB & OS FILTER]
- Use_CCI_OBOS_Filter (Default: false): Toggles aggressive momentum expansion filtering via extreme CCI.
- CCI_OBOS_Period (Default: 14): Calculation period for momentum breakout CCI.
- CCI_OBOS_Applied (Default: PRICE_CLOSE): Applied price parameter for momentum breakout CCI.
- CCI_Overbought (Default: 100.0): Upper momentum threshold required for buy authorizations.
- CCI_Oversold (Default: -100.0): Lower momentum threshold required for sell authorizations.
[RVI TREND FILTER]
- Use_RVI_Filter (Default: false): Enables long-period Relative Vigor Index zero-line trend verification.
- RVI_Period (Default: 75): Calculation period for macro RVI indicator.
[RVI SIGNAL FILTER]
- Use_RVI_Signal_Filter (Default: false): Activates RVI main line and signal line crossover filter.
- RVI_Signal_Period (Default: 20): Calculation period for reactive RVI oscillator pair.
[MACD SIGNAL FILTER]
- Use_MACD_Filter (Default: false): Enables MACD histogram momentum confirmation (Histogram > 0 Buy, < 0 Sell).
- MACD_FastEMA (Default: 12): Fast exponential moving average calculation period for MACD.
- MACD_SlowEMA (Default: 26): Slow exponential moving average calculation period for MACD.
- MACD_SignalSMA (Default: 9): Signal line smoothing simple moving average period for MACD.
- MACD_Applied (Default: PRICE_CLOSE): Applied price array used for MACD calculations.
[MACD LEV 0 FILTER]
- Use_MACD_Zero_Filter (Default: false): Restricts buy signals to MACD Main > 0 and sell signals to MACD Main < 0.
[SUPPORT & RESISTANCE FILTER]
- Use_SR_Filter (Default: false): Enables dynamic horizontal price reaction filtering based on extreme highs/lows.
- SR_Period (Default: 50): Number of bars scanned to establish support and resistance levels.
- SR_Zone_Points (Default: 80): Tolerance threshold band expressed in points around horizontal levels.
[FIBONACCI FILTER]
- Use_Fib_Filter (Default: false): Enables Fibonacci zone filtering based on ZigZag swing detection.
- Fib_Level_1 (Default: 0.382): First boundary ratio of target Fibonacci retracement zone.
- Fib_Level_2 (Default: 0.618): Second boundary ratio of target Fibonacci retracement zone.
- ZigZag_Depth (Default: 12): Minimum bar spacing required between identified swing extremes.
- ZigZag_Deviation (Default: 5): Minimum price displacement in points required to register a swing point.
- ZigZag_Backstep (Default: 3): Minimum consecutive bars required between consecutive swing reversals.
5. BUFFER ALLOCATION AND AUTOMATED INTEGRATION (FOR EA DEVELOPERS)
The indicator is structured for algorithmic execution and programmatic calling via native MQL5 iCustom function:
- Buffer 0 (BullDivBuffer): Plotted with Arrow 233, holds execution price for Bullish Divergences. Value equals EMPTY_VALUE when inactive.
- Buffer 1 (BearDivBuffer): Plotted with Arrow 234, holds execution price for Bearish Divergences. Value equals EMPTY_VALUE when inactive.
- Buffer 2 (BreakBuyBuffer): Plotted with Arrow 241, holds execution price for Breakout Buy signals. Value equals EMPTY_VALUE when inactive.
- Buffer 3 (BreakSellBuffer): Plotted with Arrow 242, holds execution price for Breakout Sell signals. Value equals EMPTY_VALUE when inactive.
- Buffer 4 (RSIBuffer): Internal calculation array storing computed RSI oscillator data across all historical bars.
- Buffer 5 (DummyBuffer): Reserved auxiliary calculation buffer.
6. OPERATIONAL WORKFLOW AND TRADING METHODOLOGIES
The indicator accommodates multiple technical trading approaches across varied market conditions:
- Classical Divergence Mean-Reversion: Traders seeking reversal entries monitor Regular Bullish and Regular Bearish divergence arrows. When a divergence arrow prints upon candle closure, traders verify that the setup aligns with higher-timeframe market structure or reactive key levels (such as Support/Resistance or Fibonacci retracement boundaries).
- Structural Breakout Confirmation Trading: Traders who prefer trading with confirmed price momentum rather than catching turning points can observe Breakout Buy and Breakout Sell arrows. A Breakout signal indicates that price action has successfully broken through the structural trendline connecting divergence swing points, confirming immediate order flow dominance in the direction of the breakout.
- Trend Continuation via Hidden Divergences: In established trending conditions, Hidden Divergences indicate healthy pullbacks where underlying momentum resets without breaking market structure. Combining Hidden Divergences with Double Moving Average (30 EMA above 140 EMA for longs) or Ichimoku Senkou Span B provides trend-following entries at discount pricing.
7. RECOMMENDED SPECIFICATIONS AND SETUP
- Supported Financial Instruments: Universally applicable across liquid instruments including Major and Minor Forex pairs, Gold (XAUUSD), Silver (XAGUSD), Crude Oil, Major Equity Indices (US30, NAS100, SPX500, GER40), and selected High-Liquidity Cryptocurrencies.
- Supported Timeframes: Functionally compatible across all standard MetaTrader 5 timeframes from M1 through Monthly. Optimal analytical reliability is observed on M15, M30, H1, H4, and D1 charts.
- Account Requirements: Operates identically on Hedging and Netting account architectures. Compatible with standard, Raw Spread, and ECN broker environments.
- Execution Environment: Designed with computational efficiency. The indicator only recalculates historical bars upon initialization or new bar creation, avoiding unnecessary CPU cycles and ensuring smooth terminal operation across multiple simultaneous charts.
8. RISK DISCLAIMER
Trading foreign exchange, indices, commodities, and digital assets carries a high level of risk and may not be suitable for all investors. The high degree of leverage available in financial markets can work against you as well as for you. Past technical performance, backtested results, or historical chart demonstrations do not guarantee future performance. This software is an analytical and operational indicator designed to assist traders in objective technical analysis and systematic signal identification; it does not offer financial advice or guaranteed trading profits. Always conduct thorough evaluations on a demo simulation account before applying this indicator to live capital accounts.