ReplayTrainer Chart Replay Practice
- Utilitaires
- Version: 4.53
- Mise à jour: 27 septembre 2026
- Activations: 10

ReplayTrainer turns your MT5 into a chart replay practice environment. Pick any date in your broker's history, hide the future, and trade it as if it were live — with your own indicators on the chart.
Why replay practice?
Scrolling back through a finished chart is not the same as trading it. When you already know what happens next, you are not training the decision. ReplayTrainer replays history candle by candle, or tick by tick, so every decision is made without hindsight.
Free-form replay
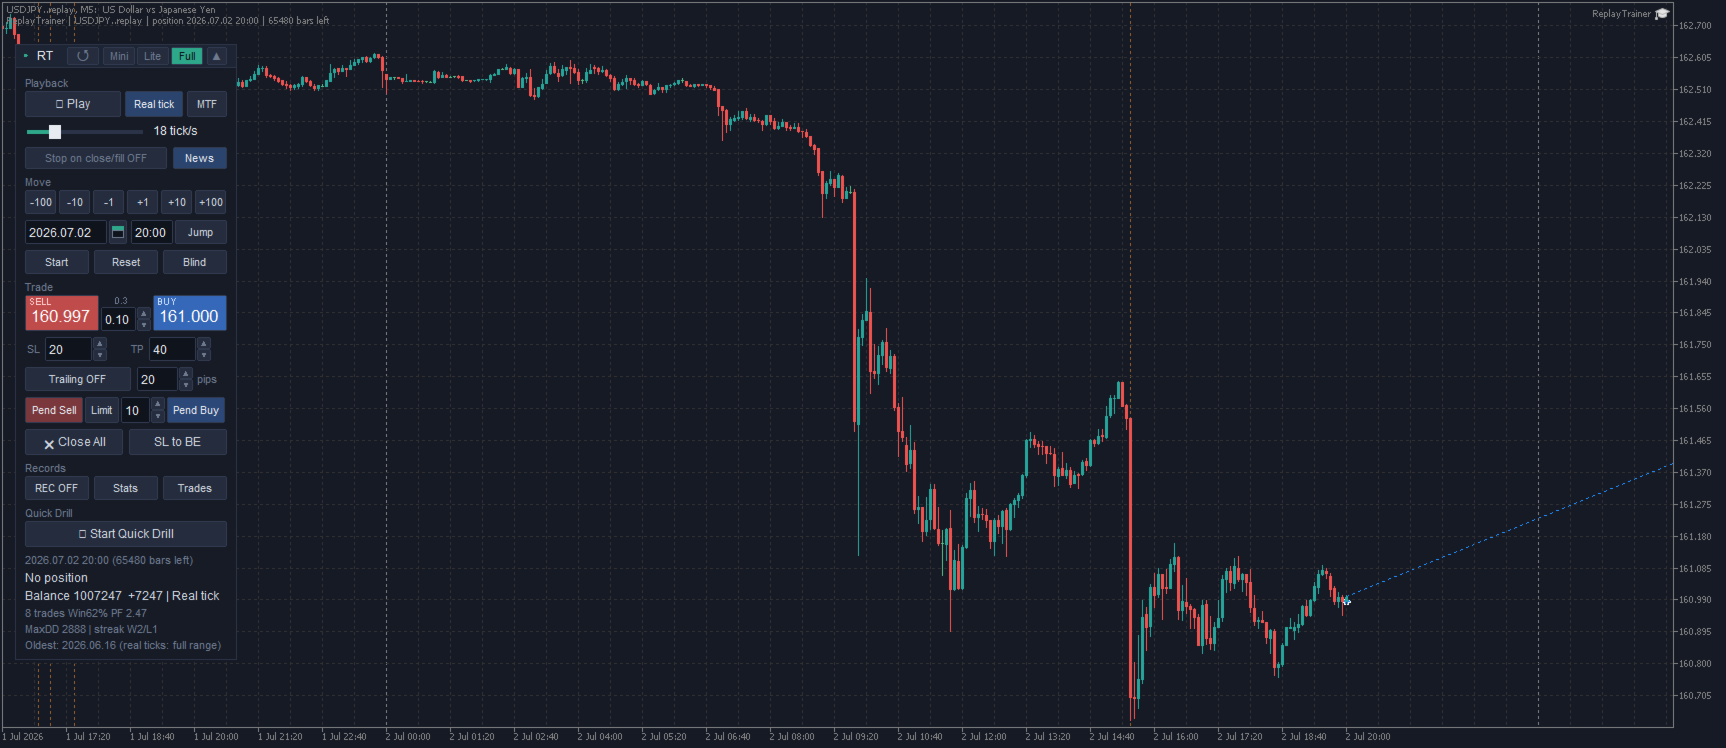
- Play / pause, adjustable speed (5 to 1000 ticks per second) and step moves of 1 / 10 / 100 bars
- Rewind freely — it does not use the Strategy Tester, so going back is always possible
- Jump to any date and time (calendar input)
- Real-tick playback — genuine ticks from your broker reproduce real spreads and fine price movement. Speed is defined in ticks per second, so the load on your PC stays constant on any symbol
- Refresh button — rebuilds the chart and tick state in place at any time, keeping long sessions stable
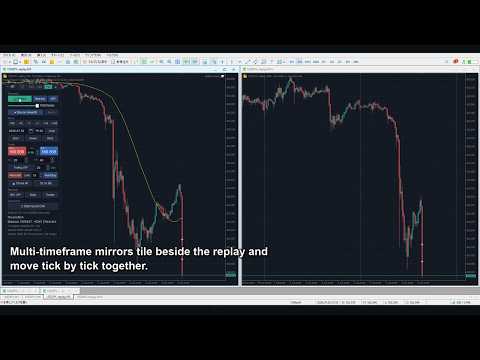
- Multi-timeframe mirror charts, fully synced with the replay
- Blind mode — warp to a random hidden date to remove memory bias
Your indicators work
The replay runs on a normal MT5 chart (a custom symbol named "yoursymbol.replay"). You can attach your own compiled indicators (ex5), templates and drawing tools, and they behave exactly as they would on a live chart. Future data does not exist on the replay chart, so indicators cannot peek ahead.
Virtual trading, realistic rules
- Market and pending orders (limit / stop), SL/TP lines you can drag, trailing stop, partial close, up to 50 positions with hedging
- Buys fill at Ask; SL/TP react to wicks; spread comes from real ticks
- Automatic lot sizing by fixed loss or percent of balance
- Positions, balance and your place in history are saved automatically — re-attach or restart MT5 and you continue where you left off
Quick Drill mode
The tool picks scenes with movement ahead and quizzes you: answer Sell / Buy / Pass, adjust your SL/TP lines, then fast-forward to the verdict in pips. A fast way to train entry decisions with dozens of repetitions per session.
Records and statistics
- Statistics panel with equity curve, win rate, profit factor, expectancy, max drawdown
- Optional CSV recording of every closed trade
- One-click HTML report with detailed metrics (Sharpe ratio, risk of ruin, results by weekday and session, and more)
Economic calendar built in
High-impact events are drawn on the replay chart, and playback can pause automatically just before each release — so you practice handling news the way you would live.
Important notes
- ReplayTrainer works on a normal chart only. It does not run in the Strategy Tester, therefore the free demo (which runs only in the tester) cannot demonstrate the product. A one-month rent option is available if you want to try it first.
- The replay range depends on the chart and tick history your broker provides.
- Heavy indicators on the replay chart are recalculated on every tick and can slow down or freeze fast playback. Lower the speed or remove them if that happens.
- All trading is virtual and processed inside the tool. No orders are ever sent to your account. It does not trade automatically and does not provide investment advice. Practice results do not guarantee future results in real trading.
Getting started
Attach ReplayTrainer to a chart of the symbol you want to practice on. A dedicated "symbol.replay" chart opens automatically within seconds — everything happens there. A detailed PDF guide with screenshots is provided in the comments section.