Trendline Breakout Trade Panel MT4

Trendline Breakout Trade Panel is an on-chart assistant for MetaTrader 4. It finds the trend lines for you, marks the breakouts worth acting on, and places and manages the order from a single click.

Most trend line tools do one half of that job. An indicator draws the lines and alerts you, then leaves the order to you. A semi-automatic expert waits for you to draw the line by hand before it will trade anything. This panel covers both ends, and you stay in control of whether a trade is taken at all.

Trading from the panel

Buy or sell at market, or place a limit order, from the panel buttons. Volume, stop distance and target are all derived from current ATR and your settings, so one click produces a proportionate order on a quiet symbol and on a volatile one without you recalculating anything.

After a confirmed breakout the limit price field fills itself with the retest level of the broken line, offset by a buffer you choose in ATR. Accept it, edit it, or ignore it.

Buttons can be set to fire the moment they are clicked rather than waiting for the next incoming tick.

Trade management

A break-even step moves the stop once open profit reaches a chosen percentage of the stop distance, and a trailing stop follows price from there. Both are on by default.

An optional Parabolic SAR stop manager can replace them. It arms only after profit reaches a set multiple of ATR, parks the stop a buffer beyond the SAR dot, ratchets in one direction only, and can close the position when the dot flips to the other side.

The SAR manager is off by default. In strategy tester runs it tended to end positions before break-even and trailing had a chance to work, because both were competing to control the same stop. If you want to use it, switch the two built-in managers off first.

Stop and target distances are checked against the broker minimum stop level before an order is sent, and modifications are checked against the broker freeze level, so the panel does not push requests the server will reject.

What it draws on the chart

Trend lines are selected by quality rather than drawn on every swing. A line is kept only when it has at least a set number of touches within a tolerance expressed in ATR, so lines that happen to graze two random wicks are discarded.

A breakout is marked only when the breaking candle body reaches a chosen multiple of ATR. Ordinary noise crossing a line does not get labelled a breakout.

Demand and supply zones are built from the size of the departure move away from the zone, with limits on zone height, on how many times a zone has already been tested, and on how many zones are shown per side.

Confirmation readout

A side panel reports three standard filters on the current timeframe and on a higher timeframe of your choosing: price against a 200-period EMA, RSI with separate buy and sell thresholds, and Parabolic SAR position. Values are shown raw as well as reduced to a direction, so the readout is useful whether or not you use those filters as gates.

A second section classifies the higher timeframe into impulse, pullback or range using a fast EMA and ADX.

Automated breakout engine

The panel includes an engine that can place a pending order on a confirmed breakout without any input from you. It is enabled by default so the product can be evaluated in the Strategy Tester.

Set Enable_Auto_Pending to false if you want a manual panel only.

When it is enabled, the engine places its order at the retest of the broken level rather than at a fixed distance from the post-breakout price, holds the order for a chosen number of bars so a pullback has time to happen, and can be gated by four independent filters: RSI, Parabolic SAR and EMA200 on H1, plus a proximity check that blocks an entry pointed straight into the nearest opposing level. The trigger can be switched from breakout to Parabolic SAR flip.

About seven in ten of those pending orders filled in one-year tester runs on EURUSD. The rest expired because price did not return to the level. Switching the engine to market entry captures those missed moves and produces roughly a third more trades, but it takes a worse price on every trade; in testing that cost more than the extra trades returned, which is why waiting for the retest is the default.

Statistics

Closed trades are recorded with their maximum adverse and maximum favourable excursion expressed in ATR, grouped by higher timeframe phase, and displayed on the panel.

The same records are appended to a CSV file inside the terminal's own Files folder. Nothing is transmitted anywhere, the file never leaves your computer, and the logging can be switched off.

Settings guidance

The notes below come from Every-tick strategy tester runs at 99.90 percent modelling quality, one year, 0.01 lot. They are historical test results, not records of live trading, and one year on one symbol is a small sample.

Volume must be adapted to the instrument. The stop is sized from ATR, and gold's ATR measured in account currency is roughly nine times that of a major currency pair: the same 0.01 lot produced an average loss per trade of 22.82 on XAUUSD against 2.46 on EURUSD, and a maximum drawdown of 25 percent against 2 percent. Start on EURUSD H1 and reduce volume before moving to gold.

If you trade with the trend rather than against it, consider turning break-even and trailing off. Break-even at 120 percent of the stop protects capital well in ranging conditions, but it lifts the stop before a trending move has finished. With both off, the ratio of average win to average loss rose from 1.08 to 1.69 and the share of trades that reached the full target rose from 17 percent to 38 percent, at the cost of a lower win rate. Which you prefer depends on whether you want fewer larger wins or more frequent smaller ones.

Parameters

Risk, stops and targets. Order volume and a hard ceiling on volume, entry offset and stop distance as multiples of ATR, target as a percentage of the stop distance, break-even trigger and locked profit, magic number, order comment.

Trend lines and breakouts. Show or hide lines and breakout markers, swing pivot strength, lookback bars, minimum touches, touch tolerance in ATR, breakout body size in ATR, breakout signal mode.

Demand and supply zones. Show or hide, minimum departure move, maximum zones per side, maximum prior touches, minimum zone height.

Notifications. On-screen alert, sound with a selectable file, push notification to your mobile terminal. All three are suppressed during testing.

Smart limit. Automatic fill of the limit price from the breakout retest level, and the retest buffer in ATR.

Breakout confirmations. Enable or disable the EMA200, RSI and Parabolic SAR filters independently, with their periods and thresholds, and choose the higher timeframe used for the readout.

Stop management. Parabolic SAR manager on or off, step and maximum, bar-close or tick updating, arming distance and stop buffer in ATR, close on flip, and master switches for the built-in trailing stop and break-even.

Auto pending. Master switch, trigger mode, entry as limit or market, limit distance or retest placement, retest buffer, long-candle handling, order lifetime in bars, the four H1 gates and the opposing-level proximity check.

Requirements

MetaTrader 4. Any symbol and any timeframe; the settings were developed on H1. An account that allows the order types you intend to use. No DLL, no external libraries, no internet access, and no custom indicators to install separately.

Trying it before you buy

The free version of any Market expert cannot run on a live chart, but it can run in the Strategy Tester, and this panel is fully interactive there.

  1. Download the free version.
  2. Open the Strategy Tester, select the panel, a symbol and H1.
  3. Tick Visual mode and start the test.
  4. Pause the visual chart. The panel appears and the buttons work.

A one-month rental is also available if you would rather try it on a live chart before committing to the unlimited version.

Notes

This is a tool for finding structure, placing orders and managing stops. It does not predict price and it makes no claim about future results. Any figures in this description or in the screenshots come from the Strategy Tester, not from live trading. Test any configuration on a demo account before using it with real money.

Questions and suggestions are welcome through the comments and the private message system on this site. Bug reports get fixed and released as updates.



Produits recommandés
Daily Candle Predictor est un indicateur qui prédit le cours de clôture d'une bougie. L'indicateur est principalement destiné à être utilisé sur les graphiques D1. Cet indicateur convient à la fois au trading forex traditionnel et au trading d'options binaires. L'indicateur peut être utilisé comme un système de trading autonome, ou il peut servir de complément à votre système de trading existant. Cet indicateur analyse la bougie actuelle, calcule certains facteurs de force à l'intérieur du corps
PZ Harmonacci Patterns
PZ TRADING SLU
3.17 (6)
Trade smarter, not harder: Empower your trading with Harmonacci Patterns This is arguably the most complete harmonic price formation auto-recognition indicator you can find for the MetaTrader Platform. It detects 19 different patterns, takes fibonacci projections as seriously as you do, displays the Potential Reversal Zone (PRZ) and finds suitable stop-loss and take-profit levels. [ Installation Guide | Update Guide | Troubleshooting | FAQ | All Products  ] It detects 19 different harmonic pric
"Impulses and Corrections 4" is created to help traders navigate the market situation. The indicator shows multi-time frame upward and downward "Impulses" of price movements. These impulses are the basis for determining the "Base" , which is composed of zones of corrections of price movements, as well as "Potential" zones for possible scenarios of price movement. Up and down impulses are determined based on a modified formula of Bill Williams' "Fractals" indicator. The last impulse is always "U
VR Cub
Vladimir Pastushak
VR Cub est un indicateur permettant d'obtenir des points d'entrée de haute qualité. L'indicateur a été développé pour faciliter les calculs mathématiques et simplifier la recherche de points d'entrée dans un poste. La stratégie de trading pour laquelle l'indicateur a été rédigé prouve son efficacité depuis de nombreuses années. La simplicité de la stratégie de trading est son grand avantage, qui permet même aux traders débutants de négocier avec succès avec elle. VR Cub calcule les points d'ouve
Trendiness Index
Libertas LLC
5 (3)
"The trend is your friend" is one of the best known sayings in investing, because capturing large trendy price movements can be extremely profitable. However, trading with the trend is often easier said than done, because many indicators are based on price reversals not trends. These aren't very effective at identifying trendy periods, or predicting whether trends will continue. We developed the Trendiness Index to help address this problem by indicating the strength and direction of price trend
Money Flow Profile MT5 HERE   Here   our more valuable tools SMC Trend Trading   ,  Easy SMC Trading  ,  Institutional SMC Architect Volume Analysis Tools  ,  Volume flow Profile  ,  Market volume profile  , FVG with Volume  , Liquidity Heatmap Profile  ,  Volume Spread Analysis This Master Edition is engineered for clarity and speed, featuring a unique Auto-Theme Sync system that instantly beautifies your chart layout upon loading. Key Features: True Money Flow Calculation: Goes beyond stand
Volume Profile Sniper v11. 1-un outil Complet pour l'analyse du marché Approche professionnelle du commerce Volume Profile Sniper V11.1 combine plus de 15 filtres clés dans un seul indicateur, fournissant des signaux clairs basés sur une évaluation complète de la situation du marché. Principales caractéristiques Analyse du déséquilibre volumétrique-l'algorithme calcule la proportion d'acheteurs et de vendeurs dans chaque bougie, signalant la prédominance de l'une des parties (seuil configurabl
The Th3Eng PipFinite indicator is based on a very excellent analysis of the right trend direction with perfect custom algorithms. It show the true direction and the best point to start trading. With StopLoss point and Three Take Profit points. Also it show the right pivot of the price and small points to order to replace the dynamic support and resistance channel, Which surrounds the price. And Finally it draws a very helpful Box on the left side on the chart includes (take profits and Stop loss
For sure, this indicator has become very popular amongst traders. Through coding this indicator will give you the most accurate levels possible for your trading analysis. We have also added in the ability for you to receive alerts when the price breaks above or below a Support or Resistance lines! HOW TO USE The red rectangles represent your resistance/supply zone. The green rectangles represent your support/demand zone.  BONUS FEATURES We coded this indicator with the ability to switch between
Fibonacci retracement and extension line drawing tool Fibonacci retracement and extended line drawing tool for MT4 platform is suitable for traders who use  golden section trading Advantages: There is no extra line, no too long line, and it is easy to observe and find trading opportunities Trial version: https://www.mql5.com/zh/market/product/35884 Main functions: 1. Multiple groups of Fibonacci turns can be drawn directly, and the relationship between important turning points can be seen
Awesome Oscillator by Bill Williams with the ability to fine-tune and replace the averaging algorithms of the indicator, which significantly expands the possibilities of using this oscillator in algorithmic trading and brings it closer in its properties to such an indicator as the MACD. To reduce price noise, the final indicator is processed with an additional Smooth averaging. The indicator has the ability to give alerts, send mail messages and push signals when the direction of movement of th
Blahtech Market Profile
Blahtech Limited
4.53 (15)
Was: $249  Now: $99   Market Profile defines a number of day types that can help the trader to determine market behaviour. A key feature is the Value Area, representing the range of price action where 70% of trading took place. Understanding the Value Area can give traders valuable insight into market direction and establish the higher odds trade. It is an excellent addition to any system you may be using. Blahtech Limited presents their Market Profile indicator for the MetaTrader community. Ins
Master Dot for MetaTrader 4 Detect Volatility Exhaustion Before the Market Returns to Balance Master Dot is a professional non-repainting indicator designed to detect moments when price moves beyond its statistically expected volatility range. These situations often occur during sharp market impulses, liquidity grabs or temporary emotional moves, when price departs from its normal trading conditions. Instead of following trends, Master Dot highlights volatility exhaustion — moments where the mar
Candlestick Pattern Scanner is a multi-timeframe and multi-symbol dashboard and alert system that checks all timeframes and currency pairs for different candlestick patterns that are formed in them. Scanner is integrated with support and resistance zones so you can check the candlestick patterns in the most important areas of the chart to find breakout and reversal patterns in the price chart. Download demo version   (works on M30,D1,W1 timeframes and 20 symbols of Market Watch window) Read the
This is the FXTraderariel-TakeProfit - Stop Loss Indicator . It provides you 3 potential Take Profits and 1 Stop Loss. These potential targets are computed based on several methods . The indicator can be used on every time frame, but we advise to use it on H1, H4 and D1. Especially if you are a novice trader. Pro Traders can also you use it for scalping in smaller time frames (M1, M5 and M15). This indicator is not a complete trading system. It doesn't provide you a Signal nor can predict the m
PZ Support Resistance
PZ TRADING SLU
3.33 (3)
Unlock key market insights with automated support and resistance lines Tired of plotting support and resistance lines? This is a multi-timeframe indicator that detects and plots supports and resistance lines in the chart with the same precision as a human eye would. As price levels are tested over time and its importance increases, the lines become thicker and darker, making price leves easy to glance and evaluate. [ Installation Guide | Update Guide | Troubleshooting | FAQ | All Products ] Boos
Line Magnit
Aleksey Trenin
The LineMagnit Indicator for MT4 is a highly precise tool that builds support and resistance levels which magnetically attract prices. This feature allows traders to easily determine the most probable entry and exit points in the market, as well as identify the market's directional forces, as levels are based on capital inflows into the instrument. Equipped with an intuitively understandable graphical interface, the LineMagnit Indicator enables users to quickly locate and analyze support and res
TradePilot
Hossein Khalil Alishir
TradePilot Expert Advisor (EA) for MetaTrader 4 TradePilot is a professional and user-friendly Expert Advisor (EA) for MetaTrader 4 (MT4) . It simplifies automated trading , risk management , and trade execution using a smart trading panel . Perfect for beginners and experienced traders looking for a reliable trade manager EA with automated lot size calculation . Key Advantages User-Friendly Trading Panel: Customizable panel with buttons and hotkeys. Smart Risk Management: Supports percen
"Auto FIBO Pro" Crypto_Forex indicator - est un excellent outil auxiliaire dans le trading ! - L'indicateur calcule et place automatiquement sur le graphique les niveaux de Fibo et les lignes de tendance locales (couleur rouge). - Les niveaux de Fibonacci indiquent les zones clés où le prix peut s'inverser. - Les niveaux les plus importants sont 23,6 %, 38,2 %, 50 % et 61,8 %. - Vous pouvez l'utiliser pour le scalping inversé ou pour le trading en grille de zones. - Il existe également de nombr
This indicator is a must have tool that scans the active chart for candlestick patterns. It labels each bar according the candlestick pattern(s) that it finds enabling you to more easily analyze price action and be more informed about your trading decision. There are 103 common and uncommon possible patterns plus 6 new patterns based on research that the indicator can identify. If a candlestick(s) meets the requirements for multiple patterns, the bar will be labeled with up to 4 patterns names f
RSI Speed mp
DMITRII GRIDASOV
Indicateur Crypto_Forex « RSI SPEED » pour MT4 : excellent outil prédictif, sans retouche. - Le calcul de cet indicateur est basé sur des équations physiques. Le RSI SPEED est la dérivée première du RSI lui-même. - Le RSI SPEED est idéal pour scalper les entrées dans la direction de la tendance principale. - Utilisez-le en combinaison avec un indicateur de tendance approprié, par exemple HTF MA (comme sur les images). - L'indicateur RSI SPEED indique la vitesse à laquelle le RSI change de dire
Intraday Levels shows intraday levels grid for intraday trading Shows a grid for the day levels, gives you a guide to know the trend and to measure intraday trades (stop-loss and take-profit). Parameters are: Levels Mode: Basic mode: Shows highest, lowest and middle levels. Advanced mode: Shows highest, lowest, middle and intermediate levels. Fibonacci mode: Shows session Fibonacci retracements levels. Momentum mode: Shows delayed Advanced levels to identify momentum. Smooth Period (Momentum m
Overview Harmonic Patterns MT4 is a technical analysis indicator designed for the MetaTrader 5 platform. It identifies and displays harmonic price patterns, such as Butterfly, Cypher, Crab, Bat, Shark, and Gartley, in both bullish and bearish directions. The indicator calculates key price levels, including entry, stop loss, and three take-profit levels, to assist traders in analyzing market movements. Visual elements and customizable alerts enhance usability on the chart. Features Detects six ha
Cosmic Diviner X Planet
Olena Kondratenko
4 (2)
This unique multi-currency strategy simultaneously determines the strength of trends and market entry points, visualizing this using histograms on the chart. The indicator is optimally adapted for trading on the timeframes М5, М15, М30, Н1. For the convenience of users, the indicator renders the entry point (in the form of an arrow), recommended take profit levels (TP1, TP2 with text labels) and the recommended Stop Loss level. The take profit levels (TP1, TP2) are automatically calculated for
Noize Absorption Index MT4
Ekaterina Saltykova
5 (1)
Noize Absorption Index - is the manual trading system that measures the difference of pressure between bears forces and bulls forces. Green line - is a noize free index that showing curent situation. Zero value of index shows totally choppy/flat market.Values above zero level shows how powerfull bullish wave is and values below zero measures bearish forces.Up arrow appears on bearish market when it's ready to reverse, dn arrow appears on weak bullish market, as a result of reverse expectation. S
Potential Reversal Price (PRP) Indicator - Ultimate Sniper Entries for XAUUSD Discounted   Price   !!     Secure your lifetime access   now   before it switches to   subscription-only ! Welcome to the   Potential Reversal Price (PRP) Indicator , your ultimate trading tool designed to catch high-probability market reversals with extreme precision. Built for serious traders who demand accuracy, the PRP Indicator combines advanced market structure analysis with momentum exhaustion to pinpoint the e
No Skam
Abdulkarim Karazon
Indicateur de flèche NO SKAM L’indicateur de flèche NO SKAM est un indicateur de trading auto-optimisé conçu pour ajuster automatiquement sa génération de signal et ses niveaux TP/SL en fonction de vos objectifs de performance. Au lieu de tester manuellement des centaines de combinaisons de paramètres, l’indicateur recherche des réglages correspondant le mieux à vos objectifs d’optimisation, tels que : Taux de victoire minimum Série maximale de défaites Nombre minimum de transactions Bénéfice
Le WaveTrend Oscillator MT4 est un puissant indicateur de trading conçu pour améliorer votre analyse de marché en identifiant les changements de momentum et les potentielles inversions de tendance. Idéal pour les traders de tous niveaux, cet outil offre des informations précieuses sur les conditions de surachat et de survente sur divers marchés, y compris forex, les cryptomonnaies et les matières premières. Avec sa capacité à générer des signaux d'achat et de vente précis, le WaveTrend Oscillato
FreqoMaster
Stanislav Korotky
The main idea of this indicator is rates analysis and prediction by Fourier transform. The indicator decomposes exchange rates into main harmonics and calculates their product in future. The indicator shows 2 price marks in history, depicting price range in the past, and 2 price marks in future with price movement forecast. Buy or sell decision and take profit size are displayed in a text label in the indicator window. The indicator uses another indicator as an engine for calculations - FreqoMet
The Trendline Trade Panel was created to make it easier to train forex trading skills in backtester and at the same time make it easier to live trade using trendlines with the push of a button. This ea is perfect for beginners who want to learn to trade manually because all of its features are equipped with basic tools for trading forex. Other uses for Trendline Trade Panel: + Can be used to perform recovering loss positions made by other EA or positions that open manually. Fill in magic number
Les acheteurs de ce produit ont également acheté
Strategy Builder offers an incredible amount of functionality. It combines a trade panel with configurable automation (covert indicators into an EA), real-time statistics (profit & draw down) plus automatic optimization of SL, TP/exit, trading hours, indicator inputs. Multiple indicators can be combined into an single alert/trade signal and can include custom indicators, even if just have ex4 file or purchased from Market. The system is easily configured via a CONFIG button and associated pop-up
The product will copy all telegram signal to MT4   ( which you are member  ) , also it can work as remote copier.  Easy to set up, copy order instant, can work with almost signal formats, image signal, s upport to translate other language to English Work with all type of channel or group, even channel have "Restrict Saving Content", work with  multi channel, multi MT5 Work as remote copier: with signal have ticket number, it will copy exactly via ticket number. Support to backtest signal. How to
Custom Alerts AIO : Surveillez tous les marchés à la fois — sans aucune configuration Présentation Custom Alerts AIO est une solution de surveillance du marché prête à l’emploi, sans configuration nécessaire. Tous les indicateurs requis — FX Power, FX Volume, FX Dynamic, FX Levels, IX Power — sont directement intégrés. Aucun graphique n’est affiché, ce qui rend cet outil idéal pour la génération d’alertes en temps réel. Il prend en charge toutes les classes d’actifs proposées par votre courtie
EasyInsight AIO MT4
Alain Verleyen
4 (2)
EASY Insight AIO – La solution tout-en-un pour un trading intelligent et sans effort Présentation Imaginez pouvoir analyser l’ensemble du marché — Forex, Or, Crypto, Indices et même Actions — en quelques secondes, sans aucune analyse manuelle de graphiques, sans installation complexe ni configuration d’indicateurs. EASY Insight AIO est votre outil d’exportation ultime, prêt à l’emploi, pour un trading alimenté par l’IA. Il fournit une vue d’ensemble du marché dans un fichier CSV propre — prêt
Unlimited Trade Copier Pro is a tool to copy trade remotely to multiple MT4, MT5 and cTrader accounts at different computers/locations over internet. This is an ideal solution for you if you are a signal provider and want to copy your trades to other receivers globally on your own rules. One provider can copy trades to multiple receivers and one receiver can get trade from multiple providers as well. The provider can even set the subscription expiry for each receiver, so that receiver will not b
ManHedger MT4
Peter Mueller
5 (2)
THIS EA IS A SEMI-AUTO EA, IT NEEDS USER INPUT. Manual & Test Version Please TEST this product before   BUYING  and watch my video about it. Contact me for user support or bug reports, or if you want the MT5 version! MT5 Version I do not guarantee any profits or financial success using this EA. With this Expert Advisor, you can: Implement your own   Zone Recovery   strategy to capitalize on trending markets. Create   Grid   trading strategies, to profit from ranging markets. Place orders easil
Crystal Trade Manager PRO – Système Avancé de Gestion du Risque et de Contrôle des Positions pour MT4 Version gratuite : https://www.mql5.com/en/market/product/150632 Présentation Générale Crystal Trade Manager PRO (CTM) est un utilitaire professionnel pour MetaTrader 4 dédié à la gestion du risque, au contrôle des opérations et à l’automatisation intelligente du trading. Il a été conçu pour les traders qui exigent une exécution disciplinée, une protection solide du capital et un contrôle avancé
The product will copy all  Discord  signal   to MT4   ( which you are member  ) , also it can work as remote copier.  Easy to set up. Work with almost signal formats, support to translate other language to English Work with multi channel, multi MT4. Work with Image signal. Copy order instant, auto detect symbol. Work as remote copier: with signal have ticket number, it will copy exactly via ticket number. How to setup and guide: Let read all details about setup and download Discord To MetaTrader
Dashboard Trade Manager
Moegamat Luqmaan Titus
Dashboard.mq4 - Gestionnaire de Trading Simple Conçu pour ceux qui apprécient le trading manuel et souhaitent quelque chose pour rendre la gestion des trades plus simple, cet utilitaire MQL4 robuste améliore l'efficacité du trading en fournissant un tableau de bord en temps réel pour gérer vos trades. Il s'intègre parfaitement dans MetaTrader, calcule la taille des lots et suit les métriques de risque sans effort. Principales fonctionnalités : Affichage du Risque et de la Marge : Calcul en temps
The FFx Hidden Manager panel will help you to manage easily your orders directly on the chart. Below all features described: TP, SL and TrailingStop are hidden Each order has its own lines on chart Drag & Drop any line to change the TP/SL as per your need Option to move automatically the SL line at breakeven when TP #1 is reached Option to choose the TP/SL type (by pips or price) Option to choose the TrailingStop type (by pips, MA, Fractals, PSAR or ATR) Define which order(s) you want to manage
FFx Risk Calculator panel will help you to calculate very easily your trades size, SL or the risk directly on the chart. All features are described below: Option to select which parameter to calculate: Risk, Stop Loss or Lot Size The panel will show if the lot size is allowed according to the current account free margin Button to maximize/minimize the panel Drag and Drop the panel anywhere on the chart How to use it? Select the parameter you want to be calculated. It will be based on the 2 other
News Trader Pro
Vu Trung Kien
4.38 (16)
News Trader Pro is a unique robot that allows you to trade the news by your predefined strategy. It loads every piece of news from several popular Forex websites. You can choose any news and preset the strategy to trade it, and then News Trader Pro will trade that news by selected strategy automatically when the news comes. News release gives opportunity to have pips since the price usually has big move at that time. Now, with this tool, trading news becomes easier, more flexible and more exciti

FFx Watcher PRO
Eric Venturi-Bloxs
The FFx Watcher PRO is a dashboard displaying on a single chart the current direction of up to 15 standard indicators and up to 9 timeframes. It has 2 different modes: 1. Watcher mode: Multi Indicators User is able to select up to 15 indicators to be displayed User is able to select up to 9 timeframes to be displayed 2. Watcher mode: Multi Pairs User is able to select any number of pairs/symbols User is able to select up to 9 timeframes to be displayed This mode uses one of the standard indicat

The product combines a manual trade panel with the ability to perform actions automatically in a highly configurable way. Actions include capturing indicator values and then based on those values raising alerts, open/close or partially close trades, scale-in, setting up pending orders, adjusting stop loss, take profit and more. On-chart controls can be configured, such as tick boxes and buttons, so can be fully interactive. The EA also handles money management, news events, hidden stop loss, tak
The Price Action Dashboard is an innovative tool to help the trader to control a large number of financial instruments. This tool is designed to automatically suggest signals and price conditions. The Dashboard analyzes all major Time Frame suggesting price action conditions with graphic elements. The Dashboard can suggest you the strength of the trend identifying directional movement, it is an indispensable tool for those who want to open position themselves using market trends identifiers. The
Elliott Wave Counter est un panneau pour le balisage manuel rapide et convivial des vagues d'Elliott. On peut sélectionner une couleur et un niveau de marques. Il existe également des fonctions pour supprimer le dernier balisage et tout le balisage effectué par l'outil. Le balisage se fait en un clic. Cliquez cinq fois - ayez cinq vagues ! Elliott Wave Counter sera un excellent instrument à la fois pour les débutants et les analystes professionnels des vagues d'Elliott. Guide d'installation et d
If you wish to draw Support and Resistance lines, view: daily market opening, classical pivot levels, Fibonacci pivot levels, trend lines, Fibonacci levels, the remaining time to candle closing, and current spread. If you seek to place your orders with the exact lot that meets your desired stop loss risk. If you wish to do all this and more with just one click, then this is the perfect tool to use. This tool will allow you to feel more relaxed when deciding to open orders, as well as predicting
Partial Close Expert   est un outil qui combine de nombreuses fonctionnalités en un seul système automatisé. Cet EA peut aider les traders à gérer leurs positions plus efficacement en offrant de multiples options pour gérer les risques et maximiser les gains potentiels. Avec Partial Close Expert, les traders peuvent définir une       fermeture partielle       niveau pour verrouiller les bénéfices, un       stop suiveur       niveau pour protéger les profits et limiter les pertes, un       seuil
Master Trend Dashboard is a new generation indicator, compact, light and efficient. Each element of this Dashboard is designed to return specific signals as: Price Action, Breakout, Net Change (performance of the instrument), algorithmic studies, correlations and statistical calculations. This tool will change your way of trading allowing you to receive important information. See the Graphic Signals to understand every single signal below: Graphic Signals Symbol name and arrow color Green = Cur
Trade Copier Agent est conçu pour copier des transactions entre plusieurs comptes/terminaux MetaTrader(4/5). Avec cet outil, vous pouvez agir en tant que fournisseur (source) ou récepteur (destination). Toutes les actions de trading seront copiées du fournisseur vers le récepteur sans délai. Cet outil vous permet de copier des transactions entre plusieurs terminaux MetaTrader sur le même ordinateur avec des vitesses de copie ultra-rapides inférieures à 0,5 seconde. Guide d'installation et d'ent
Unlimited Binary Options Copier Remote is a powerful tool to copy binary options trades remotely between multiple accounts at different locations over internet. This is an ideal solution for signal provider, who want to share his binary options trades with the others globally on his own rules. One provider can copy trades to unlimited receivers and one receiver can get trade from unlimited providers as well. The provider can set the subscription expiry for each receiver, so that receiver will no
This is an Expert Adviser use for manual trading as a background EA or combine with external EA to open orders. Loss Recovery Trading is one of your options to handle the lose positions instead of using stop loss by setting a zone recovery area and target to exit the turn rounds sequence. How It Work? If the market goes against your first positions direction at the specific of losing points, the EA will open an opposite direction position with calculated larger lot size and also keep the first
Market Pressure Dashboard is a new generation utility. Its main function is to assist you and give you operational ideas optimizing your analytical work. Using this utility you could monitor a lots of financial instruments (max 28 symbols FOREX) in a very simple way. The Market Pressure indicator allows you to customize the internal list of the symbols to be monitored. The opening function and position management with this panel will be much more comfortable and navigation charts very powerful.
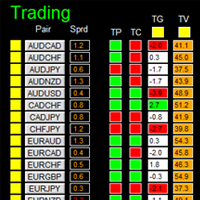
Contact/message me if you encounter any issue using the product or need extra feature to add on the base version. There is a demo version of this panel Dashboard Trading Made Simple Demo in my product list, please try it out to get familiar with all functionalities free, LINK . This system basically utilizes TDI as the main indicator to generate trading signal mainly on H1 and H4 timeframes. The signal will be further filtered and trimmed. Stochastic; Heiken Ashi candle direction and candle siz
Telegram Publisher Agent   est un module complémentaire qui permet aux commerçants d'envoyer des signaux à leurs canaux et groupes Telegram en temps réel. Avec des messages personnalisables, des captures d'écran de graphiques et d'autres fonctionnalités, l'outil aide les traders à partager leurs idées et stratégies de trading avec leurs abonnés. L'outil présente également un beau design avec un commutateur de thème clair et sombre, offrant aux utilisateurs une expérience de trading esthétique et
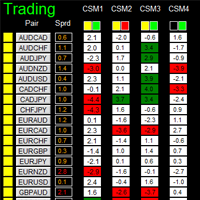
如果产品有任何问题或者您需要在此产品上添加功能,请联系我 Contact/message me if you encounter any issue using the product or need extra feature to add on the base version. There is a Demo version of this panel Dashboard Currency Strength Meter AdvancedDemo in my product list, please try it out to get familiar with all functionalities free, LINK . The Dashboard Currency Strength Meter Advanced gives you a quick visual guide to which currencies are strong, and which ones are weak over the customized 4 time-frames and period.
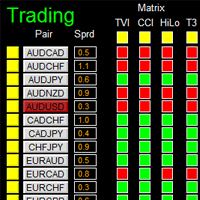
如果产品有任何问题或者您需要在此产品上添加功能,请联系我 Contact/message me if you encounter any issue using the product or need extra feature to add on the base version. There is Demo version of this panel Dashboard Genesis Matrix Trading Demo in my product list, please try it out to get familiar with all functionalities free, LINK . This system basically utilizes Genesis Indi Set (TVI, CCI, GannHilo, and T3) as the core indicators to generate trading signal mainly on time-frame M15. The signal will be further filtered a
如果产品有任何问题或者您需要在此产品上添加功能,请联系我 Contact/message me if you encounter any issue using the product or need extra feature to add on the base version. There is Demo version of this panel Dashboard Symphonie Trader System Demo in my product list, please try it out to get familiar with all functionalities free, LINK . This system basically utilizes Symphonie Indicator Set (Extreme, Emotion, Trend, and Sentiment) as the core indicators to generate trading signal mainly on time-frame M15. The signal will b
如果产品有任何问题或者您需要在此产品上添加功能,请联系我 Contact/message me if you encounter any issue using the product or need extra feature to add on the base version. There is Demo version of this panel Dashboard Babon Scalping System Demo in my product list, please try it out to get familiar with all functionalities for free, LINK . This system basically utilizes TDI, Heiken Ashi Trend, Price Trend on H1 time-frame and TMA on H1&H4 time-frame to generate the trend (big picture). Then the system will zoom in to genera
Pairs Trade
Oleg Pechenezhskiy
The Pairs Trade indicator is a utility for semi-automatic pair trading. It allows combining the charts of two arbitrary instruments, even if the schedules of their trading sessions are different. It displays a spread chart in the form of a histogram with an overlaying moving average. It calculates the swap that will be charged for the synthetic position (in the deposit currency). It is possible to set a level for automatic opening of a synthetic position on the spread chart (analogous to the 'se
Filtrer:
Aucun avis
Répondre à l'avis