VSA Cvd Histogram
- Indicateurs
-
Thanh Tuan Nguyen
 I'm an independent trader and developer passionate about Price Action, Wyckoff, and Volume Spread Analysis (VSA).
I build practical trading tools to simplify chart analysis and support better trading decisions. - Version: 1.0
- Activations: 5
VSA CVD Histogram (Cumulative Volume Delta)
Price Doesn't Move Because of Candle Patterns. It Moves Because of Order Imbalance.
Have you ever entered a trade based on a Pin Bar, Marubozu, Engulfing, or another price action pattern... only to be stopped out a few candles later?
The candle looked bullish.
The setup looked perfect.
Yet the market moved in the opposite direction.
The reason is simple.
Price does not move because of the shape of a candle.
It moves because buying pressure and selling pressure become imbalanced inside the candle while it is forming.
Traditional price action only shows you the final result.
It cannot reveal which side was actually gaining control beneath the surface.
That is where CVD (Cumulative Volume Delta) becomes valuable.
CVD measures the balance between buying pressure and selling pressure inside every candle, helping you identify which side is gradually taking control before it becomes obvious on the chart.
That is exactly why I developed VSA CVD Histogram.
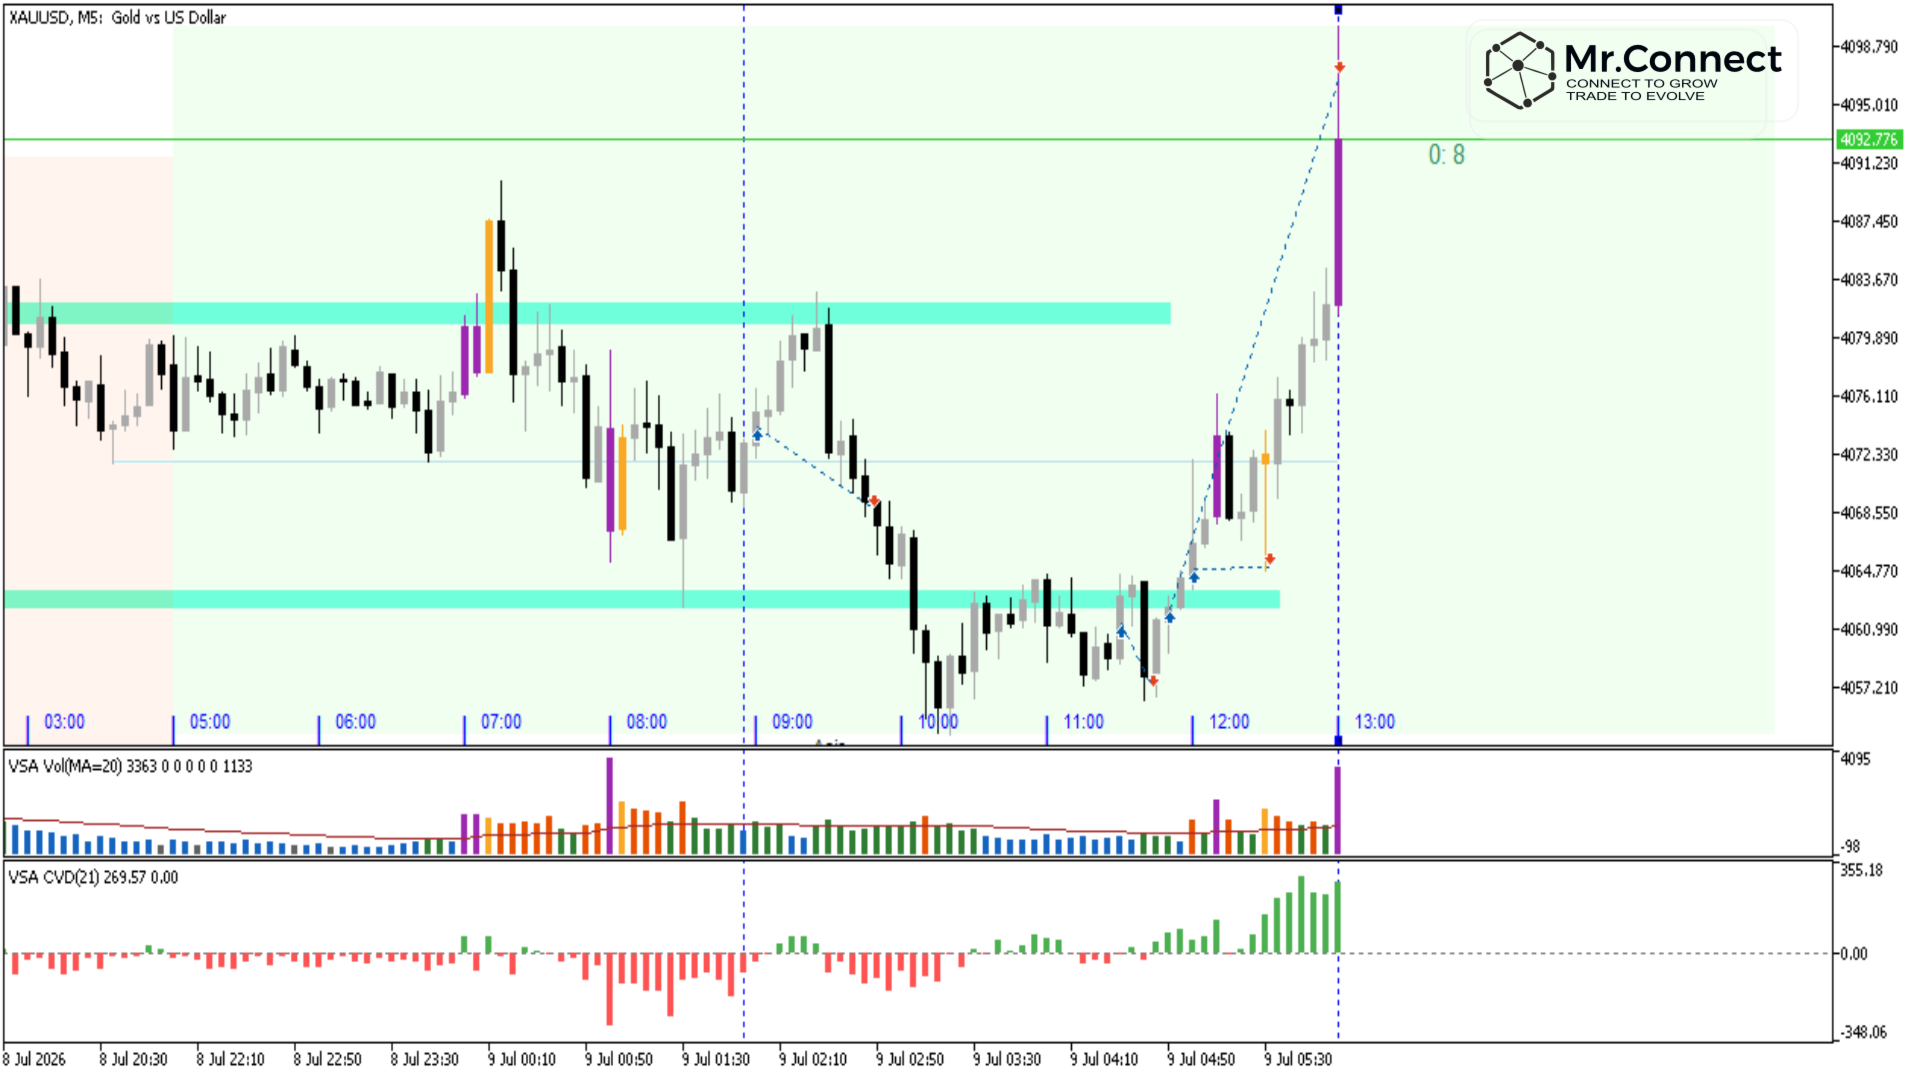
VSA CVD Histogram estimates Market Bias by comparing buying pressure and selling pressure on every candle.
Instead of relying on price alone, you gain another layer of confirmation that reveals whether buyers or sellers are gradually taking control while the candle is still forming.
The indicator estimates buying and selling pressure using Tick Volume together with the candle's closing position within its trading range.
Formula
Buying Pressure = Volume × (Close − Low) ÷ (High − Low)
Selling Pressure = Volume × (High − Close) ÷ (High − Low)
Histogram = EMA(Buying Pressure − Selling Pressure)
- Green Histogram = Bullish Bias is strengthening.
- Red Histogram = Bearish Bias is strengthening.
Input
- EMA Period (Default: 21)
EMA 21 is applied internally to smooth the Histogram, reducing market noise while preserving meaningful changes in Market Bias.
How I Use It
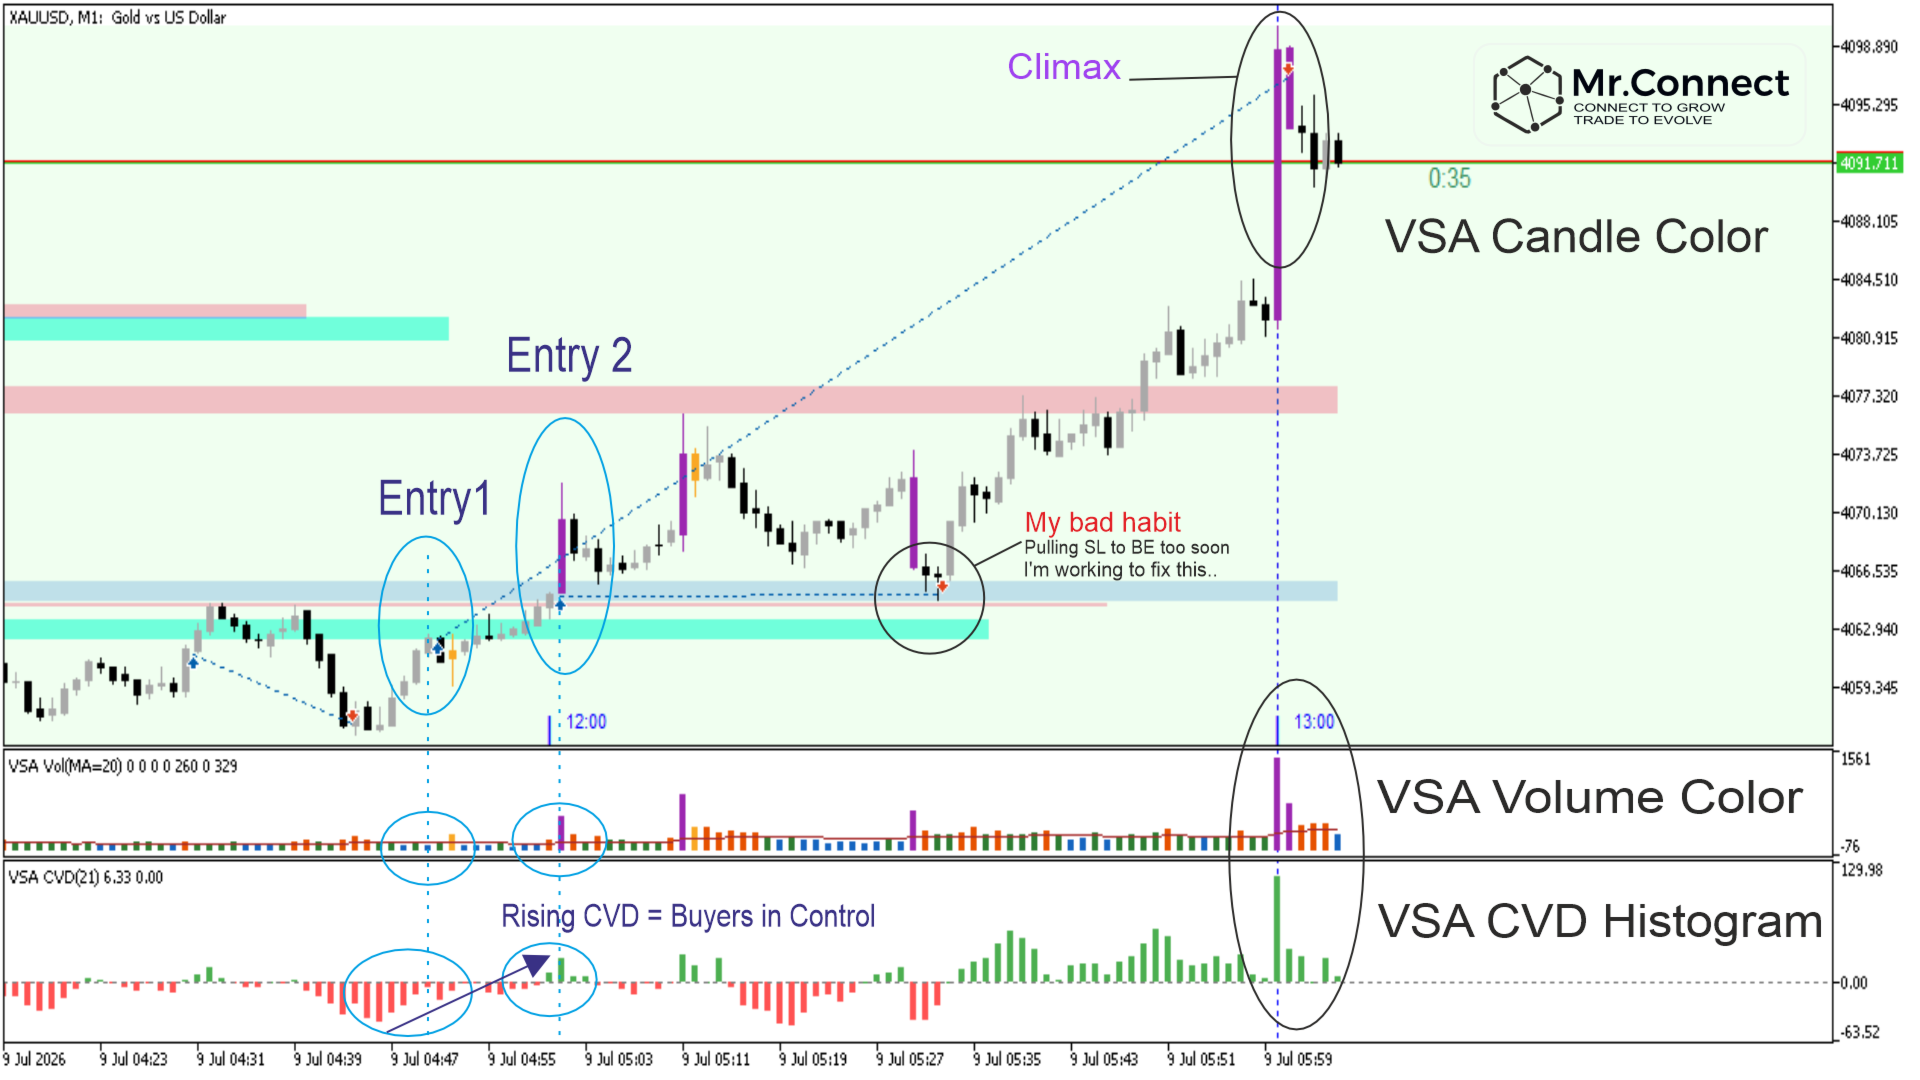
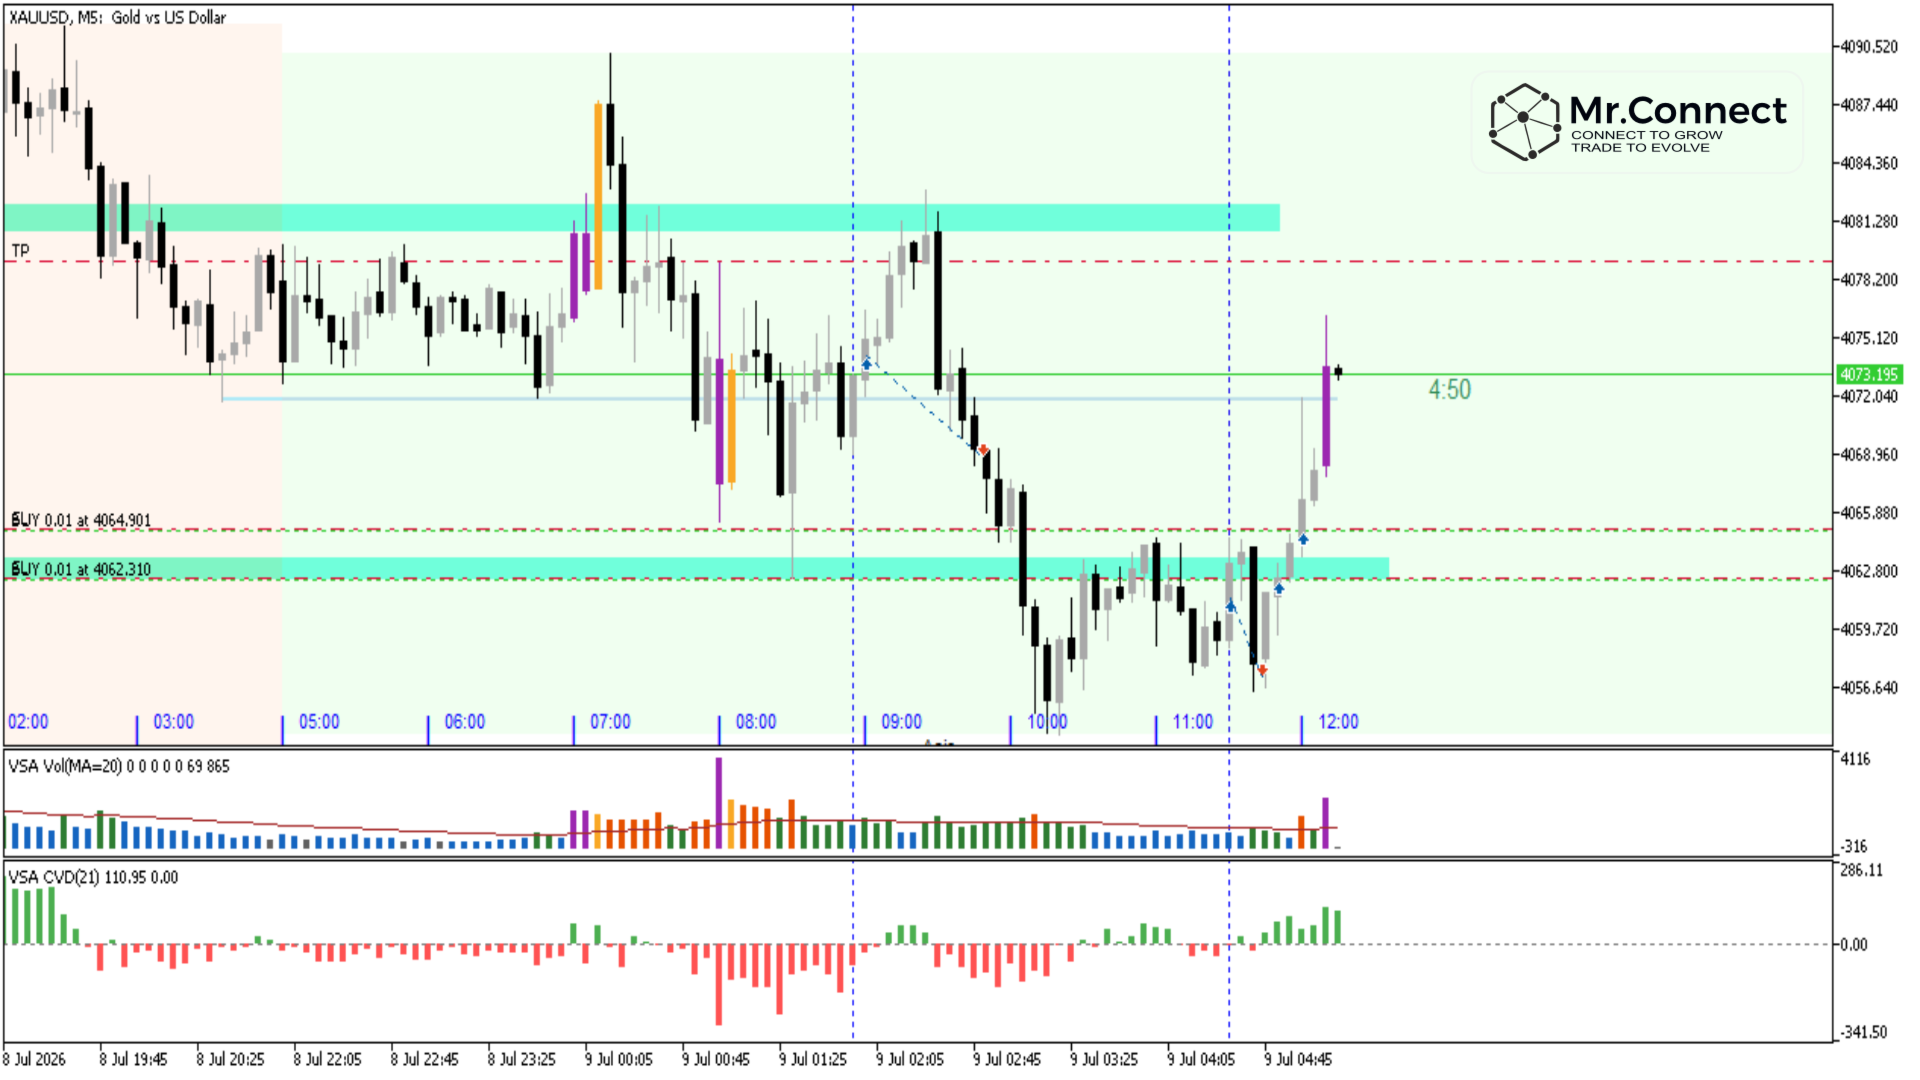
When price and the Histogram confirm the same direction, I have greater confidence to manage an existing position or prepare for the next trading opportunity.
When I first began using CVD, I simply looked at whether the Histogram was green or red to decide which side had the advantage.
After spending countless hours studying charts, I realized the color itself wasn't the most valuable information.
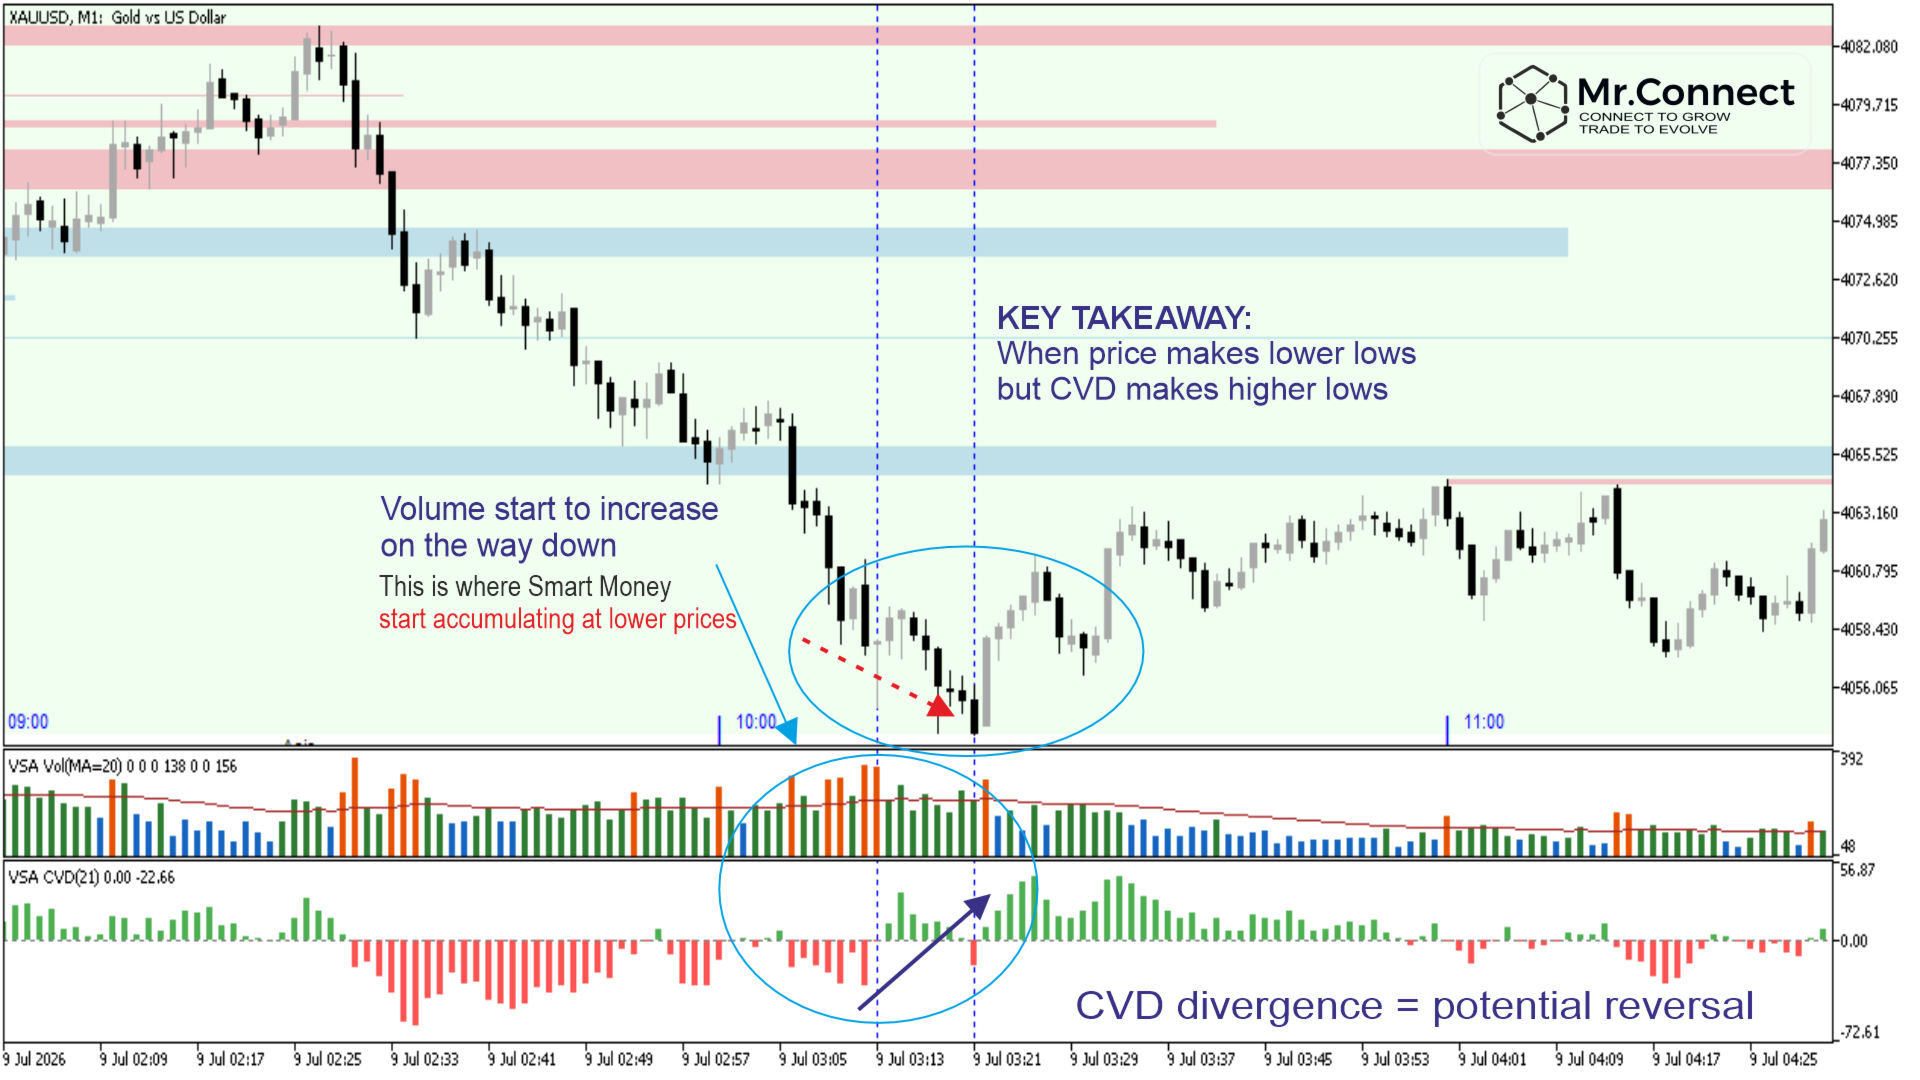
What I pay the closest attention to is the slope of the CVD.
When the slope begins to change and Volume confirms the move, it often reveals that buying or selling pressure is changing as well. That gives me a clearer picture of which side is gradually gaining control of the market, helping me prepare for higher-quality trading opportunities.
Who Is It For?
- VSA Traders
- Wyckoff Traders
- Smart Money Traders
- Intraday Traders
- MT5 Scalpers
- Estimate Market Bias in real time.
- Add another layer of trend confirmation.
- Detect momentum shifts earlier.
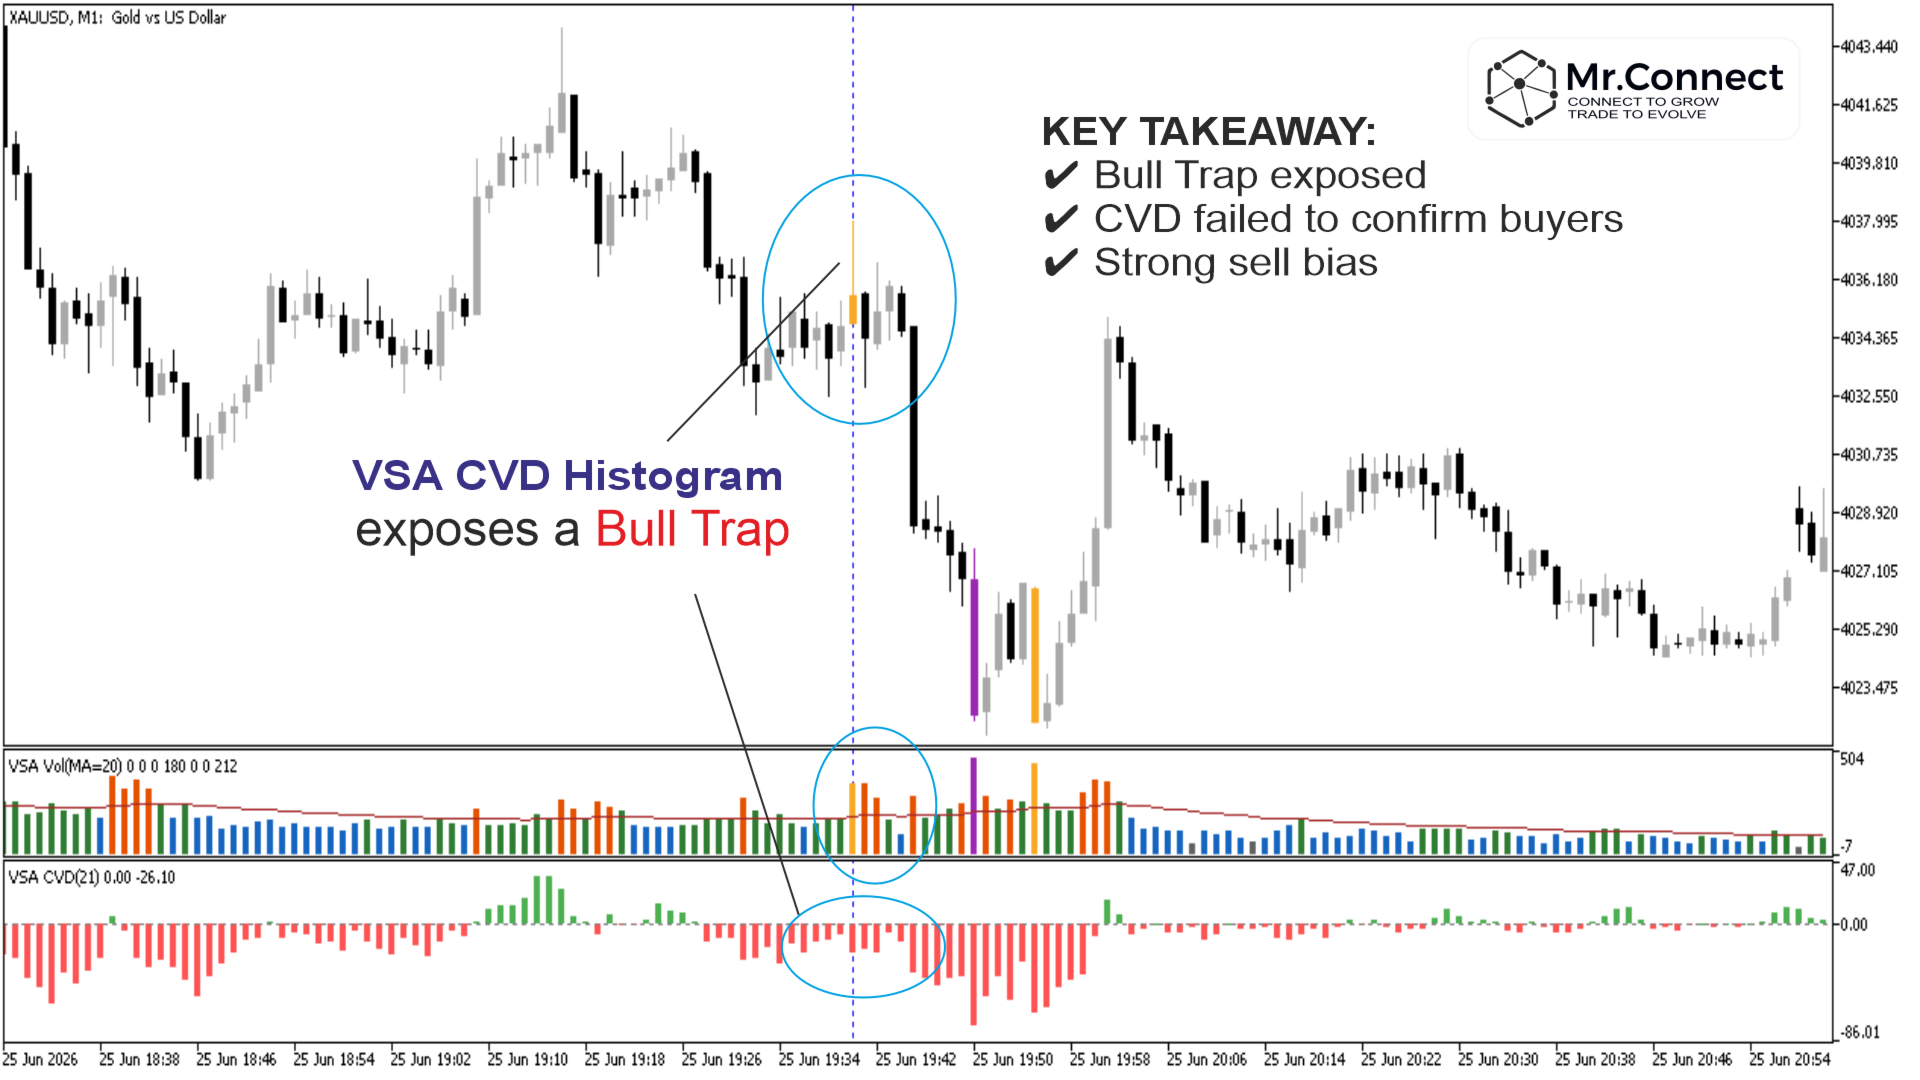
- Help identify Bull Traps, Bear Traps and False Breakouts.
- Improve entry and exit timing.
- Works seamlessly with VSA Candle Color and VSA Volume Color as part of the MR.CONNECT VSA Series.
VSA CVD Histogram does not replace the trader.
If every green Histogram meant Buy, and every red Histogram meant Sell, a trading robot could do the job without human involvement.
Successful trading still depends on market structure, liquidity, timing, probability and risk management.
VSA CVD Histogram contributes one important piece of information: how Market Bias is evolving while price is moving.
The final trading decision is always yours.
A Few Words from Me
The deeper I studied VSA and Wyckoff, the more I realized the market is far less random than it first appeared.
- Bull Traps, Bear Traps, and Stop Hunts—all forms of Liquidity Sweeps.
- Moments when CVD strengthens together with rising Volume, revealing that buying or selling pressure is quietly building before a new move becomes obvious.
Those subtle clues help me prepare for higher-quality trading opportunities and often allow me to move my stop loss to Break Even much earlier.
I like playing a FREE GAME.
Maybe that's one of my trading habits.
Once my Stop Loss is at Break Even, I feel much more comfortable letting the market do its work.
On XAUUSD, liquidity sweeps are common. Price can revisit almost any level before continuing the move.
I'd rather get stopped at Break Even than watch a winning trade turn into a loser.
When all of these pieces begin to connect, the market starts to make much more sense.
That is why I built the VSA Indicator Series for MT5.
Using VSA Candle Color, VSA Volume Color, and VSA CVD Histogram together allows me to read Price, Volume, and Market Bias as one complete picture instead of three separate signals.
Trading has become much more enjoyable because I spend less time guessing and more time understanding why price is moving and what is happening behind each candle.
I hope these indicators help you discover a new perspective on the market.
MR.CONNECT
Connect to Grow. Trade to Evolve.