ADX ClrDynamic Pro

ADX ClrDynamicPro Plus III

Multi-Timeframe Trend, Momentum & Divergence Command Center

Tired of lagging indicators that signal a trend only after the move is over? ADX ClrDynamicPro Plus III is a complete decision engine for trend, momentum, and reversal traders. By combining customizable smoothing algorithms (EMA, SMA, Wilder, or optional Hull Acceleration) with multi-timeframe (HTF) confirmation, institutional divergence detection, and an embedded subwindow dashboard, this tool delivers clear, actionable market diagnostics without cluttering your main price chart.

What Sets ADX ClrDynamicPro Plus III Apart?

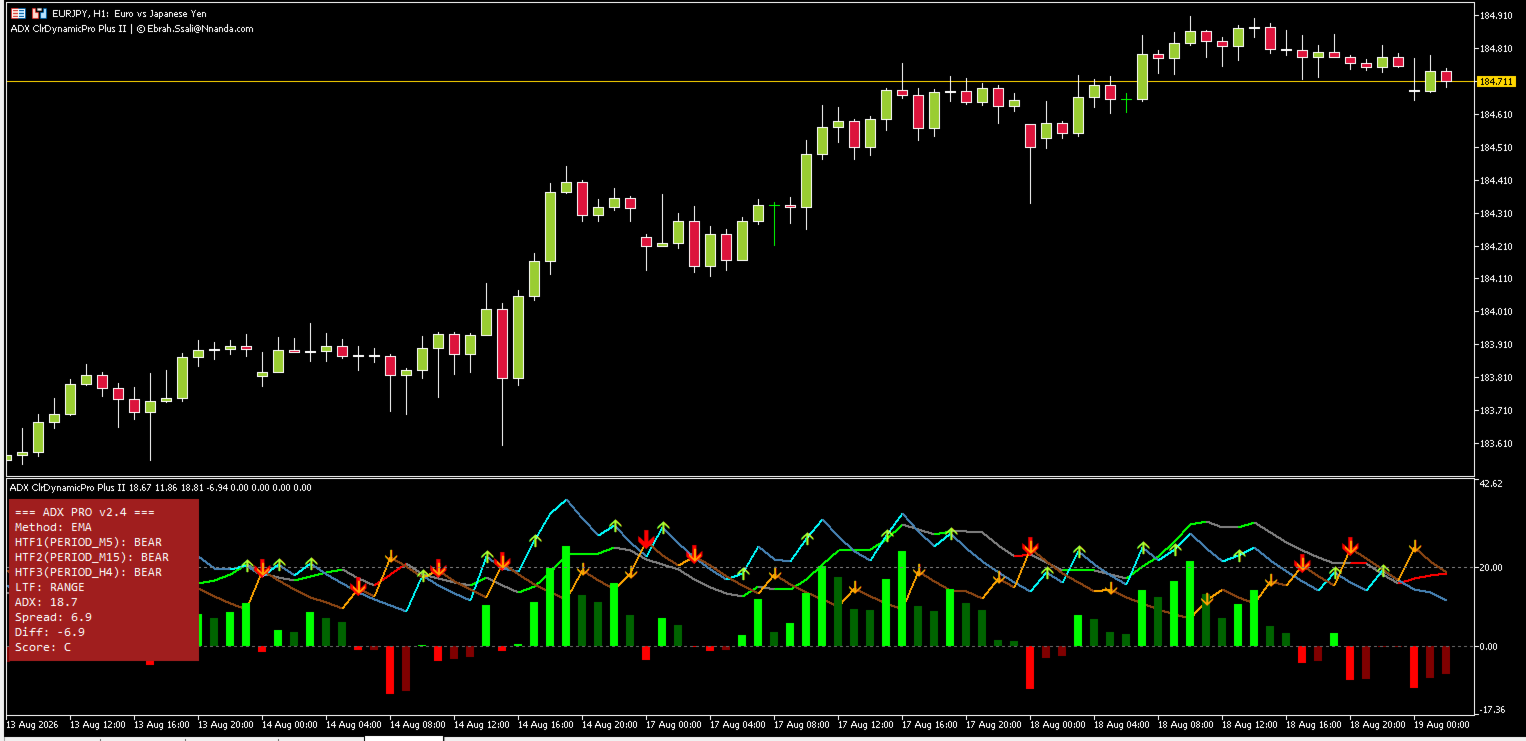
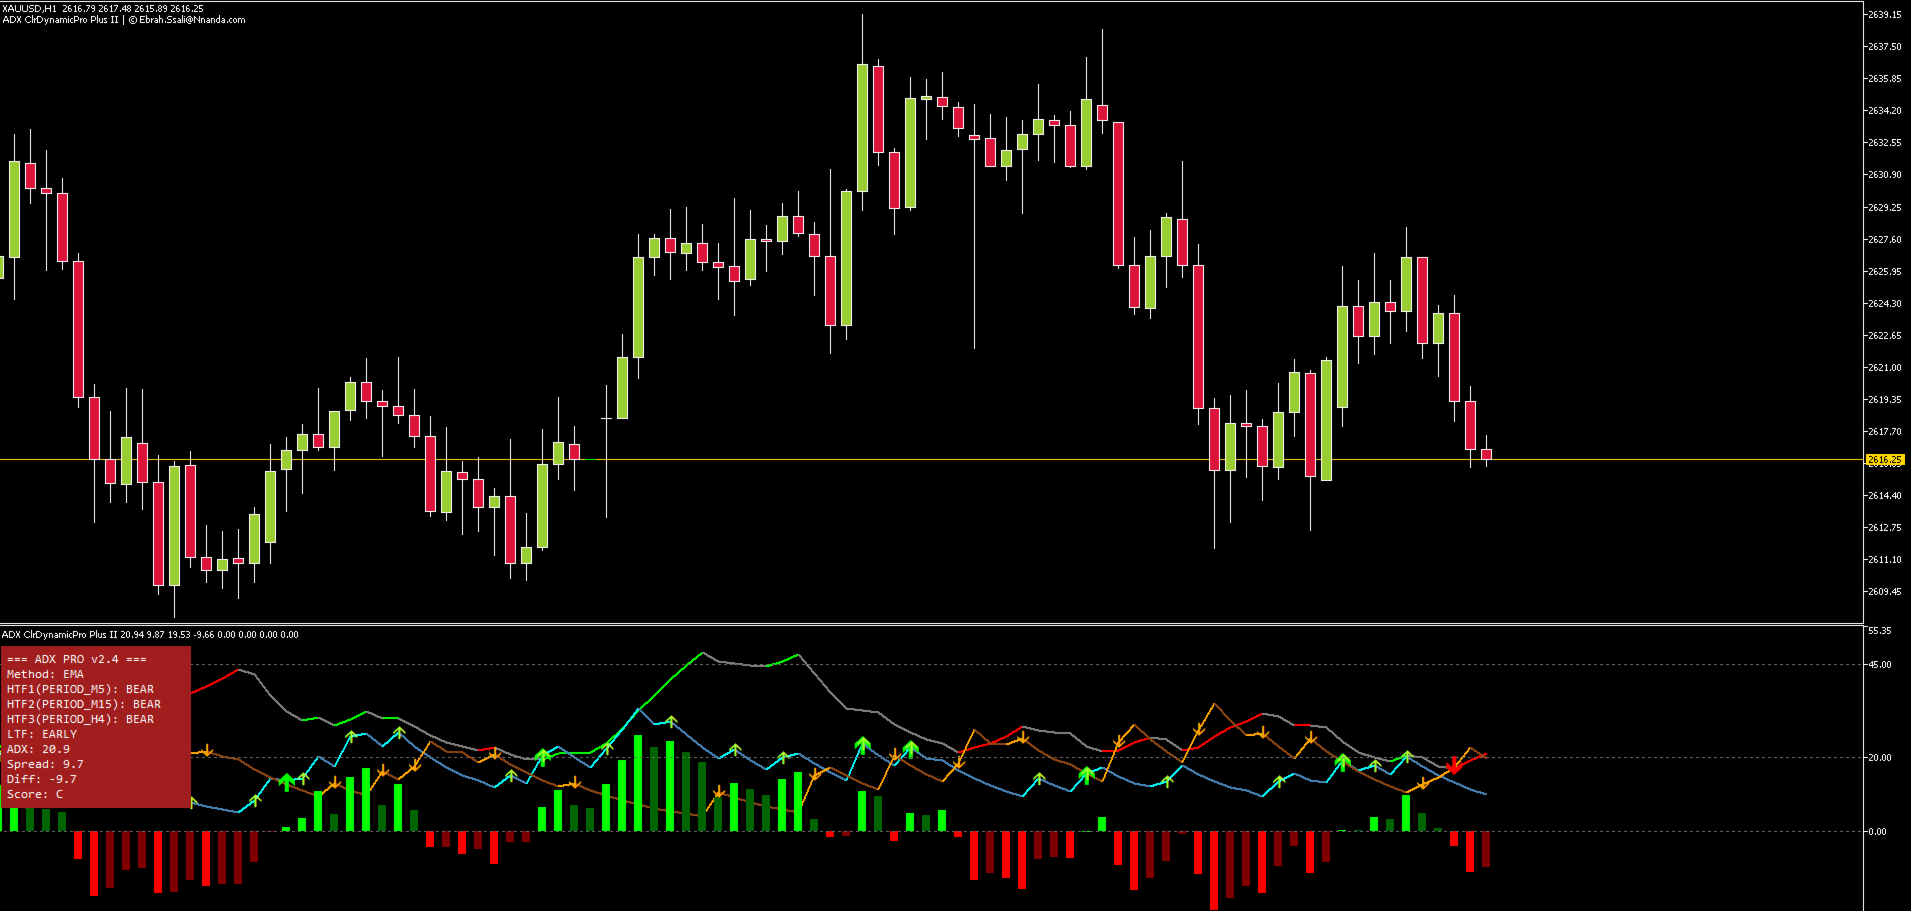
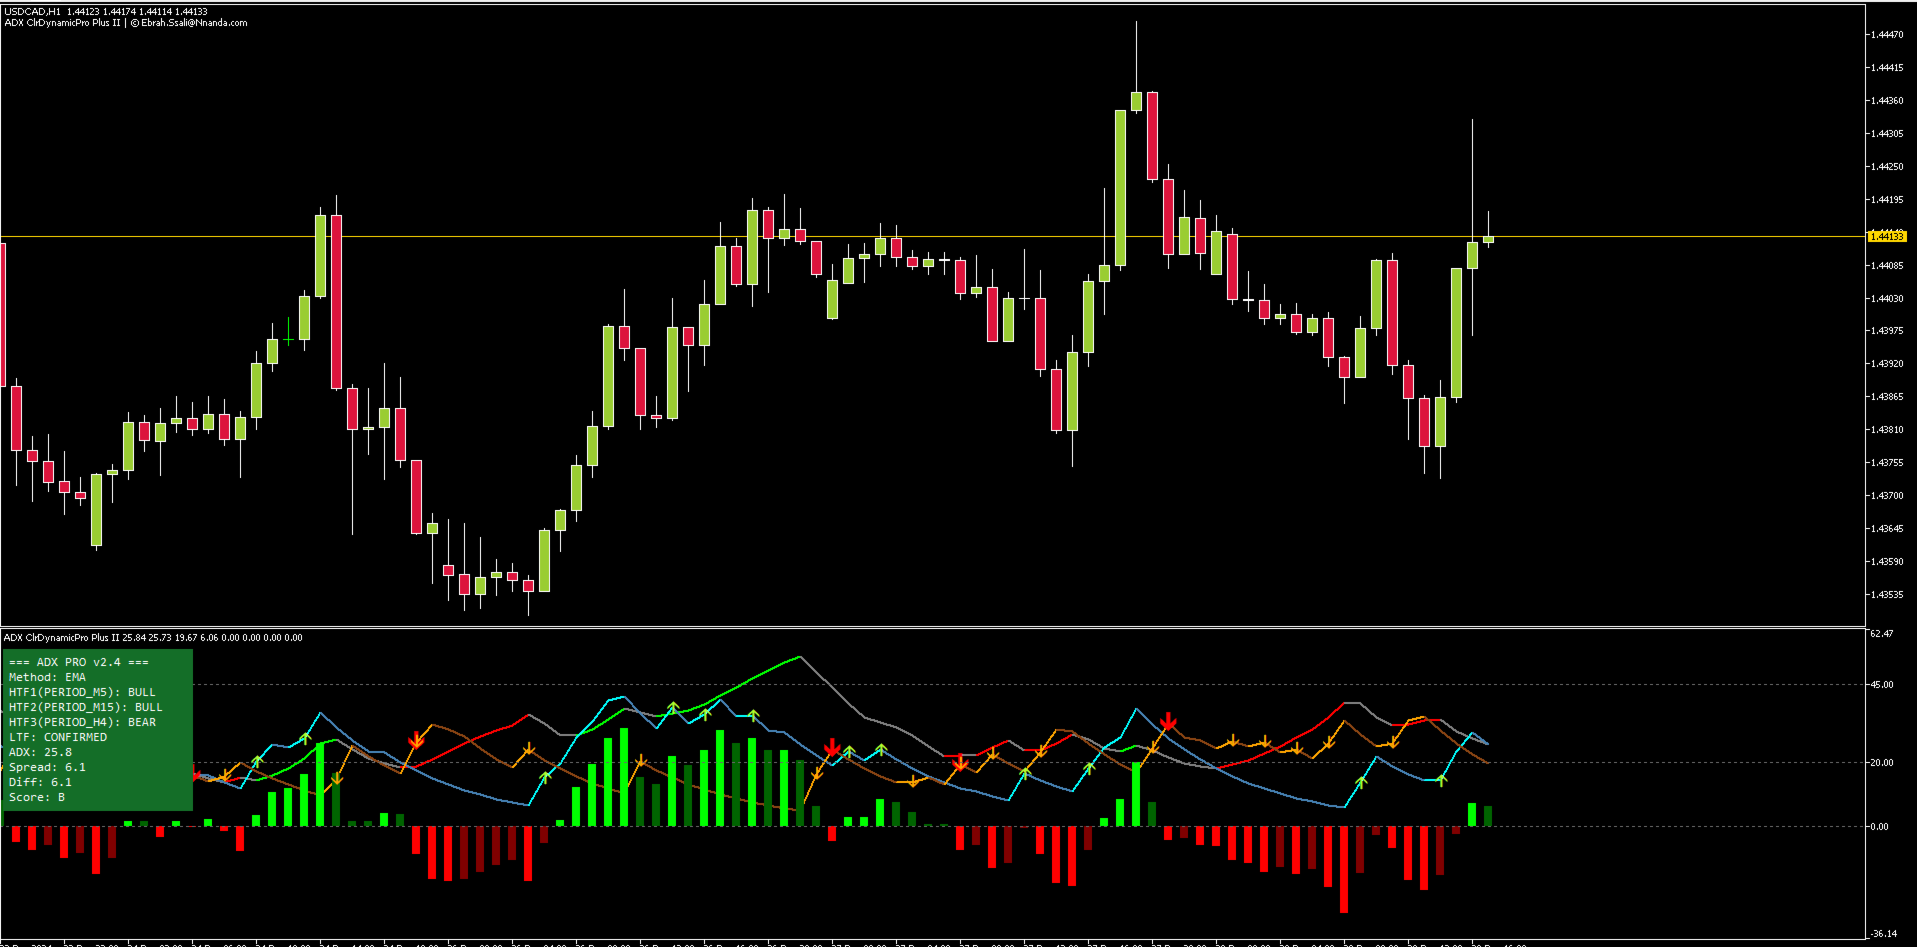
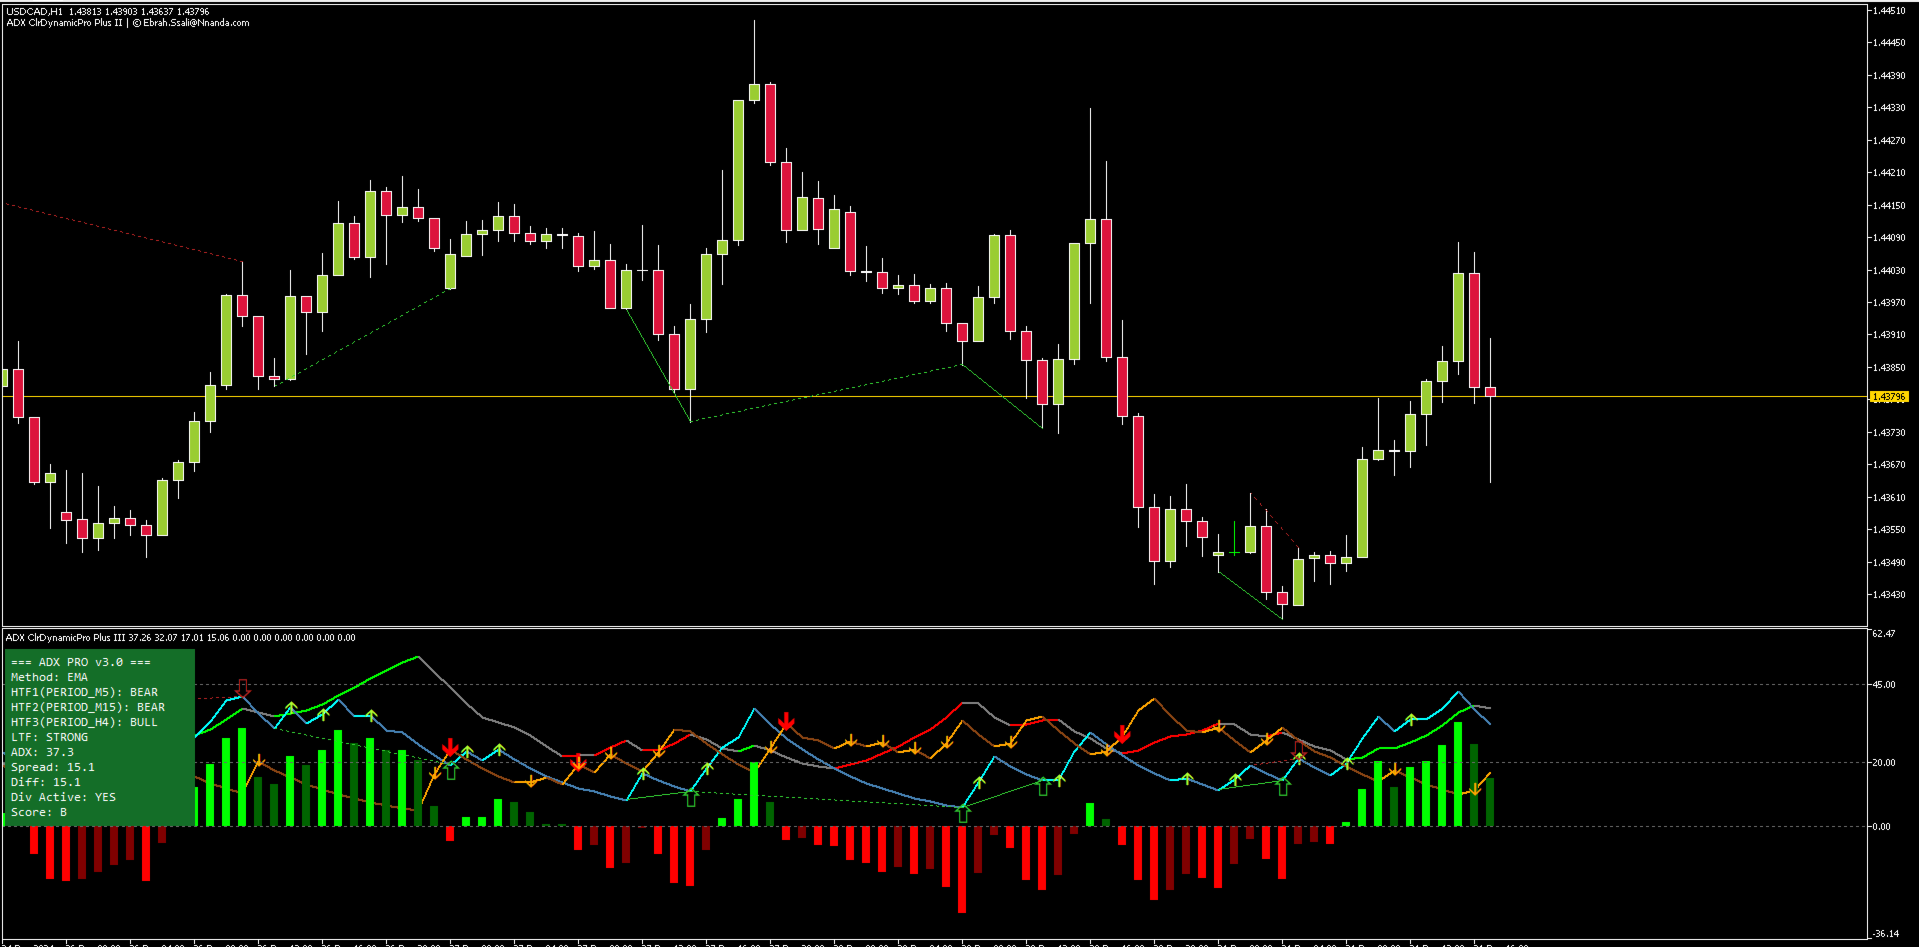
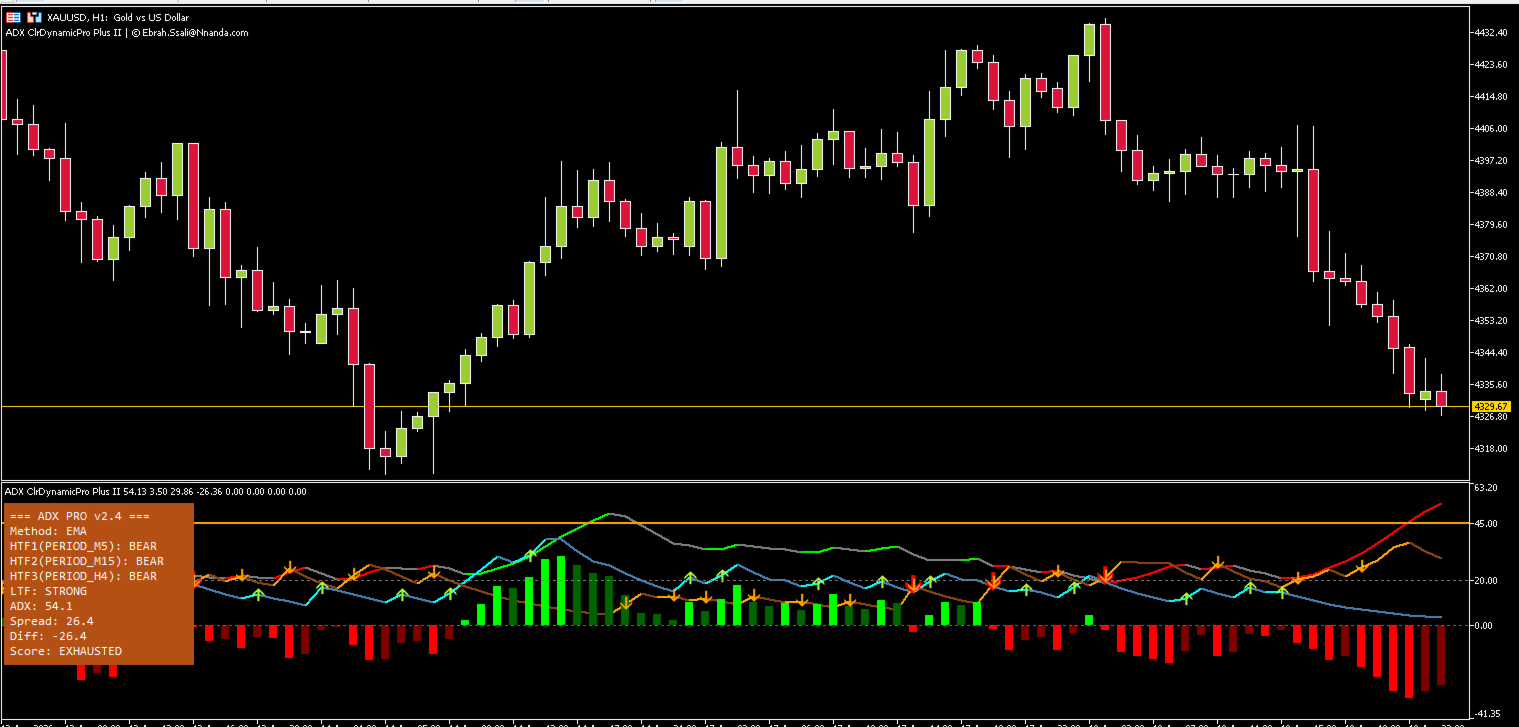
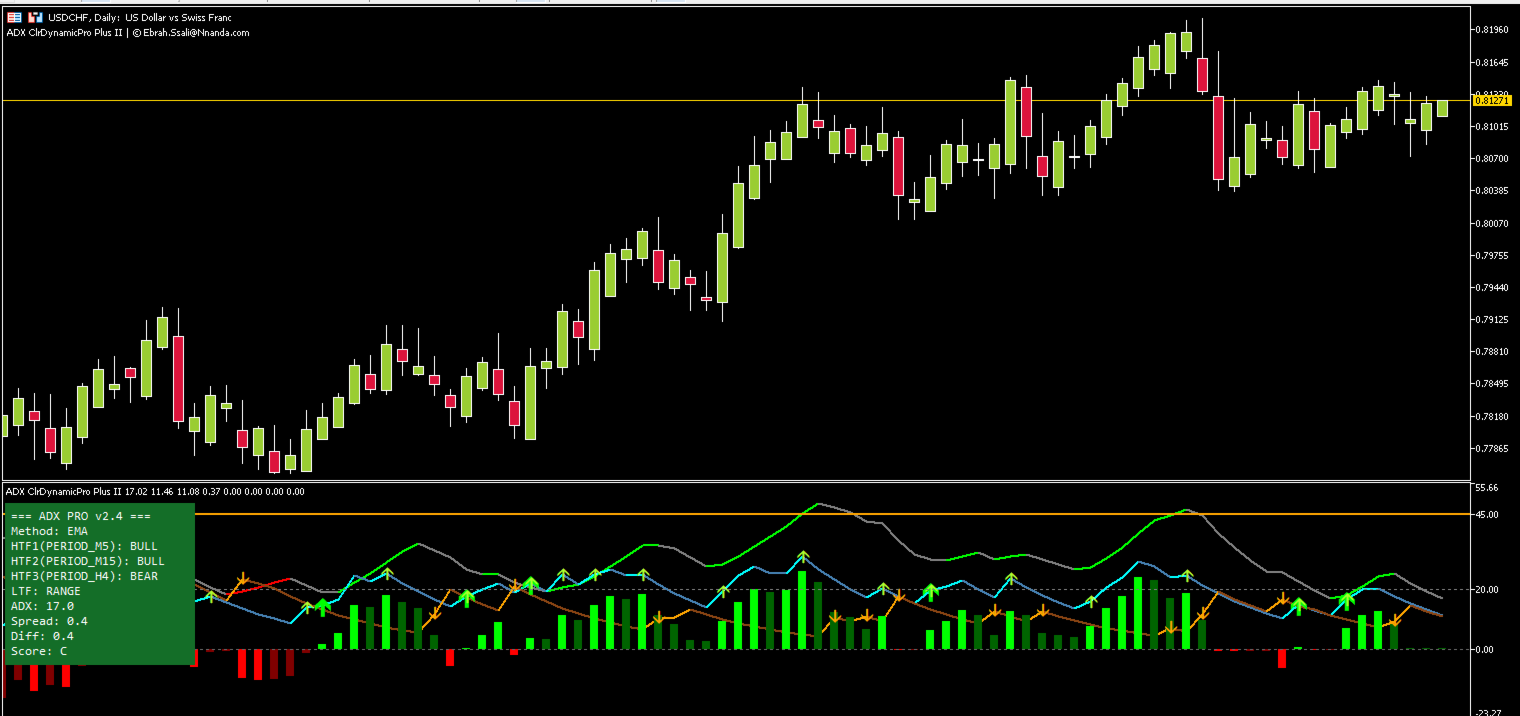
Instead of constantly flipping between charts and timeframes, ADX ClrDynamicPro Plus III embeds a clean, real-time diagnostic dashboard right inside your indicator subwindow. You get higher-timeframe trend alignment, local market states, DI spread metrics, early reversal warnings via divergence tracking, and objective setup grading at a single glance.

Key Trading Questions Answered

What is the Current Market Direction?

Instantly view overall direction via the slope-aware ADX line, DI differential histogram, and dynamic background colors (Green = Bullish, Red = Bearish, Orange = Exhausted, Slate = Neutral/Range).

Is the "Big Money" Aligned?

The Multi-Timeframe Monitor tracks three higher timeframes simultaneously (M5, M15, and H4 by default). Enter trades with confidence knowing local momentum aligns with higher-period structure.

Is a Reversal or Acceleration Brewing?

The built-in Divergence Engine automatically scans for classical and hidden divergences between price action and directional movement indicators. Spot high-probability trend exhaustion setups and continuation re-entries before price breaks away.

How Strong is the Setup?

The Automated Signal Scoring Engine grades setups from A+ (including dedicated Divergence boosts) to D (plus an EXHAUSTED alert) by evaluating ADX height, DI spread width, HTF confirmation, slope turns, and active divergence patterns.

Is the Move Overextended?

Built-in Exhaustion Logic identifies overextended trends (ADX > 45.0 default threshold), turning the dashboard background Orange to warn against buying the top or selling the bottom.

Core Features & Technical Edge

  • Advanced DI Divergence Detection Engine: Detects both Classical (trend reversal) and Hidden (trend continuation) divergences. When a divergence forms, the indicator draws precise visual trendlines on your indicator subwindow, projects corresponding price lines onto your main chart, and plots dedicated entry arrows ( BufferBullDiv and BufferBearDiv ).

  • Embedded Subwindow Dashboard: Positioned neatly inside the indicator subwindow to keep your main price chart clean and clutter-free.

  • Slope-Aware Dynamic Color Lines: No static, monochrome lines. Line colors adapt bar-by-bar based on real-time slope and trend states:

    • ADX Line: Switches to Lime (accelerating in a bull trend), Red (accelerating in a bear trend), or Gray (decelerating/losing momentum).

    • +DI / -DI Lines: Color-coded based on whether line slope is rising, flat, or falling.

  • DI Differential Histogram: Features a 4-color state system highlighting expanding vs. contracting momentum bars.

  • Dual-Threshold Signal Filtering: Eliminates whipsaws in choppy markets. Main DI Cross arrows are programmatically locked until the ADX surpasses your custom TrendFilter (default 15.0) and ADXLevel (default 20.0), combined with a required MinDISpread .

  • Algorithmic Trend Gate: Signal arrows do not trigger on local noise alone. The engine cross-references higher timeframes ( ConfirmTF1 – ConfirmTF3 ) to ensure trades align with macro structure before printing signals.

  • 3-in-1 Adaptive Signal Engine ( SlopeFilterMode ): Customize how momentum slope arrows behave on your chart:

    • Trend Only ( FILTER_TREND ): Displays slope arrows aligned with the dominant trend.

    • Counter-Trend / Mean Reversion ( FILTER_COUNTER ): Highlights momentum turns against the trend.

    • Show All ( FILTER_NONE ): Displays all momentum turns for full market visibility.

  • Triple Smoothing Engine + Hull Acceleration: Choose between traditional Wilder's Smoothing, smooth SMA, or low-lag EMA calculations—plus an optional Hull Acceleration toggle ( UseHullLogic ) for scalping fast-moving markets.

  • Multi-Channel Alerts: Live pop-ups, audio alerts, and mobile push notifications for DI Crosses, DI Slope turns, ADX level breakouts, Trend Exhaustion, and newly confirmed Divergences.

Objective Setup Scoring System

Evaluate setup quality instantly with the built-in grading engine:

Grade Setup Description Criteria
A+ (DIV) Reversal / Peak Conviction Active Bullish or Bearish Divergence confirmed on DI lines.
A+ / A High Conviction ADX ≥ 25, DI Spread ≥ 10, HTF1 Aligned, and active Slope turn.
B / C Moderate / Early Partial momentum or early-stage alignment.
D Low Probability Ranging, low-spread, or misaligned conditions. Avoid trend entries.
EXHAUSTED Danger Zone ADX exceeds threshold (> 45.0). High risk of sharp pullback or consolidation.

LTF Market Phase Tracking

The dashboard continuously classifies local price action into clear market states:

RANGE → EARLY → CONFIRMED → STRONG → EXHAUSTION

Expert Advisor (EA) & Buffer Integration

All values are calculated strictly on bar close or live ticks without repainting. EA developers can read signals directly via standard indicator buffers:

Buffer Index Output Data Description
0 & 1 ExtADXBuffer / ExtADXColor ADX Line values and Color index
2 & 3 ExtPDIBuffer / ExtPDIBufferColor +DI Line values and Color index
4 & 5 ExtNDIBuffer / ExtNDIBufferColor -DI Line values and Color index
6 & 7 ExtDiffBuffer / ExtDiffColor DI Differential Histogram & Color index
8 BufferBuy DI Cross BUY Signal Arrow
9 BufferSell DI Cross SELL Signal Arrow
10 BufferSlopeBuy +DI Slope UP Signal Arrow
11 BufferSlopeSell -DI Slope UP Signal Arrow
12 BufferBullDiv Bullish Divergence Arrow
13 BufferBearDiv Bearish Divergence Arrow

ADX ClrDynamicPro Plus III turns complex multi-timeframe mathematical data and structural momentum divergence into an intuitive visual map. Stop guessing trend strength, trade with structure, speed, and institutional precision.
Produits recommandés
RSI Divergence Risk Target Signals RSI Divergence Risk Target Signals is a MetaTrader 5 indicator that detects confirmed bullish and bearish RSI divergence and combines the signals with optional trend filters, ATR-based Stop Loss levels, three Take Profit targets, alerts and an internal trade statistics dashboard. The indicator compares confirmed RSI pivot structure with corresponding price highs and lows. It is designed to help traders identify momentum divergence while providing a structure
Harmonic Pattern Hunter
Shingidzano Lesetedi
5 (1)
Harmonic Pattern Hunter Harmonic Pattern Hunter is a technical indicator for MetaTrader 5 that automatically identifies and draws high-probability harmonic patterns directly on the chart. It is designed to assist traders who use harmonic analysis as part of their trading methodology. How It Works The indicator scans historical and live price data for completed XABCD harmonic structures using Fibonacci ratio validation. When a valid pattern is detected, it draws the full pattern geometry, marks t
The Expert Advisor and the video are attached in the Discussion tab . The robot applies only one order and strictly follows the signals to evaluate the indicator efficiency. Pan PrizMA CD Phase is an option based on the Pan PrizMA indicator. Details (in Russian). Averaging by a quadric-quartic polynomial increases the smoothness of lines, adds momentum and rhythm. Extrapolation by the sinusoid function near a constant allows adjusting the delay or lead of signals. The value of the phase - wave s
Matreshka
Dimitr Trifonov
5 (2)
Matreshka self-testing and self-optimizing indicator: 1. Is an interpretation of the Elliott Wave Analysis Theory. 2. Based on the principle of the indicator type ZigZag, and the waves are based on the principle of interpretation of the theory of DeMark. 3. Filters waves in length and height. 4. Draws up to six levels of ZigZag at the same time, tracking waves of different orders. 5. Marks Pulsed and Recoil Waves. 6. Draws arrows to open positions 7. Draws three channels. 8. Notes support and re
The indicator detects and displays М. Gartley's Butterfly pattern. The pattern is plotted by the extreme values of the ZigZag indicator (included in the resources, no need to install). After detecting the pattern, the indicator notifies of that by the pop-up window, a mobile notification and an email. The pattern and wave parameters are displayed on the screenshots. The default parameters are used for demonstration purposes only in order to increase the amount of detected patterns. Parameters z
Overview Harmonic Patterns MT5 is a technical analysis indicator designed for the MetaTrader 5 platform. It identifies and displays harmonic price patterns, such as Butterfly, Cypher, Crab, Bat, Shark, and Gartley, in both bullish and bearish directions. The indicator calculates key price levels, including entry, stop loss, and three take-profit levels, to assist traders in analyzing market movements. Visual elements and customizable alerts enhance usability on the chart. Features Detects six ha
Trade smarter, not harder: Empower your trading with Harmonacci Patterns This is arguably the most complete harmonic price formation auto-recognition indicator you can find for the MetaTrader Platform. It detects 19 different patterns, takes fibonacci projections as seriously as you do, displays the Potential Reversal Zone (PRZ) and finds suitable stop-loss and take-profit levels. [ Installation Guide | Update Guide | Troubleshooting | FAQ | All Products  ] It detects 19 different harmonic pric
CosmiCLab SMC FIBO CosmiCLab SMC FIBO is a professional trading indicator designed for traders who use Smart Money Concepts (SMC), market structure analysis and Fibonacci retracement levels. The indicator automatically detects market swings and builds Fibonacci levels based on the latest impulse movement. It also identifies market structure changes such as BOS (Break of Structure) and CHOCH (Change of Character), helping traders understand the current market direction. CosmiCLab SMC FIBO also pr
This is Gekko's Cutomized Relative Strength Index (RSI), a customized version of the famous RSI indicator. Use the regular RSI and take advantage two entry signals calculations and different ways of being alerted whenever there is potential entry or exit point. Inputs Period: Period for the RSI calculation; How will the indicator calculate entry (swing) signals: 1- Produces Exit Signals for Swings based on RSI entering and leaving Upper and Lower Levels Zones; 2- Produces Entry/Exit Signals for
Candlestick Pattern Scanner Pro — Indicator Description A comprehensive, customizable candlestick pattern recognition tool for MetaTrader 5, featuring ATR-based signal positioning, dynamic TP/SL levels, and multi-timeframe alert capabilities. Key Features ATR-Based Signal Management ATR Period & Multiplier : Dynamically calculates arrow signal distance based on market volatility. Dynamic TP/SL Levels : Set Take-Profit (TP1/TP2) and Stop-Loss levels using customizable ATR multipliers for
RM Divergence Pro
Mohammadreza Mahdi Mavaddat
5 (1)
RM Divergence Pro - Indicateur de divergence et d'incapacité RSI : Il s'agit d'un indicateur de divergence RSI non repeint, basé sur la structure du marché. Il détecte les divergences régulières, les divergences cachées, l'incapacité et les divergences potentielles à l'aide des fluctuations RSI confirmées, du comportement des prix et de filtres structurels. Aperçu : RM Divergence Pro est un outil de divergence basé sur RSI et axé sur la logique structurelle. Il utilise les hauts et les bas confi
Unlock market continuations with the accurate pennants indicator This indicator finds pennants , which are continuation patterns identified by converging trendlines surrounding a price consolidation period. Trades are signaled using a breakout period alongside the formation breakout.  [ Installation Guide | Update Guide | Troubleshooting | FAQ | All Products ] Easy to use Customizable colors and sizes It implements breakout signals It implements alerts of all kinds Optimal Usage To see pennants
The   Fibonacci Confluence Toolkit   is a technical analysis tool designed to help traders identify potential price reversal zones by combining key market signals and patterns. It highlights areas of interest where significant price action or reactions are anticipated, automatically applies Fibonacci retracement levels to outline potential pullback zones, and detects engulfing candle patterns. Its unique strength lies in its reliance solely on price patterns, eliminating the need for user-define
Fabii Half Trend Baseline
Fabien Georges Andre Guillemaud
Cessez de trader contre la tendance du timeframe supérieur. Deux baselines, un graphique. No repaint. Toute paire, tout timeframe. Sur votre graphique en 2 minutes. Démo gratuite dans le Strategy Tester. Get more indicators here Baselines, volatility filters and oscillators. No repaint. Pourquoi vous en avez besoin Vous entrez en position parce qu'une ligne est passée au vert sur votre graphique. Puis vous ouvrez un timeframe supérieur et vous voyez que la tendance de fond va dans l'autre sen
Supply Demand Entry — MT5 All-in-one trading assistant for precision Supply & Demand analysis, entries, and trade management.   Supply & Demand Zones — Fresh zone detection & retests   Buy / Sell Setups — Clear trade signals & entry levels   S/R Levels — Support & resistance across all timeframes   Multi-Timeframe Analysis — M1 to MN   Economic Calendar — High-impact news awareness   Mobile Alerts — Signal, zone & trade-level notifications   Trade Levels — Entry, SL, TP & R :R   Trading Journal
Stratégie de Flèche RSI Bandes de Bollinger (RSI Bollinger Bands Arrow Strategy) La Stratégie de Flèche RSI Bandes de Bollinger est un indicateur technique propre et efficace, conçu pour identifier les points de retournement à haute probabilité en utilisant la combinaison du RSI et des Bandes de Bollinger. Cette stratégie utilise l'indicateur RSI avec les Bandes de Bollinger pour: Vendre lorsque le prix est au-dessus de la Bande de Bollinger supérieure. Acheter lorsque le prix est en dessous de
Chỉ báo này sẽ thông báo cho bạn nếu cấu hình xu hướng thành công. Tín hiệu theo xu hướng không nên được tăng theo, nhưng tín hiệu mua ở mức giá thấp theo mô hình giao dịch thông thường của bạn, hoặc tín hiệu bán ở mức giá tốt, là một lựa chọn rất tốt. Hãy thiết lập nó trên khung thời gian lớn hơn và theo dõi các khung thời gian nhỏ hơn, bám sát các xu hướng chính. Tôi thường thiết lập ba khung thời gian gần nhau nhất và không bao giờ đi ngược tín hiệu của INdicator này. INdicator   này không có
Indicateur Crypto_Forex « Motif Marteau et Étoile Filante » pour MT5, sans modification, sans délai. - L'indicateur « Motif Marteau et Étoile Filante » est un indicateur très performant pour le trading Price Action. - L'indicateur détecte les motifs Marteau haussier et Étoile Filante baissière sur le graphique : - Marteau haussier : signal de flèche bleue sur le graphique (voir images). - Étoile Filante baissière : signal de flèche rouge sur le graphique (voir images). - PC, Mobile alerts. - L'
Gartley Projections D
Oleksandr Medviediev
3 (2)
The indicator identifies the harmonic patterns (XABCD) according to developments of H.M.Gartley ( "Profits in the Stock Market" , 1935г). It projects D-point as a point in the perspective projection (specify ProjectionD_Mode = true in the settings). Does not redraw. When a bar of the working timeframe closes, if the identified pattern point has not moved during Patterns_Fractal_Bars bars, an arrow appears on the chart (in the direction of the expected price movement). From this moment on, the ar
Time And Sales Delta
Evgeny Shevtsov
5 (2)
The indicator displays the delta and the cumulative delta based on the "Time & Sales" deals list data. In addition to the standard timeframes, the indicator displays data regarding the seconds timeframes (S5, S10, S15, S20, S30) to choose from. Using the rectangle, user can select an arbitrary area in the indicator subwindow to view the ratio of the volumes of deals of buyers and sellers within this area. Indicator features: The indicator works correctly only on those trading symbols for which
Price Magnet — Price Density and Attraction Levels Indicator Price Magnet is a professional analytical tool designed to identify key support and resistance levels based on statistical Price Density. The indicator analyzes a specified historical period and detects price levels where the market spent the most time. These zones act as “magnets,” attracting price action or forming a structural base for potential reversals. Unlike traditional Volume Profile tools, Price Magnet focuses on price-time d
Представлен принципиально новый индикатор ZigZag, который отличается от стандартного абсолютной легкостью, быстродействием расчетов и очень высокой точностью. В основе индикатора заложен принцип цикличности рынка с совокупностью анализа количества текущих баров и их основных ценовых уровней. Чем меньше баров для определения расчетов, тем более агрессивная постройка линий индикатора. Как и в  стандартном индикаторе перерисовывается только последняя линия, при изменении достигнутого экстремума. П
Gann waves
Nguyen Van Duc
Gann Waves Smart Structure Pro (MT5) Tired of lagging, messy price action indicators that freeze your MetaTrader terminal? Welcome to Gann Waves Smart Structure Pro —the ultimate, high-performance market structure indicator for MetaTrader 5. Built upon authentic W.D. Gann wave-building mechanics, this tool seamlessly maps market swings and automatically flags institutional structural shifts ( CB, TN, GT ) in real-time. Whether you are a Smart Money Concepts (SMC) trader, a Gann enthusiast, or a
Smart Support And Resistance Indicator See the Market Levels That Matter. Make your chart clearer and your technical analysis more organized with Smart Support And Resistance Indicator — a powerful trading tool designed to help traders identify important support and resistance levels directly on their MetaTrader 5 charts. Whether you trade Forex, Gold, Indices, or other available markets, this indicator helps you focus on key price areas, monitor potential market reactions, and analyze price act
Primes Action trace sur le graphique les niveaux haut et bas du jour, de la semaine et du mois précédents, et signale quand le prix les casse. Chaque unité de temps a sa propre couleur, les trois références sont donc faciles à distinguer. Comment les niveaux sont trouvés Le plus haut ou le plus bas exact d'une période n'est souvent qu'une mèche courte. Primes Action examine le huitième supérieur et le huitième inférieur de la période précédente terminée. Dans chacun d'eux, il trace le niveau où
Divergent Stochastic Filter II Catch Reversals Early, Filter Noise, Trade with Confidence The Edge: Why This Stochastic is Different  Every trader knows the Stochastic oscillator. But knowing when to trust its signals, that's the real challenge. The Divergent Stochastic Filter II transforms this classic indicator into a precision reversal detection system by adding critical elements: divergence intelligence, signal filtering and exhaustion detection.  While standard Stochastic oscillators fire s
"Impulses and Corrections 5" is created to help traders navigate the market situation. The indicator shows multi-time frame upward and downward "Impulses" of price movements. These impulses are the basis for determining the "Base" , which is composed of zones of corrections of price movements, as well as "Potential" zones for possible scenarios of price movement. Up and down impulses are determined based on a modified formula of Bill Williams' "Fractals" indicator. The last impulse is always "U
STRUCTURAL TREND LINES - MT5 Indicator Simple indicator that automatically draws trend lines based on market structure. Features: - 3 degrees of structure detection (short, medium, long term) - Configurable swing strength for each degree - Single color per degree for clean visualization - Adjustable number of lines per degree - Customizable colors and line widths How it works: The indicator identifies swing highs and lows based on the strength parameter, then connects these points to create t
HAS RSI Signal — Indicateur de Tendance Professionnel avec Calcul SL/TP HAS RSI Signal est un outil de trading puissant combinant des classiques éprouvés et des algorithmes modernes de filtrage du bruit. L'indicateur analyse le marché à travers le prisme des bougies Heiken Ashi Smoothed (HAS) et de l'oscillateur RSI , offrant au trader des signaux d'entrée clairs lors des retournements de tendance ou des sorties de zones de surachat/survente. Principaux Avantages : Double Filtrage : L'utilisatio
Noize Absorption Index - is the manual trading system that measures the difference of pressure between bears forces and bulls forces. Green line - is a noize free index that showing curent situation. Zero value of index shows totally choppy/flat market.Values above zero level shows how powerfull bullish wave is and values below zero measures bearish forces.Up arrow appears on bearish market when it's ready to reverse, dn arrow appears on weak bullish market, as a result of reverse expectation.
Les acheteurs de ce produit ont également acheté
Trend Sniper X
Sarvarbek Abduvoxobov
4.86 (43)
Trend Sniper X est un indicateur de suivi de tendance multi-unités de temps pour MetaTrader 5 qui aide les traders à identifier la direction de la tendance et les points d'inversion potentiels avec clarté et précision. pour MT4: https://www.mql5.com/en/market/product/193245 Informations sur le prix : Le prix actuel est un prix promotionnel et est susceptible de changer lors des prochaines mises à jour et nouvelles fonctionnalités. Offre bonus : Pour obtenir GRATUITEMENT l'Auto-Trade Assistant E
Smart Trend Trading System — MetaTrader 5 Après votre achat, envoyez-moi un message sur MQL5 pour recevoir GRATUITEMENT Smart Universal Expert Advisor, ainsi que le cours en ligne, le manuel PDF et l’accès au groupe privé. STTS réunit la direction de la tendance, les signaux d’entrée et de sortie, les zones de retournement et les niveaux de prix importants directement sur votre graphique. Suivez le système manuellement ou connectez un EA compatible distinct pour une exécution automatique selon l
SuperScalp Pro
Van Minh Nguyen
4.54 (37)
SuperScalp Pro - Professional Multi-Layer Confluence Scalping System SuperScalp Pro est un indicateur de scalping avancé qui améliore le Supertrend classique grâce à plusieurs filtres intelligents de confirmation. Il vous aide à identifier des opportunités de trading Buy/Sell présentant une probabilité de réussite plus élevée, tout en réduisant considérablement les faux signaux. Des flèches Buy et Sell bien visibles apparaissent directement sur le graphique, avec des niveaux de Stop Loss et de T

En 2019, j'ai montré au monde entier ce dont cet indicateur est capable. J'ai tradé ses signaux manuellement, sur un compte réel, en toute transparence — le compte était suivi sur Myfxbook, et je relatais cette expérience en détail sur Facebook. Résultat : en quatre mois, 10 000 dollars sont devenus 941 411. Le risque était délibérément extrême — le drawdown allait jusqu'à 54 %, car dans notre métier, le profit et le risque vont toujours de pair. La capture d'écran de Myfxbook est la première im
Ultra Indicator
Ihor Otkydach
5 (1)
ULTRA est un indicateur technique « tout-en-un » : il analyse le marché de manière autonome, génère des signaux de trading, affiche les niveaux permettant de définir des ordres stop-loss et suggère le moment opportun pour clôturer les positions afin de sécuriser les bénéfices ou de minimiser les pertes. En d'autres termes, peu importe que vous ne sachiez pas analyser le marché, déterminer les niveaux (où placer votre stop-loss) ou que vous ayez du mal à gérer votre capital. ULTRA s'occupera de t
Gann Made Easy   est un système de trading Forex professionnel et facile à utiliser qui est basé sur les meilleurs principes de trading en utilisant la théorie de mr. WD Gann. L'indicateur fournit des signaux d'ACHAT et de VENTE précis, y compris les niveaux Stop Loss et Take Profit. Vous pouvez échanger même en déplacement en utilisant les notifications PUSH. VEUILLEZ ME CONTACTER APRÈS L'ACHAT POUR RECEVOIR GRATUITEMENT DES INSTRUCTIONS DE TRADING ET D'EXCELLENTS INDICATEURS SUPPLÉMENTAIRES! V
M1 Sniper MT5
Oleg Rodin
5 (7)
M1 SNIPER   est un système d'indicateurs de trading facile à utiliser. Il s'agit d'un indicateur à flèche conçu pour l'unité de temps M1. Cet indicateur peut être utilisé seul pour le scalping sur l'unité de temps M1 ou intégré à votre système de trading existant. Bien que conçu spécifiquement pour le trading sur l'unité de temps M1, ce système peut également être utilisé avec d'autres unités de temps. Initialement, j'avais conçu cette méthode pour le trading du XAUUSD et du BTCUSD. Cependant, j
Auto Optimized SpeedAngle est un système de vectorisation du momentum de niveau institutionnel qui élimine l'ajustement de courbe ( curve-fitting ) grâce à une optimisation continue par avancement ( Walk-Forward Optimization , WFO). Plutôt que de s'appuyer sur des entrées statiques qui se dégradent lorsque les régimes de marché changent, l'indicateur recalibre dynamiquement ses paramètres en utilisant une validation hors échantillon ( Out-of-Sample , OOS), garantissant ainsi que les signaux affi
Prochaine mise à jour — Version 2.52 bientôt disponible ! [NOUVEAU] Préparez-vous à découvrir 4 nouvelles fonctionnalités majeures conçues pour améliorer votre analyse du marché et votre flux de travail de trading Nous faisons passer l’analyse du marché au niveau supérieur avec 4 nouvelles fonctionnalités conçues pour répondre à vos besoins en trading. Découvrez : 1. TRADE OVERVIEW DASHBOARD 2. CONFLUENCE AT ZONE 3. STRONG & WEAK HIGH/LOW 4. OTE 1. TRADE OVERVIEW DASHBOARD Un tableau de bord qu
Atomic Analyst MT5
Issam Kassas
4.5 (64)
Atomic Analyst — MetaTrader 5 Après votre achat, envoyez-moi un message sur MQL5 pour recevoir GRATUITEMENT Smart Universal Expert Advisor, ainsi que le cours en ligne, le manuel PDF et l’accès au groupe privé. Atomic Analyst réunit l’action des prix, la direction de la tendance, les signaux d’entrée et de sortie, le Stop Loss et plusieurs niveaux de Take Profit directement sur votre graphique. REPÉREZ LE SIGNAL. COMPRENEZ LA CONFIGURATION. Atomic Analyst présente son analyse sous forme d’inform
Boba Analysis Suite
Trade Ready Solutions LLC
5 (2)
Boba Analysis Suite Boba Analysis Suite est un indicateur d’analyse pour MetaTrader 5. Il réunit la structure du marché, les zones de prix pertinentes et le contexte général du marché dans une même vue graphique. Développé à partir de l’expérience pratique d’un trader et formateur en trading, il accompagne une démarche d’analyse structurée : évaluer la direction du marché, identifier les niveaux importants et analyser plusieurs unités de temps conjointement. Une analyse en contexte La significat
Azimuth Pro
Ottaviano De Cicco
5 (7)
Azimuth Pro V2: Synthetic Fractal Structure and Confirmed Entries for MT5 Overview Azimuth Pro is a multi-level swing structure indicator by Merkava Labs . Four nested swing layers, swing-anchored VWAP, ABC pattern detection, three-timeframe structural filtering, and closed-bar confirmed entries — one chart, one workflow from micro-swings to macro-cycles. This is not a blind signal product. It is a structure-first workflow for traders who care about location, context, and timing. Halloween P
Zain Gold Scalping
Ahmed Gamal Abdel Nasser Mohamed
A complete price-action analysis tool built around dual independent entry logic, each confirmed against a volatility band, combined with a configurable set of nine optional confirmation filters that let you shape exactly how conservative or aggressive the tool's signals behave. Core Strategy Two independent entry setups, each triggering only when price moves outside a dynamic volatility band — giving two distinct ways to spot potential reversal points, which can be used together or separately.
FiboSniper Pro
Van Minh Nguyen
5 (4)
FiboSniper Pro – Multi-Filter Fibonacci System with Auto SL/TP and Control Panel FiboSniper Pro est un indicateur technique qui combine des Fibonacci Envelopes dynamiques avec plusieurs filtres de confirmation afin de générer des signaux Buy et Sell sélectionnés. Les niveaux de Fibonacci sont calculés à partir de Moving Average et ATR, puis filtrés par ADX, EMA, RSI, ATR, Volume, Time et la structure des bougies. L’indicateur affiche directement sur le graphique les niveaux automatiques de Stop
Power Candles MT5
Daniel Stein
4.58 (12)
Power Candles V3 - Indicateur de force à optimisation automatique Power Candles V3 transforme la force des devises et des instruments en un plan de trading exploitable sur chaque graphique auquel il est associé. Au lieu de se contenter de colorer les bougies, il effectue une optimisation automatique en temps réel en arrière-plan et vous fournit les meilleurs niveaux de Stop Loss, Take Profit et seuils de signal pour le symbole que vous avez sous les yeux. Un simple clic suffit pour l'adopter en
Quantum TrendPulse
Bogdan Ion Puscasu
5 (26)
Présentation de   Quantum TrendPulse   , l'outil de trading ultime qui combine la puissance de   SuperTrend   ,   RSI   et   Stochastic   dans un seul indicateur complet pour maximiser votre potentiel de trading. Conçu pour les traders qui recherchent précision et efficacité, cet indicateur vous aide à identifier les tendances du marché, les changements de dynamique et les points d'entrée et de sortie optimaux en toute confiance. Caractéristiques principales : Intégration SuperTrend :   suivez f
Adaptive Price Action Engine Achetez un indicateur, obtenez l'EA gratuitement Analyse auto-optimisée des tendances et des figures de chandeliers Multi-Timeframe Les marchés évoluent constamment, et tous les modèles de Price Action n’ont pas la même valeur dans toutes les conditions de marché. Adaptive Price Action Engine a été conçu pour s’adapter aux changements du marché en combinant structure de tendance, analyse Multi-Timeframe, figures de chandeliers et optimisation statistique au sein d’un
Superhero
Ihor Otkydach
5 (3)
L'indicateur SUPERHERO est un système de trading multidevises conçu selon un principe « tout compris ». Cet indicateur analyse le marché de manière autonome et fournit des signaux indiquant quand ouvrir et clôturer des positions. Il utilise des ordres Stop Loss et Take Profit. Le rapport R:R est de 1:1. Ce système peut envoyer des notifications push sur votre smartphone, ce qui vous permet de passer des ordres « où que vous soyez », sans avoir à rester devant un ordinateur. C'est la solution idé
Indicateur de force et de momentum multi-devises MT5 Dynamic Forex28 Navigator est l'évolution de nos indicateurs populaires de longue date et réunit la puissance de trois outils en un : Advanced Currency Strength28 Indicator (700 avis) Advanced Currency IMPULSE with ALERT (530 avis) CS28 Combo Signals (bonus actuel) Les deux indicateurs précédents totalisent plus de 1 200 avis sur le MQL5 Market et font partie des outils incontournables de la communauté MT4 depuis 2016. Dynamic Forex28 Navigato
Apex Patterns PRO Achetez l'indicateur - Obtenez GRATUITEMENT l'Expert Advisor basé sur celui-ci. Intelligence auto-optimisée des figures chartistes et des cassures Les scanners de figures traditionnels s'appuient sur des paramètres fixes, sous-performant souvent lorsque la volatilité et les structures du marché changent. Apex Patterns PRO est conçu pour s'adapter aux conditions changeantes du marché en combinant la reconnaissance des figures chartistes structurelles, le filtrage du momentum et
Crystal Heikin Ashi Signals
Muhammad Jawad Shabir
5 (5)
Crystal Heikin Ashi Signals—Professional Trend & Signal Detection Indicator Advanced Heikin Ashi Visualization with Intelligent Signal System for Manual & Automated Trading Final Price: $149 ---------> Price goes up $10 after every 10 sales . Limited slots available — act fast . Overview User Guide PDF Crystal Heikin Ashi Signals is a professional-grade MetaTrader 5 indicator that combines pure Heikin Ashi candle visualization with an advanced momentum-shift detection system. Designed for both m
Neuro Poseidon MT5
Daria Rezueva
4.75 (52)
Neuro Poseidon is a new indicator by Daria Rezueva. It combines precise trading signals with adaptive TP/SL levels - creating best possible trades as a result! Message me and get  Neuro Poseidon Assistant  as a gift to automize your trading process! What makes it stand out? 1. Proven profitability on all assets and timeframes 2. Only confirmed BUY and SELL signals present on the chart 3. Adaptive TP & SL levels generated by the software for each trade 4. Easy to understand - suitable for al
Unix Scalper
Issam Kassas
4 (4)
Unix Scalper — MetaTrader 5 Après votre achat, envoyez-moi un message sur MQL5 pour recevoir GRATUITEMENT Smart Universal Expert Advisor, ainsi que le cours en ligne, le manuel PDF et l’accès au groupe privé. Repérez la configuration. Consultez le plan. Choisissez comment intervenir. UNIX Scalper réunit l’analyse du marché, les décisions BUY/SELL/WAIT et les niveaux Entry, Stop Loss, TP1 et TP2 dans un panneau organisé. VISUALISEZ LE SIGNAL ET LE PLAN • Des décisions claires : BUY, SELL ou WAIT.
CGE Trading Suite
Carl Gustav Johan Ekstrom
5 (3)
Institutional-Grade Analytics for MT5 The full analytical edge of a professional trading desk, built into your MT5 chart. A full guided tour walks you through every feature step by step. Standard retail platforms lack the depth required for professional market analysis. The CGE Trading Suite bridges this gap, transforming MetaTrader 5 into a comprehensive workspace. By integrating 18 proprietary modules into a single, unified chart interface, the suite eliminates fragmented analysis. It provide
FX Trend MT5 NG
Daniel Stein
5 (6)
FX Trend NG : La Nouvelle Génération d’Intelligence de Tendance Multi-Marchés Vue d’ensemble FX Trend NG est un outil professionnel d’analyse de tendance multi-timeframe et de surveillance des marchés. Il vous permet de comprendre la structure complète du marché en quelques secondes. Au lieu de naviguer entre de nombreux graphiques, vous identifiez immédiatement quels instruments sont en tendance, où le momentum s’affaiblit et où plusieurs unités de temps sont alignées. Offre de Lancement – Ob
Scalper Vault est un système de trading puissant et complet, conçu pour les traders en quête de régularité dans le cadre du trading intrajournalier. Cet indicateur de haute précision constitue un système de trading autonome et exhaustif, offrant des analyses de qualité institutionnelle, aussi bien pour le Forex que pour les options binaires. VEUILLEZ ME CONTACTER APRÈS VOTRE ACHAT POUR OBTENIR MES CONSEILS DE TRADING AINSI QU'UN EXCELLENT BONUS ! En éliminant les incertitudes et les analyses man
Divergence Bomber
Ihor Otkydach
4.89 (94)
Chaque acheteur de cet indicateur reçoit également gratuitement : L’outil exclusif « Bomber Utility », qui accompagne automatiquement chaque opération de trading, fixe les niveaux de Stop Loss et de Take Profit, et clôture les positions selon les règles de la stratégie Des fichiers de configuration (set files) pour adapter l’indicateur à différents actifs Des set files pour configurer le Bomber Utility selon différents modes : « Risque Minimum », « Risque Équilibré » et « Stratégie d’Attente »
Unlock hidden profits: accurate divergence trading for all markets Tricky to find and scarce in frequency, divergences are one of the most reliable trading scenarios. This indicator finds and scans for regular and hidden divergences automatically using your favourite oscillator. [ Installation Guide | Update Guide | Troubleshooting | FAQ | All Products  ] Easy to trade Finds regular and hidden divergences Supports many well known oscillators Implements trading signals based on breakouts Displays
FX Analysis is an all-in-one MT5 indicator dashboard that combines eight analytical tools in a single panel, helping traders identify high-probability setups without switching between charts or indicators. Designed for standard forex pairs on MetaTrader 5. Best results on M15 - H4 timeframes when all components are used together as part of the included workflow. Components Volatility Analyzer Displays historical average movement by hour and by day of the week. A real-time Pip Balance shows the
PainX GainX Blue Spike Fusion AI Synthetic Index Spike Analysis Indicator for MetaTrader 5 Overview PainX GainX Blue Spike Fusion AI is a technical analysis indicator for MetaTrader 5, designed to help traders monitor potential spike setups on compatible synthetic indices. The indicator combines signal monitoring, market-condition analysis, chart markers, notifications, and an on-chart information panel. It presents relevant market information in an organized format to help traders evaluate pote
Plus de l'auteur
VOLUME PROFILE SAF-XII Analyse Market Profile Professionnelle pour MT5 (L'indicateur idéal pour le trading de type Grid) QU'EST-CE QUE LE VOLUME PROFILE ? Le Volume Profile est un outil institutionnel qui affiche l'activité de trading à des niveaux de prix spécifiques, contrairement aux indicateurs de volume classiques qui montrent le volume en fonction du temps. Il révèle OÙ les transactions ont eu lieu, aidant ainsi à identifier : ZONES DE VALEUR (VAH/VAL) – Niveaux de prix où la majorité des
Cumulative Volume Delta (CVD) MA-X Plus : Le Framework Ultime de l'Order Flow Déverrouillez la mécanique cachée du marché avec le CVD MA-X Plus . Alors que les indicateurs de volume standards vous indiquent seulement les quantités échangées, le CVD MA-X Plus vous révèle qui gagne la bataille, quand elle est gagnée, et où le « smart money » est ancré. En agrégeant l'action du prix au niveau du tick (paramétrable sur Real Volume pour les marchés réglementés tels que les Actions/Futures/Or) et une
The Ultimate Ichimoku MTF Dashboard: Your All-In-One Trading Edge Transform Your Trading with One Powerful Indicator Imagine having a professional trading assistant that monitors multiple timeframes simultaneously, identifies high-probability entries, warns you of potential reversals, and provides clear risk management guidance-all in one clean, intuitive display. That's exactly what the Ichimoku MTF Dashboard delivers.     Why This Isn't Just Another In
QQE Kalman Hybrid  Smarter Trend Detection. Faster Entries. Cleaner Decisions. QQE Kalman Hybrid is built to help you act on what’s happening now. This momentum and trend confirmation indicator combines the proven structure of classic QQE logic with a modern Kalman adaptive engine designed to reduce lag, smooth noise, and surface high-quality trade opportunities earlier. The result is a clean, decision-focused tool that helps traders identify:  What’s the trend structure?  Where’s the best
FREE
MTF Connecting Fractals Multi-Timeframe Market Structure. One Glance. Real Decisions. MTF Connecting Fractals is not just another arrow-printing indicator. It’s a complete multi-timeframe market structure intelligence system designed to answer the most important trading questions in real time - clearly, visually, and without clutter. Built around fractals as objective structure anchors, this tool gives traders a decisive edge by combining price action, structural context, proximity risk, and
Critical Market Session Information with a Single Glance Stop juggling multiple tools and squinting at time zone converters. The SessionInfoDisplay Indicator is your new, indispensable trading co-pilot that puts real-time market intelligence directly on your chart.   What It Does: Your Essential Trading Dashboard   This intelligent indicator provides three critical pieces of information at a glance: 1. Real-Time Session Detection    - Automatically identifies which major financial session is act
FREE
Clr-Dynamic RSI v SMA Indicator : A Comprehensive Analysis of Features and Advantages The Clr-Dynamic RSI v SMA indicator represents a significant evolutionary leap in technical analysis tools, transforming the classic Relative Strength Index (RSI) from a potentially ambiguous oscillator into a sophisticated, multi-dimensional trading system. At its core, this indicator retains the mathematical foundation of the RSI, measuring the speed and change of price movements, but radically enhances its
MTF Candlestick Patterns Detector : Votre Centre de Commandement Price Action Ultime Dans le monde effréné du trading, manquer un seul schéma de retournement peut faire la différence entre une semaine profitable et une opportunité perdue. Le MTF Candlestick Patterns Detector est un indicateur MQL5 de qualité professionnelle conçu pour scanner, détecter et agréger simultanément plus de 24 figures de chandeliers légendaires sur toutes les unités de temps. Arrêtez de chasser les signaux et de devi
MTF VWAP Indicator - Quick Overview   This indicator shows you where institutional money is flowing across multiple timeframes using Volume Weighted Average Price (VWAP) to identify high-probability trading zones. New version has VWAP bands plotting capability if user enabled and display panel (whose background changes colour on confluence) can be toggled on/off.      What It Actually Does:     1. Tracks Smart Money Levels: - Shows Daily, Weekly, and Monthly VWAP lines where big players (banks,
Indicator Overview This is a sophisticated Multi-Timeframe (MTF) indicator that not only applies the classic Fisher Transform formula but integrates it into a comprehensive trading system featuring a real-time dashboard. The indicator excels at pinpointing reversals through advanced divergence detection and providing a clear, multi-timeframe view of market structure.     How It Works: Core Fisher Logic   1.   Normalization and Signal Generation         The indicator transforms price (using med
MTF WAD Simplified Indicator - Professional Trading Solution     Overview The MTF WAD Simplified is a sophisticated multi-timeframe volume-based indicator designed to track smart money flow across financial markets. By monitoring the Williams Accumulation/Distribution (WAD) across 8 different timeframes, this tool provides traders with unprecedented insight into institutional accumulation and distribution patterns.     Core Benefits for Traders     1. Smart Money Tracking - Detect Institutional
RSI v SMA MTF Indicator : Professional Trading Edge in One Tool   Summary The RSI v SMA MTF Indicator is a sophisticated, multi-timeframe momentum analysis tool that transforms the traditional RSI into a powerful, actionable trading system. By combining RSI slope analysis with SMA crossover signals, divergence detection, and real-time multi-timeframe confluence, this indicator provides traders with a more comprehensive view of market momentum across all relevant timeframes.     Core Utility an
Cumulative Volume Delta MA-X MTF (avec Momentum de Gradient) Cet indicateur effectue une analyse multi-temporelle du Delta de Volume Cumulé (CVD) pour MetaTrader 5. Il calcule la différence nette entre la pression acheteuse et vendeuse en analysant les données de volume réel ou de ticks, offrant ainsi une représentation visuelle du sentiment du flux d'ordres. Logique et Fonctionnalités de l'Indicateur L'indicateur utilise une approche mathématique pour l'analyse du volume : Sources de Données :
Cumulative Volume Delta (CVD) MA-X : Outil Intelligent de Sentiment du Flux d'Ordres Découvrez les mécanismes cachés du marché avec le Cumulative Volume Delta (CVD) MA-X . Alors que les indicateurs de volume standard vous indiquent seulement combien a été échangé, le CVD MA-X vous dit QUI gagne la bataille entre acheteurs et vendeurs et QUAND . En agrégeant l'action des prix au niveau du tick et la distribution du volume, cet indicateur fournit une carte cristalline de la conviction et de l'épu
Multi-Timeframe Money Flow Index (MTF MFI) with Smart Divergence and Dashboard Unlock the flow of institutional money across every timeframe. Are you tired of guessing the trend only to be trapped by a sudden reversal? The Multi-Timeframe Money Flow Index (MTF MFI) is a professional-grade trading tool designed to provide a bird's-eye view of market liquidity and momentum. By aggregating volume-weighted data from W1 down to M1, this indicator eliminates noise and highlights high-probability tra
MTF Parabolic SAR Maximize your trading efficiency with the Multi-Timeframe Parabolic SAR Trend and Momentum Dashboard. Designed for serious traders who value clarity over clutter, this tool aggregates price action across six timeframes into a single, sleek visual interface.  By combining that reliable classic Parabolic SAR logic with advanced momentum scoring and risk assessment, this indicator transforms raw data into actionable trade signals.  The Strategic Edge: Why This Indicator? Most tra
Multi-Timeframe Heiken Ashi (Smoothed with Dashboard) Professional Market Structure Visualization with Weighted Confluence Scoring Transform your trading with crystal-clear multi-timeframe analysis. This indicator combines smoothed Heiken Ashi candles with an intelligent weighted scoring system to give you unprecedented clarity in any market condition. YOUR TRADING QUESTIONS – ANSWERED INSTANTLY: 1. What's the REAL trend direction? Dashboard Reveals:   Higher timeframe (MN1, W1, D1, H4) trend a
Hybrid BB-LRMA [Trend and Volatility Engine]   Master the markets with the Hybrid BB-LRMA, a professional-grade technical analysis tool that fuses the volatility-tracking power of Bollinger Bands (BB) with the hyper-responsive Linear Regression Moving Average (LRMA) to eliminate lag and pinpoint high-probability entries with arrow Signals   Why Hybrid BB-LRMA? Most moving averages are too slow, and Bollinger Bands alone can be noisy. The Hybrid BB-LRMA solves this by using a gradient-based LRMA
Hybrid FATL Fractal: Professional Digital-Signal Logic   Simplify the Complexity of Market Structure.   Unlock the power of digital signal processing combined with price action geometry. The Hybrid FATL Fractal is a professional-grade technical analysis tool designed to eliminate market noise and pinpoint high-probability institutional turning points. By merging the Fast Adaptive Trend Line (FATL) algorithm with Dynamic Fractal Breakout logic, this indicator provides a dual-layered filter that a
Fisher Transform MTF Pro v4.03 Professional Multi-Timeframe Trading Decision System Fisher Transform MTF Pro turns complex multi-timeframe data into clear, actionable trade decisions in seconds. It answers instantly:  What’s the trend?  Where’s the entry?  How strong is the setup?  What are the risks?  Should I buy, sell, or wait?  The Edge   Zero-Line Filter (Trend Protection) Prevents counter-trend trades by default:  No buys above zero  No sells below zero This forces alignment with th
Turtles Professional v2.0 The Legendary Turtle Strategy, Reimagined for the Modern Trader Turtles Pro transforms the iconic 1980s Turtle Trading System into a high-performance, multi-timeframe decision engine. It eliminates guesswork by providing institutional-grade analysis on trend structure, entry quality, and volatility all on a single chart. The Strategic Edge Turtles Professional uses a Smart Weighted Bias Engine to prioritize higher time frames, ensuring your trades align with the d
Hybrid Hull-LSMA : The Trend Meets Momentum Powerhouse Are you struggling with moving averages that are either too slow to react or too noisy to trust? The Hybrid Hull-LSMA is a solution, engineered to solve the "lag vs. noise" dilemma. By fusing the ultra-smooth Hull Moving Average (HMA) with the predictive Least Squares Moving Average (LSMA), this indicator delivers a high-definition view of market structure and entry timing. Why the Hybrid Hull-LSMA? Standard indicators follow the market; t
T3 MTF PureMaths : Indicateur Tillson T3 Multi-Timeframe Système de Trading de Confluence Sans Latence avec Dashboard Interactif L’avantage stratégique de l’analyse multi-unités de temps T3 MTF Pure Maths est un tableau de bord de trading de qualité professionnelle qui agrège la structure du marché sur 8 unités de temps simultanément – du mensuel jusqu'au graphique 5 minutes. Il vous offre des perspectives exploitables instantanément, sans changer de graphique et sans calcul mental. Conçu avec
Divergent Fisher Transform MT5  Precision Momentum. Intelligent Filtering. EA-Ready Automation. The Divergent Fisher Transform for MT5 is a professional-grade momentum trading indicator designed to help traders answer the most important question in the market: “What should I do right now?” It transforms raw price into high-probability, structured trading decisions using a powerful combination of:  Fisher Transform momentum modeling  Zero-line structural filtering  Multi-level overbought/o
Divergent Stochastic Filter II Catch Reversals Early, Filter Noise, Trade with Confidence The Edge: Why This Stochastic is Different  Every trader knows the Stochastic oscillator. But knowing when to trust its signals, that's the real challenge. The Divergent Stochastic Filter II transforms this classic indicator into a precision reversal detection system by adding critical elements: divergence intelligence, signal filtering and exhaustion detection.  While standard Stochastic oscillators fire s
X-Hybrid Modular Z – Plateforme d'Intelligence d'Exécution Transformez n'importe quel indicateur en un système de trading entièrement automatisé X-Hybrid Modular Z est un moteur d'exécution modulaire qui convertit n'importe quel indicateur personnalisé bien conçu en un système de trading automatique complet. Conçu pour les traders exigeant une exécution de niveau professionnel et un contrôle rigoureux des risques, il comble le fossé entre la génération de signaux et la gestion de transactions d
Hybrid FATL-LRMA : Digital Precision Meets Statistical Certainty The Ultimate Trend-Momentum Convergence System with clear action protocols. Why Hybrid FATL-LRMA? The Edge some Traders Miss Are you tired of lagging indicators that signal entries after the move has already happened? Frustrated by noisy oscillators that keep you in chop while trends pass you by? The Hybrid FATL-LRMA is a dual-engine trading system that bridges the gap between high-frequency digital signal processing and stat
ADX ClrDynamic Slope-Aware, Low-Lag Trend & Momentum Engine Tired of lagging indicators that signal a trend only after the move is over? Traditional ADX calculations are often too slow for modern market volatility. ADX ClrDynamic bridges this gap by combining customizable low-lag smoothing algorithms (EMA, SMA, Wilder, or Hull Acceleration) with slope-aware momentum logic, giving you a lean, high-precision decision engine for timing trend entries and exits. Key Trading Questions Answered What is
SERA - Sigma-Enhanced Regression Analysis – The Non-Repaint, Early-Entry MTF Trading System The Problem with Most Regression Tools (And How We Solved It) Traditional regression indicators lie to you. They repaint, they lag, and distort actionable data. Their flaws cost you in false back-tests, late entries/exits and therefore missed profits. Avoid catching a falling knife or chasing a train with SERA, she eliminates ALL three problems. One-Click Trading Style Selection – Choose Conservative, R
La logique des Bandes Tricolores Optimisées priorise la visibilité de l'action du prix tout en maintenant la détection du Squeeze (compression). 1. Le Sélecteur de Philosophie : Tradez à votre manière Le paramètre SignalMode vous permet de choisir comment l'indicateur interprète les contacts avec les bandes. Considérez cela comme votre personnalité de trading : Quand le prix touche la... Mode BREAKOUT (Suiveur de tendance) Mode BOUNCE (Chasseur de retournement) Mode AUTO (Polyvalent) Bande Supé
Filtrer:
Aucun avis
Répondre à l'avis