Hidden Markov Model 4

HMM4 Indicator Documentation HMM4 Indicator Documentation

Introduction

The HMM4 indicator is a powerful technical analysis tool that uses a 4-Gaussian Hidden Markov Model (HMM) to identify market regimes and predict potential market direction. This indicator applies advanced statistical methods to price data, allowing traders to recognize bull and bear market conditions with greater accuracy.

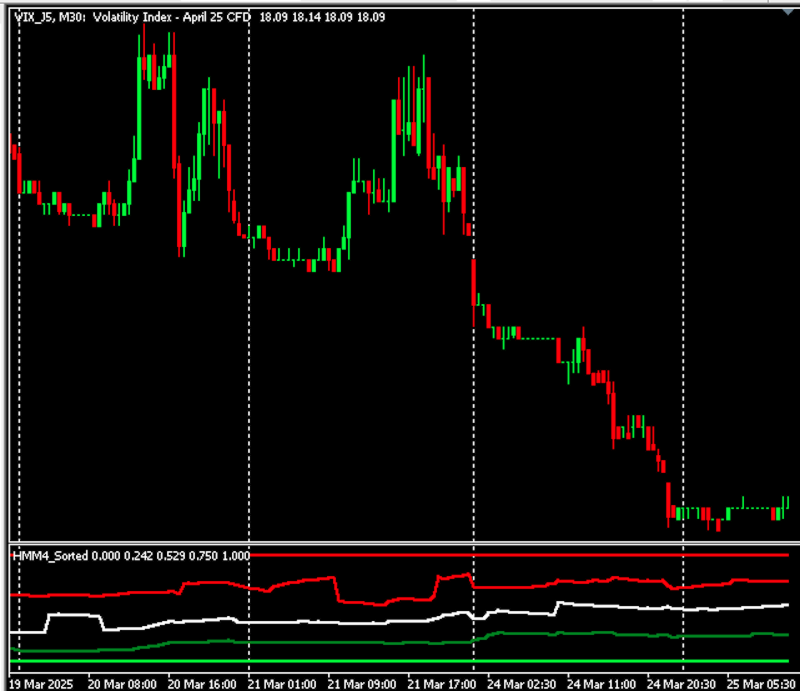
The indicator displays a stacked line chart in a separate window, representing the mixture weights of four different Gaussian components. These weights provide valuable insights into the current market state and can be used to make informed trading decisions.

Theoretical Background

Hidden Markov Models and Gaussian Mixtures

A Hidden Markov Model (HMM) is a statistical model where the system being modeled is assumed to be a Markov process with unobservable (hidden) states. In financial markets, these hidden states can represent different market regimes such as bull markets, bear markets, and transitional phases.

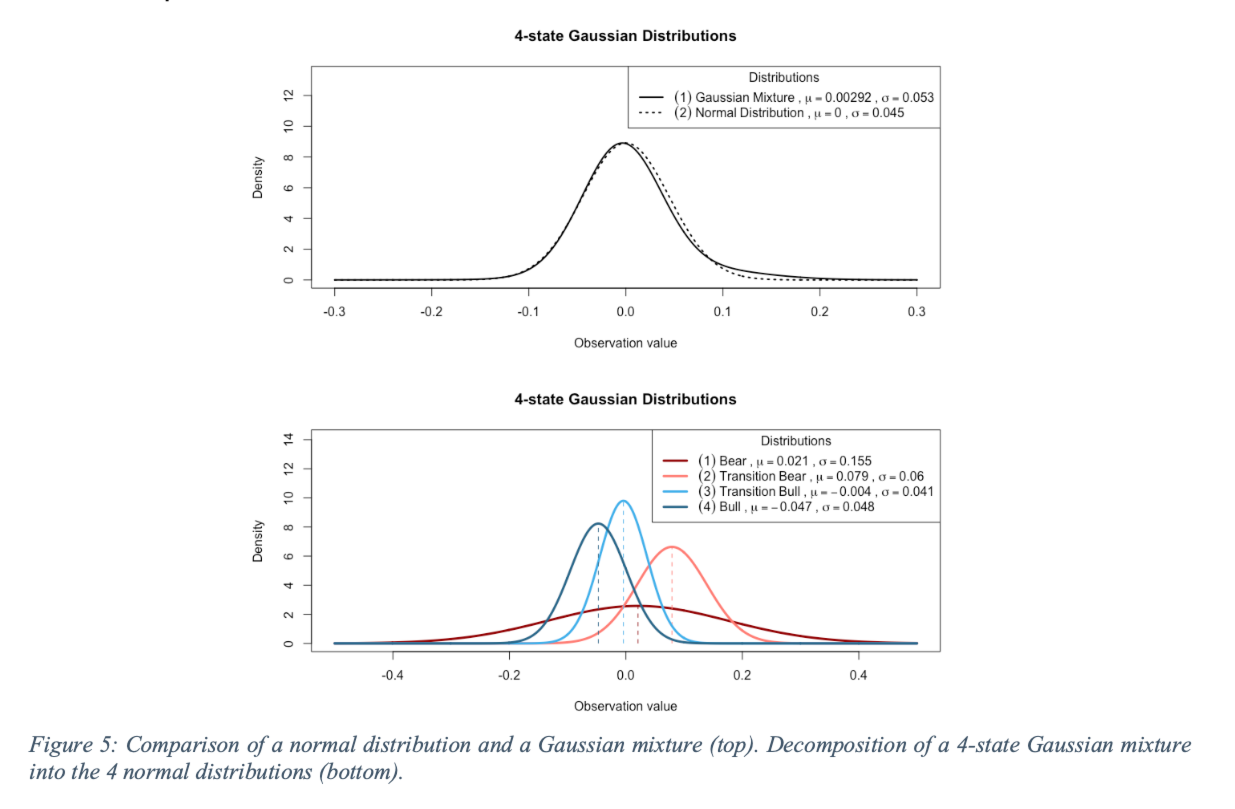
The HMM4 indicator uses a continuous HMM with a Gaussian mixture model. This approach models the price data as a mixture of four Gaussian (normal) distributions, each representing a different market state. The key advantage of this approach is that it can model non-normal distributions that are commonly observed in financial time series.

Market Regimes and Weight Interpretation

The four Gaussian components in the model can be interpreted as different market regimes:

  1. Bear State - Associated with increasing volatility and often negative price movement
  2. Transition Bear - Transitional phase moving toward bearish conditions
  3. Transition Bull - Transitional phase moving toward bullish conditions
  4. Bull State - Associated with decreasing volatility and often positive price movement

The weights of these components represent the probability of the market being in each state. These weights always sum to 1 (or 100%), making them easy to interpret as percentages.

Bull/Bear Market Identification

A key insight for trading is that the cumulative weight of the first two components (weight1+weight2) can be used to identify bull and bear markets:

  • When weight1+weight2 > 50%, this indicates a bull market
  • When weight1+weight2 < 50%, this indicates a bear market

This simple rule provides a clear signal for potential market direction and can be used as part of a trading strategy.

Indicator Features

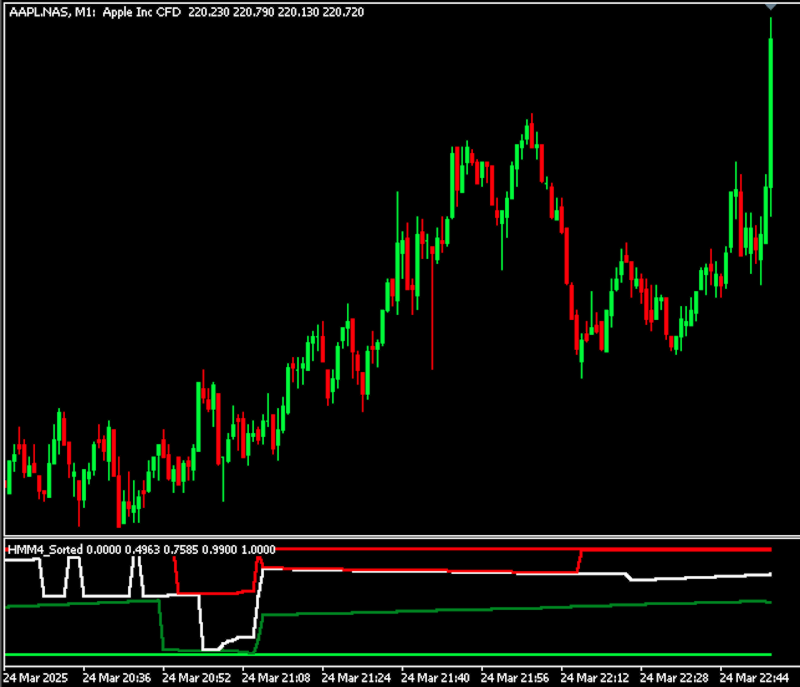
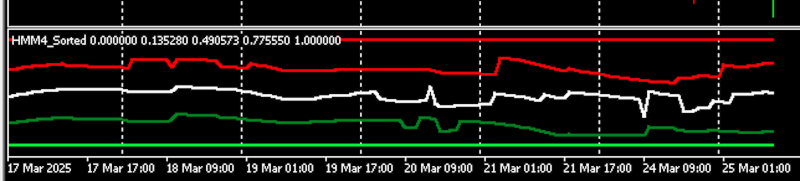
Visual Representation

The HMM4 indicator displays a stacked line chart in a separate window with five plots:

  1. Weight Zero (bottom layer, lime color) - Always 0, serves as the baseline
  2. Weight 1 (green color) - First component weight
  3. Weight 1+2 (dark green color) - Cumulative sum of first and second component weights
  4. Weight 1+2+3 (dark red color) - Cumulative sum of first, second, and third component weights
  5. Weight 1+2+3+4 (red color) - Always 1.0, as all weights sum to 1

Sorting Mechanism

The indicator sorts the Gaussian components based on the product of their means and variances (μ·σ²). This sorting ensures consistent identification of the states across different time periods, with the most positive means with the biggest standard deviations ranked first (most bearish) and the most negative means ranked last (most bullish).

Input Parameters

The HMM4 indicator has the following input parameters:

  • TrainingBars (default: 100) - Number of bars to use for training the model. If fewer bars are available, the indicator will use all available data.
  • EMIterations (default: 10) - Number of iterations for the Expectation-Maximization algorithm. Higher values may provide more accurate results but take longer to calculate.
  • StartBarsAgo (default: 1000) - Number of bars ago to start the calculation. This determines the initial historical data used.
  • UseFixedStartPoint (default: false) - When true, the indicator uses a fixed start point for training data. When false, it uses a sliding window approach.
  • LineWidth (default: 1) - Width of the lines in the subplot. Adjust this value (1-5 recommended) to change the thickness of the displayed lines.

Trading Applications

Market Regime Identification

The primary use of the HMM4 indicator is to identify the current market regime. By observing the stacked weights, traders can determine whether the market is in a bullish or bearish state.

Trading Signals

The indicator can be used to generate trading signals based on the cumulative weights:

  1. Bull Market Signal - When the cumulative weight of the first two components (Weight 1+2) exceeds 50%, this suggests a bullish market environment. Traders might consider long positions or holding existing long positions.
  2. Bear Market Signal - When the cumulative weight of the first two components falls below 50%, this suggests a bearish market environment. Traders might consider short positions or reducing exposure to the market.

Integration with Other Indicators

For best results, the HMM4 indicator should be used in conjunction with other technical indicators and price action analysis. It works well as a confirmation tool for trend-following strategies and can help identify potential market turning points.

Technical Implementation

EM Algorithm

The indicator uses the Expectation-Maximization (EM) algorithm, specifically a simplified Baum-Welch style algorithm, to train the Hidden Markov Model. This iterative algorithm finds the maximum likelihood estimates of the model parameters.

Retraining Process

The indicator retrains on each new bar by accumulating data. This adaptive approach allows the model to evolve as market conditions change, providing up-to-date insights into the current market regime.

Global Published Values for EA Access

The indicator provides global published values with the HMM4_ prefix that can be accessed by Expert Advisors (EAs). These values represent the most recent calculated weights and are updated on each new bar:

  • HMM4_Weight1 - First component weight
  • HMM4_Weight2 - Second component weight
  • HMM4_Weight3 - Third component weight
  • HMM4_Weight4 - Fourth component weight
  • HMM4_CumWeight1 - Cumulative weight 1 (same as Weight1)
  • HMM4_CumWeight2 - Cumulative weight 1+2
  • HMM4_CumWeight3 - Cumulative weight 1+2+3

EAs can access these values directly when the indicator is included in the EA's chart. This allows for easy implementation of automated trading strategies based on the HMM4 indicator's market regime identification. For example, an EA could implement a simple strategy that goes long when HMM4_CumWeight2 > 0.5 (bull market) and short when HMM4_CumWeight2 < 0.5 (bear market).

Calculation Process

For each bar in the calculation range:

  1. The indicator determines the training window based on the UseFixedStartPoint parameter
  2. It creates a temporary array for the training window and fills it with close prices
  3. The HMM training is run on this window to determine the mixture weights
  4. The weights are sorted based on the product of means and variances
  5. The indicator buffers are updated with the cumulative weights for the stacked line plot
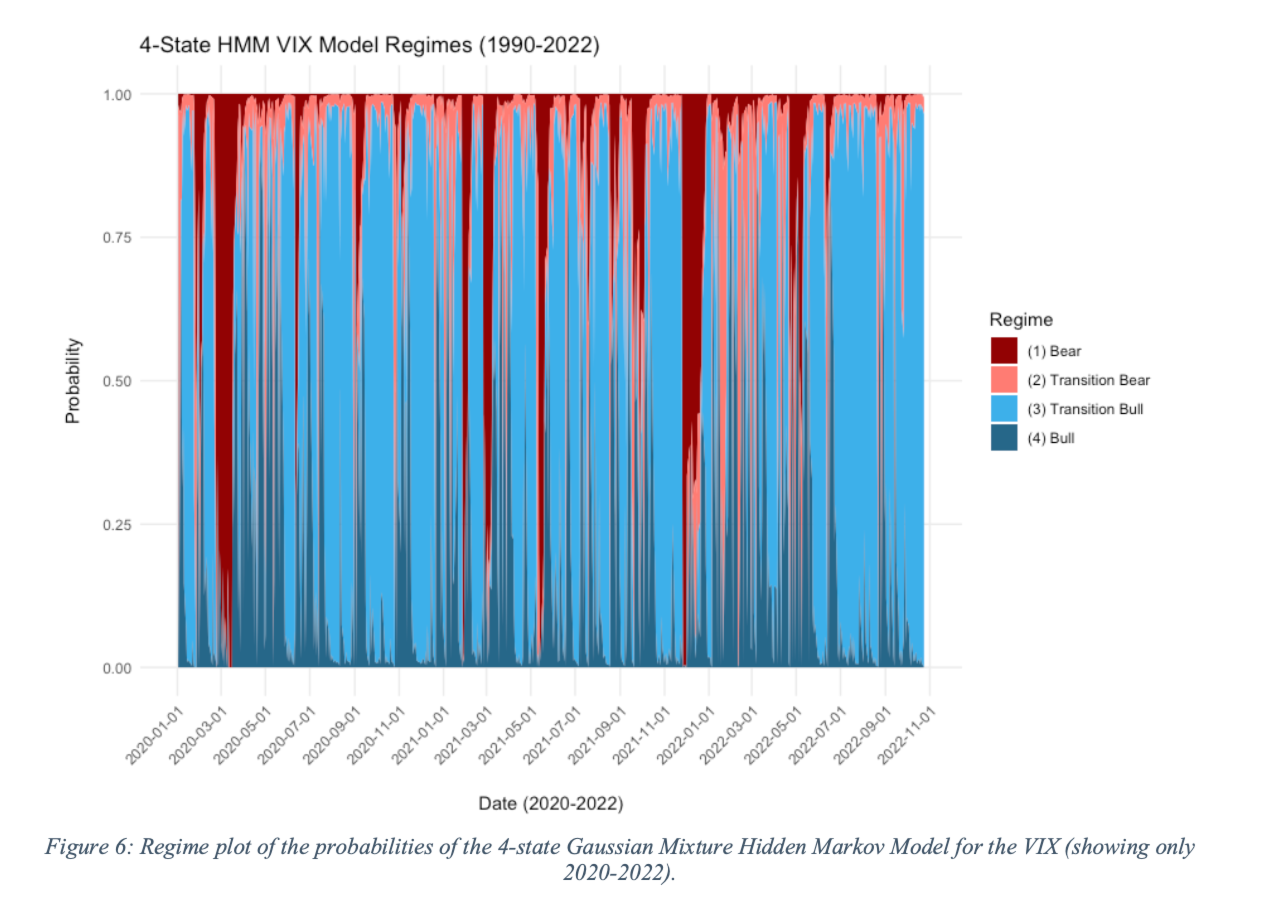
Comparison with VIX

While the original research for this model was applied to the VIX (CBOE Volatility Index), the HMM4 indicator can be applied to any financial instrument. The advantage of this approach is that it doesn't require a specific volatility index like the VIX to identify market regimes.

The indicator directly analyzes price data to identify different market states, making it applicable to any market including forex, commodities, stocks, and indices. This versatility makes it a valuable tool for traders across different markets.

Conclusion

The HMM4 indicator provides a sophisticated statistical approach to market analysis. By modeling price data as a mixture of Gaussian distributions, it can identify different market regimes and provide valuable insights for trading decisions.

The key advantage of this indicator is its ability to quantify the probability of the market being in different states, with a simple rule for identifying bull and bear markets based on the cumulative weights. This makes it a powerful tool for both discretionary and systematic traders.

By adjusting the input parameters and combining the indicator with other technical analysis tools, traders can develop robust trading strategies that adapt to changing market conditions.


Produits recommandés
Advanced MT5 Indicator: Precision-Powered with Pivot Points, MAs & Multi-Timeframe Logic Unlock the full potential of your trading strategy with this precision-engineered MetaTrader 5 indicator —an advanced tool that intelligently blends Pivot Points , Adaptive Moving Averages , and Multi-Timeframe Analysis to generate real-time Buy and Sell signals with high accuracy.    If you want to test on Real Market, Let me know. I will give the Demo file to run on Real Account.    Whether you're a scal
Price Magnet — Price Density and Attraction Levels Indicator Price Magnet is a professional analytical tool designed to identify key support and resistance levels based on statistical Price Density. The indicator analyzes a specified historical period and detects price levels where the market spent the most time. These zones act as “magnets,” attracting price action or forming a structural base for potential reversals. Unlike traditional Volume Profile tools, Price Magnet focuses on price-time d
RBreaker
Zhong Long Wu
RBreaker Gold Indicators est une stratégie de trading intraday à court terme pour les contrats à terme sur l'or, qui combine deux approches : le suivi de tendance et le retournement intraday. Elle permet non seulement de capturer les profits dans les marchés en tendance, mais aussi de prendre des bénéfices en temps opportun lors des retournements de marché et d'ouvrir une position en sens inverse. Cette stratégie a été classée pendant 15 années consécutives parmi les dix stratégies de trading l
Noize Absorption Index - is the manual trading system that measures the difference of pressure between bears forces and bulls forces. Green line - is a noize free index that showing curent situation. Zero value of index shows totally choppy/flat market.Values above zero level shows how powerfull bullish wave is and values below zero measures bearish forces.Up arrow appears on bearish market when it's ready to reverse, dn arrow appears on weak bullish market, as a result of reverse expectation.
Level Volume Pro
John Samfel Bucton Josol
HAT IT DOES   MONTHLY HIGH & LOW — AUTO-DRAWN EVERY MONTH Draws the High and Low of every month for the current year (or any year you set). Each level extends as a horizontal ray into the future so you always see where price is reacting to historical monthly extremes. Color-coded (blue = high, red = low), labeled (JAN HIGH, FEB LOW etc.), fully customizable width and style. Toggle individual months on or off.   WEEKLY HIGH & LOW
Fit line supports to extrapolation next movement of market, support for buy/sell decision. Indicator using spline algorithm to extrapolation.  You can change number of spline with parameter "PointsNumber" and number of extrapolation point with "ExtrapolateBars". Eextrapolation points will be save into csv format, with prefix in parameter "PointsPrefix", and store in folder File of Data Folder.
TRI Visualizer
Yoshimi Mon 三 Ura
TRI Visualizer MT5 – Thermodynamic Market Analysis Overview The TRI (Thermal Range Indicator) Visualizer Enhanced is a rare market analysis indicator that goes beyond conventional technical analysis, applying principles of thermodynamics from physics. It interprets market price fluctuations as “thermodynamic energy,” enabling the highly accurate detection of subtle market changes that are often overlooked. Innovative Mechanisms 1. Dual Calculation Engines Classic TRI Mode Formula: |Close
Donchian Breakout And Rsi
Mattia Impicciatore
4.5 (2)
Description générale Cet indicateur est une version améliorée du Canal Donchian classique, enrichie de fonctionnalités pratiques pour le trading réel. En plus des trois lignes standard (supérieure, inférieure et ligne médiane), le système détecte les cassures et les affiche visuellement avec des flèches sur le graphique, en montrant uniquement la ligne opposée à la direction actuelle de la tendance pour une lecture plus claire. L’indicateur comprend : Signaux visuels : flèches colorées lors des
FREE
Le niveau Premium est un indicateur unique avec une précision de plus de 80 % des prédictions correctes ! Cet indicateur a été testé par les meilleurs Trading Specialists depuis plus de deux mois ! L'indicateur de l'auteur que vous ne trouverez nulle part ailleurs ! À partir des captures d'écran, vous pouvez constater par vous-même la précision de cet outil ! 1 est idéal pour le trading d'options binaires avec un délai d'expiration de 1 bougie. 2 fonctionne sur toutes les paires de devises
CosmiCLab SMC FIBO CosmiCLab SMC FIBO is a professional trading indicator designed for traders who use Smart Money Concepts (SMC), market structure analysis and Fibonacci retracement levels. The indicator automatically detects market swings and builds Fibonacci levels based on the latest impulse movement. It also identifies market structure changes such as BOS (Break of Structure) and CHOCH (Change of Character), helping traders understand the current market direction. CosmiCLab SMC FIBO also pr
L'Indice Directionnel Moyen (ADX) Scanner Multidevises MT5 est un indicateur de trading avancé conçu pour analyser simultanément plusieurs paires de devises. Il bénéficie aux traders cherchant à améliorer leur processus de prise de décision en fournissant des signaux en temps réel basés sur l'Indice Directionnel Moyen, permettant une analyse efficace des tendances du marché. Cet outil simplifie l'expérience de trading en facilitant l'identification de la force des tendances et du mouvement direc
KT Renko Patterns MT5
KEENBASE SOFTWARE SOLUTIONS
KT Renko Patterns analyse le graphique Renko brique par brique afin de détecter des figures techniques bien connues, fréquemment utilisées par les traders sur divers marchés financiers. Par rapport aux graphiques basés sur le temps, les Renko offrent une vue épurée, rendant les figures plus faciles à reconnaître et à exploiter. KT Renko Patterns comprend plusieurs figures Renko, dont la majorité sont expliquées en détail dans le livre “Profitable Trading with Renko Charts” de Prashant Shah. Un
The   Trendlines Oscillator   helps traders identify trends and momentum based on the normalized distances between the current price and the most recently detected bullish and bearish trend lines. The indicator features bullish and bearish momentum, a signal line with crossings, and multiple smoothing options. USAGE The   Trendlines Oscillator   works by systematically: Identifying pivot highs and lows. Connecting pivots to form bullish (support) and bearish (resistance) trendlines. Measuring
Buy Sell Chill Indicator
Santino Emanuele Ventre
Take the stress out of trading with the Buy Sell Chill Indicator —your ultimate companion for effortless trend identification. This easy-to-use tool gives you a clear visual arrow to show the direction the market is about to take, making trading decisions as simple and "chill" as possible. Why Choose the Buy Sell Chill Indicator? Relaxed and Intuitive : Designed to make trading less stressful and more enjoyable by giving you straightforward signals with no clutter. Customizable Features : ATR Pe
RBM Delta Gold
Renato Brendim Medici
Gold does not move only because of price. It moves because of aggression, imbalance, and market flow. The Delta Indicator was created to reveal exactly that. The RBM Trader Delta Indicator for XAUUSD identifies the difference between aggressive buyers and sellers, helping traders detect real market pressure before the movement becomes obvious on the chart. While most traders focus only on candles, Delta shows what is happening behind price action. This indicator was specially developed for
Follow The Line MT5
Oliver Gideon Amofa Appiah
4.6 (35)
This indicator obeys the popular maxim that: "THE TREND IS YOUR FRIEND" It paints a GREEN line for BUY and also paints a RED line for SELL. (you can change the colors). It gives alarms and alerts of all kinds. IT DOES NOT REPAINT and can be used for all currency pairs and timeframes. Yes, as easy and simple as that. Even a newbie can use it to make great and reliable trades. NB: For best results, get my other premium indicators for more powerful and reliable signals. Get them here: https://www.m
FREE
SophieSMC One is a premium Smart Money Concepts indicator designed specifically for XAUUSD (Gold) traders who want a cleaner, more structured and institutional approach to the market. Built around real market structure concepts, SophieSMC One combines multiple Smart Money Concepts tools into one powerful and visually clean trading system for MetaTrader 5. FEATURES: • BOS & CHoCH market structure detection • Fair Value Gap (FVG) identification • Liquidity sweep visualization • Order Block recog
High Low Open Close
Alexandre Borela
4.98 (44)
Si vous aimez ce projet, laissez un examen 5 étoiles. Cet indicateur tire les prix ouverts, élevés, bas et de fermeture pour les prix spécifiés période et il peut être ajusté pour un fuseau horaire spécifique. Il s ' agit là d ' un niveau important qui s ' intéresse à de nombreux domaines institutionnels et professionnels. traders et peut être utile pour vous de connaître les endroits où ils pourraient être plus active. Les périodes disponibles sont les suivantes : Jour précédent. Semaine pré
FREE
L'indicateur SMC Venom Model BPR est un outil professionnel pour les traders travaillant dans le concept Smart Money (SMC). Il identifie automatiquement deux modèles clés sur le graphique des prix: FVG   (Fair Value Gap) est une combinaison de trois bougies, dans laquelle il y a un écart entre la première et la troisième bougie. Forme une zone entre les niveaux où il n'y a pas de support de volume, ce qui conduit souvent à une correction des prix. BPR   (Balanced Price Range) est une combinaiso
Renko System
Marco Montemari
This indicator can be considered as a trading system. It offers a different view to see the currency pair: full timeless indicator, can be used for manual trading or for automatized trading with some expert advisor. When the price reaches a threshold a new block is created according to the set mode. The indicator beside the Renko bars, shows also 3 moving averages. Features renko mode median renko custom median renko 3 moving averages wicks datetime indicator for each block custom notification
Créez vos propres EA de trading haute fréquence avec Quantum Flash Nous avons tous entendu parler des constructeurs et des générateurs dans le trading, mais avez-vous déjà essayé Quantum Flash ? C'est un générateur révolutionnaire qui vous aide à créer vos propres conseillers experts (EA) de trading haute fréquence (HFT) avec le code source complet ! Comment fonctionne Quantum Flash ? Quantum Flash utilise un algorithme intelligent qui utilise la génération aléatoire pour créer votre EA HFT. A
HAS RSI Signal — Indicateur de Tendance Professionnel avec Calcul SL/TP HAS RSI Signal est un outil de trading puissant combinant des classiques éprouvés et des algorithmes modernes de filtrage du bruit. L'indicateur analyse le marché à travers le prisme des bougies Heiken Ashi Smoothed (HAS) et de l'oscillateur RSI , offrant au trader des signaux d'entrée clairs lors des retournements de tendance ou des sorties de zones de surachat/survente. Principaux Avantages : Double Filtrage : L'utilisatio
## Description complète de l’indicateur WPRV2 L’indicateur **WPRV2** est une version améliorée du classique outil d’analyse technique appelé « Pourcentage de Williams » (%R). Il est principalement utilisé dans les marchés financiers tels que les places boursières, le Forex et les plateformes de cryptomonnaies pour analyser les tendances du marché et déterminer les meilleurs moments d’entrée et de sortie sur les transactions. ### Objectif de l’indicateur Le but principal de l’indicateur WPRV2
The indicator displays a matrix of indicators across multiple timeframes with a sum total and optional alert. Custom indicators can also be added to the matrix, in a highly configurable way. The alert threshold can be set to say what percentage of indicators need to be in agreement for an alert to happen. The alerts can turned on/off via on chart tick boxes and can be set to notify to mobile or sent to email, in addition to pop-up. The product offers a great way to create an alert when multiple
Best SAR MT5
Ashkan Hazegh Nikrou
4.33 (3)
La description :  nous sommes heureux de vous présenter notre nouvel indicateur gratuit basé sur l'un des indicateurs professionnels et populaires du marché des changes (PSAR). Cet indicateur est une nouvelle modification de l'indicateur SAR parabolique original. Dans l'indicateur pro SAR, vous pouvez voir un croisement entre les points et le graphique des prix. le croisement n'est pas un signal mais parle du potentiel de fin de mouvement, vous pouvez commencer à acheter par un nouveau point b
FREE
##   ONLY GOLD ##   Тiльки Золото ## **Mercaria Professional Trading Zones - Complete Guide** ## **Mercaria Professional Trading Zones - Повний посібник** ### **How Mercaria Zones Work / Як працюють зони Mercaria** **English:** Mercaria Zones is an advanced trading indicator that identifies high-probability support and resistance areas using ZigZag extremes combined with mathematical zone calculations. The indicator works on multiple timeframes simultaneously, providing a comprehensive view
Protocol
Vincent Georges David Ferrier
PROTOCOL - Institutional Liquidity Grab & SMC Elite Liquidity Grab & Advanced SMC Execution ( MT4 Available here ) Dynamic Trend Sniper MT5 (available here) LIMITED RELEASE & PRICING NOTICE Launch Special: Available for $299 USD for the first 7 days only . After this period, the price will strictly increase to $399 USD. Prop Firm Protection Protocol: Major Prop Firms enforce strict copy-trading and trade-crowding policies. To protect the statistical edge of this algorithm and ensure our
Ultimate Boom and Crash Indicator The Ultimate Boom and Crash Indicator is a cutting-edge tool developed by  Coetsee Digital , designed to identify potential spike opportunities in the market. Crafted for traders focusing on Deriv and Weltrade synthetic markets, this indicator is optimized to operate exclusively on the 3-minute (M3), 5-minute (M5), 15-minute (M15), 30-minute (M30), and 1-hour (H1) timeframes and supports only the following pairs: PainX 1200, PainX 999, PainX 800, PainX 600, Pai
L'indicateur montre des modèles harmoniques sur le graphique   sans repeindre   avec le minimum de décalage possible. La recherche de sommets d'indicateurs est basée sur le principe des vagues de l'analyse des prix. Les paramètres avancés vous permettent de choisir les paramètres de votre style de trading. À l'ouverture d'une bougie (barre), lorsqu'un nouveau motif se forme, une flèche de la direction probable du mouvement des prix est fixée, qui reste inchangée. L'indicateur reconnaît les modèl
QM Pattern Scanner MT5
Reza Aghajanpour
5 (4)
Contact me  to send you instruction and add you in group. QM (Quasimodo) Pattern is based on Read The Market(RTM) concepts. The purpose of this model is to face the big players of the market (financial institutions and banks), As you know in financial markets, big traders try to fool small traders, but RTM prevent traders from getting trapped. This style is formed in terms of price candles and presented according to market supply and demand areas and no price oscillator is used in it. RTM conc
Les acheteurs de ce produit ont également acheté
Neuro Poseidon MT5
Daria Rezueva
4.97 (34)
Neuro Poseidon is a new indicator by Daria Rezueva. It combines precise trading signals with adaptive TP/SL levels - creating best possible trades as a result! Message me and get  Neuro Poseidon Assistant  as a gift to automize your trading process! What makes it stand out? 1. Proven profitability on all assets and timeframes 2. Only confirmed BUY and SELL signals present on the chart 3. Adaptive TP & SL levels generated by the software for each trade 4. Easy to understand - suitable for al
SuperScalp Pro
Van Minh Nguyen
4.65 (26)
SuperScalp Pro – Système avancé d’indicateur de scalping multi-filtres SuperScalp Pro est un indicateur de scalping avancé qui combine le Supertrend classique avec plusieurs filtres de confirmation intelligents afin d’identifier les opportunités de trading. Il fonctionne efficacement sur plusieurs unités de temps, de M1 à H4, avec des performances optimisées sur XAUUSD, BTCUSD et les principales paires Forex. L’indicateur fournit des signaux d’achat et de vente clairs, ainsi que des niveaux d’en
Commençons par être honnêtes. Aucun indicateur ne vous rendra rentable à lui seul. Si quelqu’un vous dit le contraire, il vous vend un rêve. Tout indicateur qui affiche des flèches parfaites d’achat/vente peut être rendu impeccable — il suffit de zoomer sur la bonne partie de l’historique et de capturer uniquement les trades gagnants. Nous ne faisons pas cela.  SMC Intraday Formula est un outil. Il lit la structure du marché pour vous, identifie les zones de prix à la probabilité la plus élevée
Divergence Bomber
Ihor Otkydach
4.9 (90)
Chaque acheteur de cet indicateur reçoit également gratuitement : L’outil exclusif « Bomber Utility », qui accompagne automatiquement chaque opération de trading, fixe les niveaux de Stop Loss et de Take Profit, et clôture les positions selon les règles de la stratégie Des fichiers de configuration (set files) pour adapter l’indicateur à différents actifs Des set files pour configurer le Bomber Utility selon différents modes : « Risque Minimum », « Risque Équilibré » et « Stratégie d’Attente » U
Entry In The Zone and SMC Multi Timeframe is a real-time 2-in-1 market analysis tool that combines market structure analysis and a No Repaint BUY / SELL signal system into a single indicator, built on Smart Money Concepts (SMC) — a widely adopted framework used by professional traders to understand market structure. This indicator helps you see the market more clearly, make decisions based on structure rather than guesswork, and focus on high-probability zones where price is more likely to react
Quantum TrendPulse
Bogdan Ion Puscasu
5 (25)
Présentation de   Quantum TrendPulse   , l'outil de trading ultime qui combine la puissance de   SuperTrend   ,   RSI   et   Stochastic   dans un seul indicateur complet pour maximiser votre potentiel de trading. Conçu pour les traders qui recherchent précision et efficacité, cet indicateur vous aide à identifier les tendances du marché, les changements de dynamique et les points d'entrée et de sortie optimaux en toute confiance. Caractéristiques principales : Intégration SuperTrend :   suivez f
Ce produit a été mis à jour pour le marché 2026 et optimisé pour les dernières versions de MT5. AVIS DE MISE À JOUR DU PRIX : Smart Trend Trading System est actuellement disponible à $99 . Le prix passera à $199 après les 30 prochains achats . OFFRE SPÉCIALE : Après avoir acheté Smart Trend Trading System, envoyez-moi un message privé pour recevoir Smart Universal EA GRATUITEMENT et transformer vos signaux Smart Trend en trades automatisés. Smart Trend Trading System est un système de trading c
M1 Quantum MT5
Hamed Dehgani
5 (1)
M1 Quantum est un système de trading professionnel pour M1 qui fournit des signaux rapides et précis avec Stop Loss, Take Profit et une gestion intelligente du capital intégrés. M1 Quantum contient un système professionnel de gestion du capital conçu pour faire croître le compte rapidement en se concentrant sur les gains consécutifs . Fonctionnalités principales de l' indicateur M1 Quantum Conçu pour l' unité de temps M1 et toutes les paires majeures Toutes les transactions ont un Stop Loss et u
SignalTech is an unique fully rule based trading system delivers an Institutional approach for both Independent Traders and Prop Firm Challengers. Never Repaint. Push Notification available. No over-optimization. All the winning trades with chart setups are published on the comments page. 2026-05 4107 Pips (Until 05-29 NY Closed) 2026-04 2243 Pips 2026-03 2165 Pips 2026-02 2937 Pips 2026-01 2624 Pips 2025-12 1174 Pips It can generate signals with Buy/Sell Arrows, Push Notification (To Mobile) an
Trend Catcher ind mt5
Ramil Minniakhmetov
5 (5)
INDICATEUR DE DÉTECTEUR DE TENDANCE L'indicateur de détecteur de tendance analyse les mouvements de prix du marché grâce à une combinaison d'indicateurs d'analyse de tendance adaptatifs, propriétaires et personnalisés. Il identifie la véritable direction du marché en filtrant les fluctuations à court terme et en se concentrant sur la force de la dynamique sous-jacente, l'expansion de la volatilité et la structure des prix. Il utilise également une combinaison d'indicateurs personnalisés de lis
PrimeScalping
Temirlan Kdyrkhan
PrimeScalping is a powerful trading companion designed to generate high-probability entry signals with dynamic TP/SL/DP levels based on volatility. Built-in performance tracking shows win/loss stats, PP1/PP2 hits, and success rates — all updated live. Key Features: Buy/Sell signals with adaptive volatility bands Real-time TP/SL/DP levels based on ATR Built-in MA Filter with optional ATR/StdDev volatility Performance stats panel (Success, Profit/Loss, PP1/PP2) Alerts via popup, sound, push, or e
Power Candles MT5
Daniel Stein
5 (8)
Power Candles V3 - Indicateur de force à optimisation automatique Power Candles V3 transforme la force des devises et des instruments en un plan de trading exploitable sur chaque graphique auquel il est associé. Au lieu de se contenter de colorer les bougies, il effectue une optimisation automatique en temps réel en arrière-plan et vous fournit les meilleurs niveaux de Stop Loss, Take Profit et seuils de signal pour le symbole que vous avez sous les yeux. Un simple clic suffit pour l'adopter en
FX Trend MT5 NG
Daniel Stein
5 (6)
FX Trend NG : La Nouvelle Génération d’Intelligence de Tendance Multi-Marchés Vue d’ensemble FX Trend NG est un outil professionnel d’analyse de tendance multi-timeframe et de surveillance des marchés. Il vous permet de comprendre la structure complète du marché en quelques secondes. Au lieu de naviguer entre de nombreux graphiques, vous identifiez immédiatement quels instruments sont en tendance, où le momentum s’affaiblit et où plusieurs unités de temps sont alignées. Offre de Lancement – Ob
GoldenX Entry MT5
Kareem Abbas
5 (11)
GoldenX Entry est un indicateur MT5 doté d’un algorithme adaptatif Smart Entry Trend, d’un système de scoring des signaux, d’un détecteur de régime de marché et d’un filtre de volatilité. Chaque signal inclut un niveau d’entrée calculé, trois niveaux de Take-Profit (TP1, TP2, TP3) ainsi qu’un niveau de Stop-Loss. Il est construit sur plusieurs couches analytiques conçues pour s’adapter à différentes conditions de marché, combinant un système analytique multicouche avec un optimiseur intégré et u
L'indicateur UZFX {SSS} Scalping Smart Signals MT5 est un indicateur de trading haute performance sans redessin, conçu pour les scalpers, les day traders et les swing traders qui recherchent des signaux précis et en temps réel sur des marchés très volatils. Développé par (UZFX-LABS), cet indicateur combine l'analyse de l'action des prix, la confirmation de tendance et un filtrage intelligent pour générer des signaux d'achat et de vente à forte probabilité sur toutes les paires de devises et tous
Meridian Pro
Ottaviano De Cicco
5 (2)
Meridian Pro 2.00: Professional Multi-Timeframe Trend Matrix for MT5 Meridian Pro 2.00 is a professional adaptive trend matrix for MetaTrader 5. It combines the original Meridian trend engine, a clean chart ribbon, closed-bar signal arrows, an 8-timeframe dashboard, Fuel momentum, weighted consensus, synthetic HTF processing and chart-native higher-timeframe context lines. The goal is simple: read current trend, multi-timeframe structure, strength, momentum and EA-ready state from one discipline
Gann Made Easy   est un système de trading Forex professionnel et facile à utiliser qui est basé sur les meilleurs principes de trading en utilisant la théorie de mr. WD Gann. L'indicateur fournit des signaux d'ACHAT et de VENTE précis, y compris les niveaux Stop Loss et Take Profit. Vous pouvez échanger même en déplacement en utilisant les notifications PUSH. VEUILLEZ ME CONTACTER APRÈS L'ACHAT POUR RECEVOIR GRATUITEMENT DES INSTRUCTIONS DE TRADING ET D'EXCELLENTS INDICATEURS SUPPLÉMENTAIRES! V
FX Power MT5 NG
Daniel Stein
5 (32)
FX Power : Analysez la force des devises pour des décisions de trading plus intelligentes Aperçu FX Power est l'outil essentiel pour comprendre la force réelle des principales devises et de l'or, quelles que soient les conditions du marché. En identifiant les devises fortes à acheter et les faibles à vendre, FX Power simplifie vos décisions de trading et révèle des opportunités à forte probabilité. Que vous suiviez les tendances ou anticipiez les retournements à l'aide de valeurs extrêmes de D
SmartScalping
Temirlan Kdyrkhan
SmartScalping is a powerful trading companion designed to generate high-probability entry signals with dynamic TP/SL/DP levels based on volatility. Built-in performance tracking shows win/loss stats, PP1/PP2 hits, and success rates — all updated live. Key Features: Buy/Sell signals with adaptive volatility bands Real-time TP/SL/DP levels based on ATR Built-in MA Filter with optional ATR/StdDev volatility Performance stats panel (Success, Profit/Loss, PP1/PP2) Alerts via popup, sound, push, or e
ARIPoint
Temirlan Kdyrkhan
1 (1)
ARIPoint is a powerful trading companion designed to generate high-probability entry signals with dynamic TP/SL/DP levels based on volatility. Built-in performance tracking shows win/loss stats, PP1/PP2 hits, and success rates all updated live. Key Features: Buy/Sell signals with adaptive volatility bands Real-time TP/SL/DP levels based on ATR Built-in MA Filter with optional ATR/StdDev volatility Performance stats panel (Success, Profit/Loss, PP1/PP2) Alerts via popup, sound, push, or email Cu
TrendProMaster
Temirlan Kdyrkhan
MasterTrend Indicator for MT5 A powerful trend-following and signal-evaluation tool MasterTrend   is a custom MT5 indicator that combines Moving Averages and ATR-based risk/reward logic to generate clear buy/sell signals. It visualizes dynamic SL/TP levels, evaluates past trade outcomes, and displays win/loss statistics in a clean on-chart panel. Key features include: Buy/Sell signals based on MA crossovers ATR-based SL/TP1/TP2/TP3 levels with visual lines and labels Signal outcome tracking wit
Crystal Heikin Ashi Signals
Muhammad Jawad Shabir
5 (2)
Crystal Heikin Ashi Signals - Professional Trend & Signal Detection Indicator Advanced Heikin Ashi Visualization with Intelligent Signal System for Manual & Automated Trading Final Price: $149 ---------> Price goes up $10 after every 10 sales . Limited slots available — act fast . Overview Crystal Heikin Ashi Signals is a professional-grade MetaTrader 5 indicator that combines pure Heikin Ashi candle visualization with an advanced momentum-shift detection system. Designed for both manual traders
Atomic Analyst MT5
Issam Kassas
4.26 (35)
Ce produit a été mis à jour pour le marché 2026 et optimisé pour les dernières versions de MT5. AVIS DE MISE À JOUR DU PRIX : Atomic Analyst est actuellement disponible à $99 . Le prix passera à $199 après les 30 prochains achats . OFFRE SPÉCIALE : Après avoir acheté Atomic Analyst, envoyez-moi un message privé pour recevoir Smart Universal EA GRATUITEMENT et transformer vos signaux Atomic Analyst en trades automatisés. Atomic Analyst est un indicateur de trading Price Action sans repaint, san
Azimuth Pro
Ottaviano De Cicco
5 (7)
Azimuth Pro V2: Synthetic Fractal Structure and Confirmed Entries for MT5 Overview Azimuth Pro is a multi-level swing structure indicator by Merkava Labs . Four nested swing layers, swing-anchored VWAP, ABC pattern detection, three-timeframe structural filtering, and closed-bar confirmed entries — one chart, one workflow from micro-swings to macro-cycles. This is not a blind signal product. It is a structure-first workflow for traders who care about location, context, and timing. V2 Launch Offe
ScalpPoint
Temirlan Kdyrkhan
ScalpPoint is a powerful trading companion designed to generate high-probability entry signals with dynamic TP/SL/DP levels based on volatility. Built-in performance tracking shows win/loss stats, PP1/PP2 hits, and success rates — all updated live. Key Features: Buy/Sell signals with adaptive volatility bands Real-time TP/SL/DP levels based on ATR Built-in MA Filter with optional ATR/StdDev volatility Performance stats panel (Success, Profit/Loss, PP1/PP2) Alerts via popup, sound, push, or emai
Reversion King Indicator
Eugen-alexandru Zibileanu
5 (4)
Un nouveau Roi en ville - Indicateur + Gestion des ordres (TP1 + TP2 + TP3) + Envoi optionnel de signaux Telegram INCLUS (GRATUIT) (SYSTÈME COMPLET DE TRADING et DE SIGNAUX) Notre meilleur EA pour l’Or : Gold Slayer Cet indicateur inclut une stratégie avancée, un système de trading avec gestion des ordres personnalisable ainsi qu’un système de retour à la moyenne combinant des extensions d’enveloppes, soutenu par plusieurs filtres intelligents de confirmation comme le RSI afin de détecter des en
Market Structure Order Block Dashboard MT5 est un indicateur MT5 conçu pour les traders qui veulent lire la structure de marché et les principales zones de réaction du prix directement sur le graphique. Il combine BOS, ChoCH, Order Blocks, Fair Value Gaps (FVG), Liquidité, Kill Zones, Volume Profile, et un dashboard compact pour une analyse rapide. Cet indicateur s'adresse aux traders qui utilisent la structure de marché, les concepts ICT et Smart Money comme cadre de décision. Il peut aider à r
Quant Direction MT5
Georgios Kalomoiropoulos
Quant Direction est un outil d'analyse de marché 3D. Il fournit une analyse de marché parfaitement objective, basée sur un algorithme, en calculant des écarts précis en pourcentage sur différents paramètres. Développé à l'aide d'outils de modélisation avancés basés sur l'IA et soumis à des tests rigoureux, cet algorithme analyse le marché avec une précision inégalée. Vous pouvez analyser n'importe quelle paire de devises ou instrument financier sur la plateforme. Que vous pratiquiez le trading à
Meravith MT5
Ivan Stefanov
5 (1)
Outil des market makers. Meravith va : Analyser toutes les unités de temps et afficher la tendance actuellement en vigueur. Mettre en évidence les zones de liquidité (équilibre des volumes) où le volume haussier et baissier est égal. Afficher tous les niveaux de liquidité provenant de différentes unités de temps directement sur votre graphique. Générer et présenter une analyse de marché sous forme de texte pour votre référence. Calculer les objectifs, les niveaux de support et les points de stop
Ce produit a été mis à jour pour le marché 2026 et optimisé pour les dernières versions de MT5. AVIS DE MISE À JOUR DU PRIX : MENA Trend Scanner Pro est actuellement disponible à $99 . Le prix passera à $199 après les 30 prochains achats . OFFRE SPÉCIALE : Après avoir acheté MENA Trend Scanner Pro, envoyez-moi un message privé pour recevoir Smart Universal EA GRATUITEMENT et transformer vos signaux MENA Trend en trades automatisés. Tout d’abord, il est important de souligner que ce système de t
Plus de l'auteur
# Power Assisted Trend Following Indicator ## Overview The PowerIndicator is an implementation of the "Power Assisted Trend Following" methodology developed by Dr. Andreas A. Aigner and Walter Schrabmair. This indicator builds upon and improves J. Welles Wilder's trend following concepts by applying principles from signal analysis to financial markets. The core insight of this indicator is that successful trend following requires price movements to exceed a certain threshold (typically a mul
FREE
A Trend Following Indicator that switches directions based on a Stop-and-Reverse Price (based on Wilders algorithm) and in parallel a Stop-Loss that contracts when the profit exceeds the risk capital ( ACC*ATR ) progressively up to user defined max % level ( AF_MAX ). The basis of this indicator is the Volatility method described in Wilders book from 1975 "New Concepts in Technical Trading Systems".  I have used this on Crypto and Stocks and Forex. The ACC (Acceleration Factor) is setup to run
# Expert Advisor de Suivi de Tendance Wilders Optimisé avec Ajustement Automatique et Contrôle VIX ## Aperçu L'Expert Advisor de Suivi de Tendance Wilders Optimisé avec Ajustement Automatique et Contrôle VIX est un système de trading avancé pour MetaTrader 5 qui implémente une stratégie sophistiquée de suivi de tendance basée sur les concepts de Welles Wilder, enrichie par des techniques modernes de gestion des risques. Cet EA combine plusieurs fonctionnalités innovantes pour s'adapter aux co
Filtrer:
Aucun avis
Répondre à l'avis