Crossover MA Histogram
- Indicateurs
- Version: 1.0
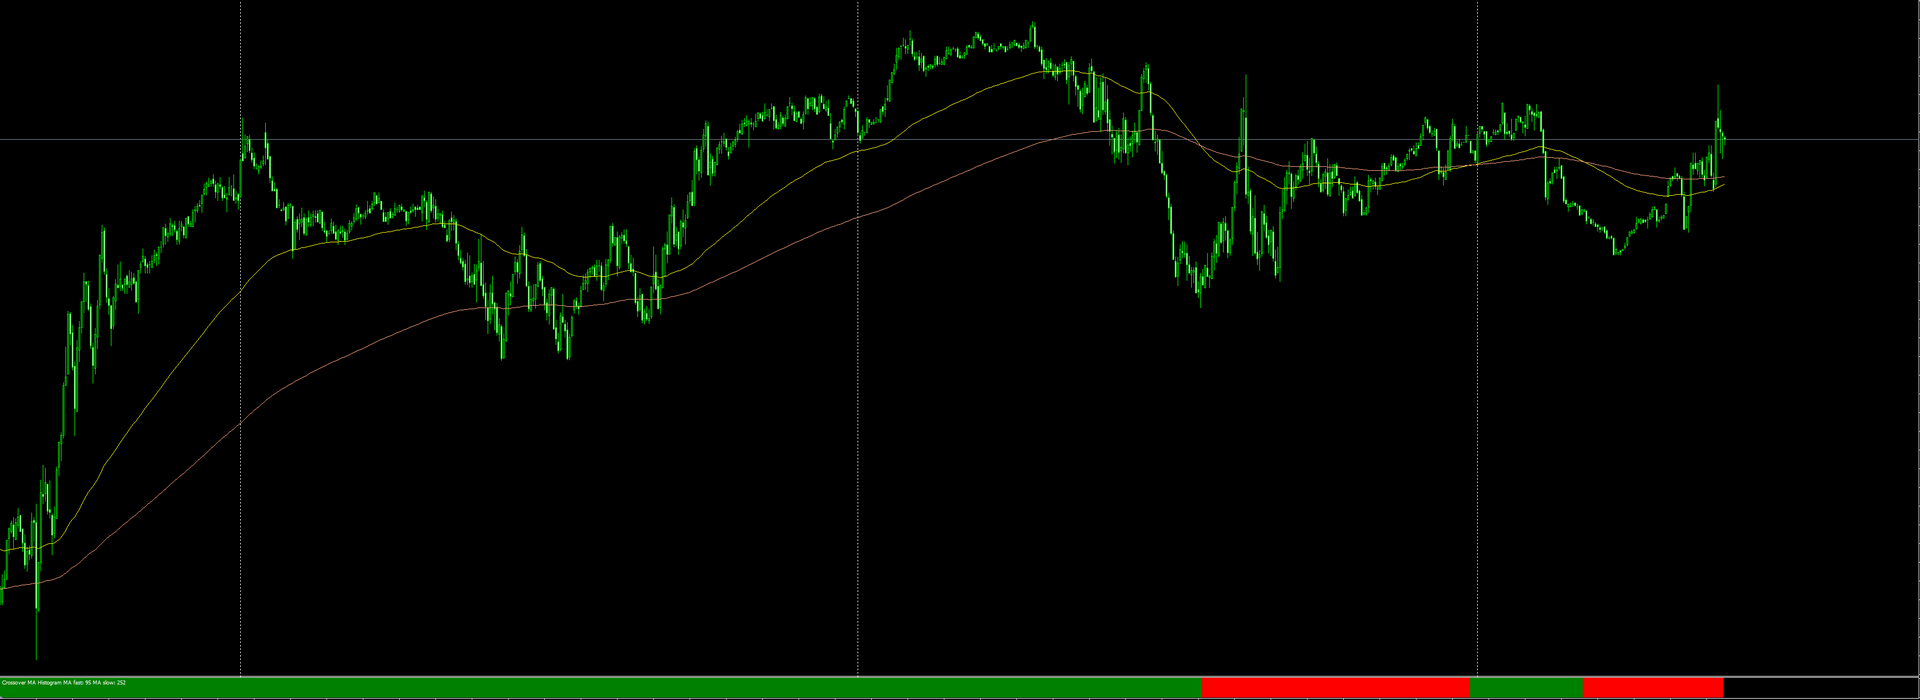
The Cossover MA Histogram indicator is a simple tool showing the trend based on crossover of moving averages.
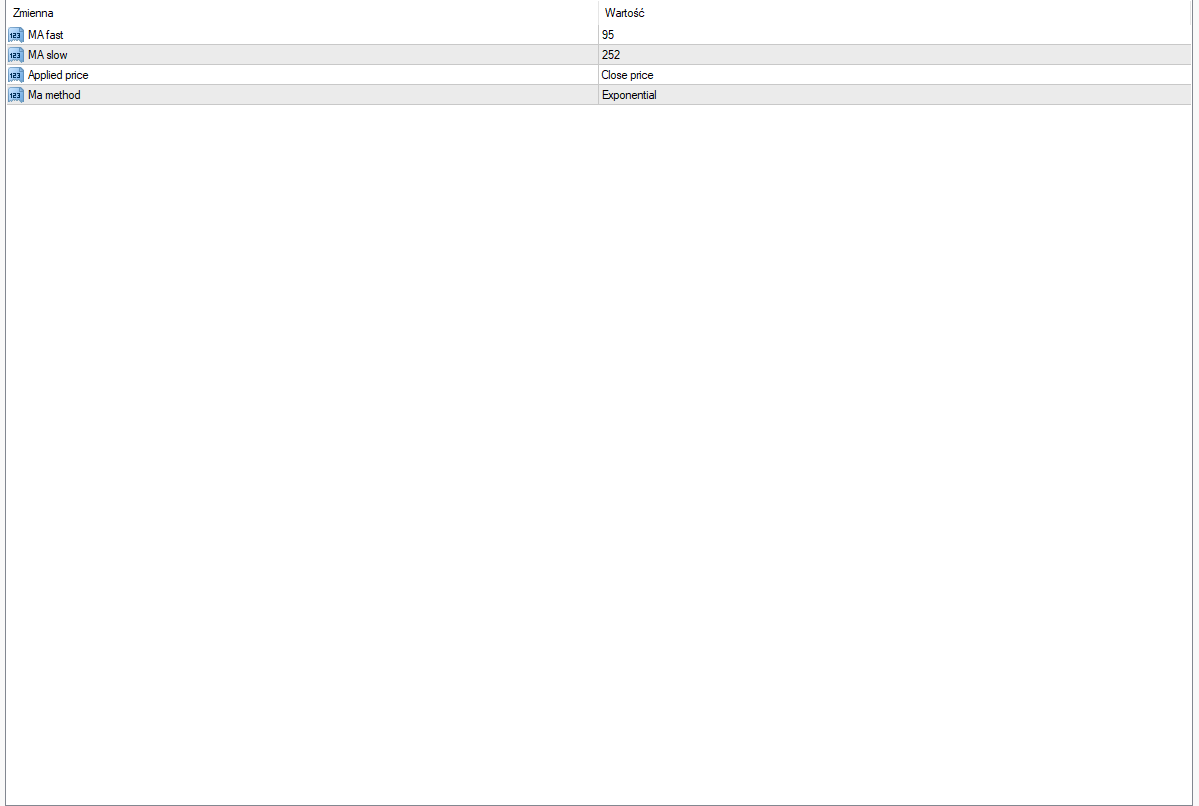
Simply specify two mobving averages and addicional parameters like MA method and Applied price.
When fast MA is above slow MA the histogram is green, indicating an uptrend.
When MA fast is below MA slow the histogram is red, indicating an downtrend.
L'utilisateur n'a laissé aucun commentaire sur la note