 MetaTrader 5
 Experts
 Indicateurs
 Bibliothèque
 Utilitaires
 Widgets
 Règles
Regardez les tutoriels vidéo de Market sur YouTube
Comment acheter un robot de trading ou un indicateur
Exécutez votre EA sur
hébergement virtuel
hébergement virtuel
Test un indicateur/robot de trading avant d'acheter
Vous voulez gagner de l'argent sur Market ?
Comment présenter un produit pour qu'il se vende bien
Nouveaux indicateurs techniques pour MetaTrader 5 - 182
 Les signaux provenant des indicateurs techniques jouent un rôle crucial dans l'ouverture et la clôture des transactions sur les marchés boursiers et les marchés forex. L'essence des indicateurs est une transformation mathématique du prix d'un symbole financier visant à prévoir les changements de prix futurs. Testez les indicateurs techniques pour mieux prédire le comportement du marché et en tirer profit.
Le KT Aroon Oscillator est une version modifiée de l’oscillateur Aroon original, initialement développé par Tushar Chande en 1995. Il mesure l’intervalle de temps entre les récents sommets et creux, et utilise ces données pour calculer la direction et la force de la tendance du marché. Il repose sur l’idée que, pendant une tendance haussière, le prix établira de nouveaux sommets successifs, tandis qu’en tendance baissière, de nouveaux creux seront formés. Signal d’achat : Lorsque la ligne Aroon
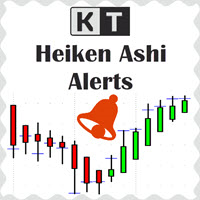
KT Heiken Ashi Alert trace les flèches d’achat et de vente et génère des alertes en se basant sur les bougies standard Heiken Ashi. C’est un outil incontournable pour les traders souhaitant intégrer Heiken Ashi dans leur stratégie de trading. Une flèche d’achat est affichée lorsque Heiken Ashi passe d’un état baissier à un état haussier. Une flèche de vente est affichée lorsque Heiken Ashi passe d’un état haussier à un état baissier. Inclut des alertes mobiles, par email, sonores et en pop-up.

KT Pip Counter est un indicateur simple et informatif qui affiche en temps réel des données essentielles. Ces informations critiques peuvent être d’un grand secours pour le trader durant les phases de marché les plus intenses.
Fonctionnalités
Affiche le profit/perte actuel en devise, en pips et en pourcentage. Affiche le spread en cours. Indique le temps restant avant la clôture de la bougie en cours. Schémas de couleurs distincts selon gain ou perte. Position et mise en page du texte entièrem

KT Pivot Points trace automatiquement les niveaux de pivot quotidiens, hebdomadaires et mensuels sur un graphique à partir des dernières données. Les points pivots sont un indicateur largement utilisé en analyse technique, en particulier sur le marché du Forex.
Fonctionnalités
Envoie des alertes lorsque le prix touche un niveau de pivot. Offre une personnalisation complète pour chaque type de niveau de pivot. Affiche les pivots quotidiens, hebdomadaires et mensuels de façon claire. Utilise
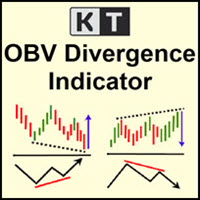
KT OBV Divergence affiche les divergences régulières et cachées qui se forment entre le prix et l’oscillateur OBV (On Balance Volume).
Fonctionnalités
Les divergences asymétriques sont ignorées pour plus de précision et moins d'encombrement visuel. Prend en charge des stratégies de trading de retournement et de continuation de tendance. Entièrement compatible et prêt à être intégré dans un Expert Advisor. Peut être utilisé pour les entrées comme pour les sorties de position. Inclut toutes les a
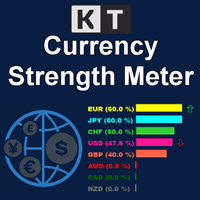
Le KT Currency Strength Meter mesure la force et la faiblesse des devises individuelles à l'aide d'une formule mathématique agrégée appliquée aux principales paires de devises du Forex. La force est calculée à partir des bougies haussières et baissières sur une période fixe. Ensuite, un algorithme classe les devises de la plus forte à la plus faible et met à jour l’ordre en temps réel selon les nouvelles données.
Avantages
Améliorez immédiatement votre stratégie en éliminant les signaux vous su
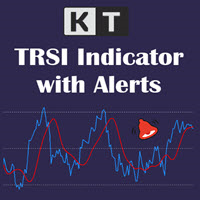
KT TRSI est un oscillateur basé sur une combinaison du RSI (Indice de Force Relative), de l’EMA (Moyenne Mobile Exponentielle) et de la SMA (Moyenne Mobile Simple). Comparé au RSI classique, le TRSI est moins sujet aux faux signaux grâce à l’effet de lissage de la SMA. Il prend également en charge tous les types d’alertes MetaTrader.
Règles d'entrée simples
Achat : lorsque la ligne bleue (RSI) croise au-dessus de la ligne rouge (TRSI). Vente : lorsque la ligne bleue (RSI) croise en dessous de l
Surveillez chaque contact avec les Bandes de Bollinger depuis le graphique KT Bollinger Bands Alert affiche les bandes supérieure, médiane et inférieure, puis surveille si la bougie actuelle touche une bande sélectionnée. Activez les événements utiles à votre méthode et laissez l'indicateur attirer votre attention au bon moment pendant que vous observez le reste du marché. Gardez les valeurs des trois bandes sous les yeux Des étiquettes de prix facultatives suivent les valeurs actuelles des band
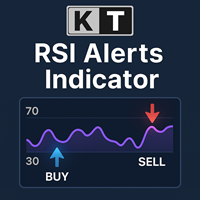
KT RSI Alerts est une version personnalisée de l’oscillateur RSI (Relative Strength Index) qui génère des signaux et des alertes sur la base de quatre événements personnalisés : Lorsque le RSI entre en zone de surachat. Lorsque le RSI sort de la zone de surachat. Lorsque le RSI entre en zone de survente. Lorsque le RSI sort de la zone de survente.
Fonctionnalités Un excellent choix pour les traders qui spéculent sur les mouvements du RSI dans les zones de surachat/survente. Indicateur léger con

KT Forex Volume affiche le volume d'achat et de vente d'une paire de devises sous forme d'histogramme coloré. Le volume est composé des transactions d'achat et de vente sur un actif. Sur le marché des changes (Forex) : Si le volume d'achat dépasse le volume de vente, le prix de la paire de devises augmente. Si le volume de vente dépasse le volume d'achat, le prix de la paire de devises diminue.
Fonctionnalités Évitez les mauvaises transactions en les confirmant avec les données de volume par ti
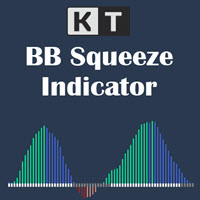
Repérez la contraction de volatilité avant l'expansion du momentum KT BB Squeeze réunit l'état de la volatilité et la direction du momentum dans un oscillateur clair. Il compare Bollinger Bands à Keltner Channels pour montrer si le marché est comprimé ou en expansion, tandis que l'histogramme révèle l'évolution du momentum autour de la ligne zéro. Points gris: Bollinger Bands se trouve à l'intérieur de Keltner Channels et signale une phase de compression. Points blancs: Bollinger Bands se trouve
Le KT QQE Advanced est une version modifiée du célèbre oscillateur QQE, offrant une représentation plus précise grâce à un histogramme coloré doté de lignes de suivi (Trailing Line) rapide et lente.
Contrairement au QQE classique, KT QQE Advanced se compose d’un histogramme intégrant des niveaux de surachat/survente.
Applications
Repérez rapidement des signaux d’achat/vente sur tous les horizons grâce au scanner MTF. Déterminez la direction de la tendance avec plus de précision. Détectez les
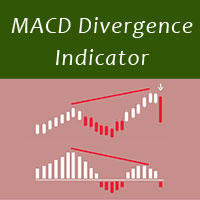
MACD divergence indicator finds divergences between price chart and MACD indicator and informs you with alerts (popup, mobile notification or email) . Its main use is to find trend reversals in the chart. Always use the divergence indicators with other technical assets like support resistance zones, candlestick patterns and price action to have a higher possibility to find trend reversals. Three confirmation type for MACD divergences: MACD line cross zero level Price returns to previous H/L Crea
FREE
Mouse You can draw fibonaccis moving the mouse over the zigzag indicator Pin them You can click on fibonacci with this option and it will no longer be deleted unless you click on it again :) Precision The tuned fibonacci gets the precise point in lower timeframes Enjoy it You can ask me for add more features, so please comment and leave your ranting for me to be happy, thank you :)
FREE

Market Momentum Alerter Market Momentum Alerter will inform you about danger to operate in the market.
Imagine you see a very nice setup (Forex, Stocks, Indices) and you decide to place your trade...
And you finally lose your trade and don't understand what happened.
This can happen due to big operations in the market carried out by banks and big institutions.
These operations are invisible for most people.
Now with the Market Momentum Alerter you will be able to detect those operations...

ATR Scanner Pro is a multi symbol multi timeframe volatility scanner that monitors and analyzes Average True Range indicator value in up to 28 symbols and 9 timeframes in 3 modes : ATR value: As a volatility dashboard it shows the ATR indicator value in all pairs and timeframes and signals when the ATR value reaches a maximum or minimum in a given duration. Short term ATR/Long term ATR ratio: It shows ratio of 2 ATRs with different periods. It's useful in detecting short term volatility and

Indicator and Expert Adviser EA Available in the comments section of this product. Download with Indicator must have indicator installed for EA to work.
Mt5 indicator alerts for bollinger band and envelope extremes occurring at the same time. Buy signal alerts occur when A bullish candle has formed below both the lower bollinger band and the lower envelope Bar must open and close below both these indicators. Sell signal occur when A bear bar is formed above the upper bollinger band and upper
FREE
It is the very same classic Stochastic indicator, but with a little twist: we changed the Signal Line with a 2-color line, so we can use it with EAs as a filtering system. And that's it! I know it could seem stupid but I needed that, so I created it. The original formula is right from Metaquote's chest, no additions, no subtractions, it is Stochastics in its core.
So I will not publish here the Stochastics parameters as they are all the same as always... Enjoy!
If you like this indicator, all I
FREE

KT Fisher Transform is an advanced version of the original Fisher Transform oscillator equipped with divergence detection, crossover alerts, and many more features. Originally it was developed by John F. Ehlers. It converts the asset's price into a Gaussian normal distribution to find the local extremes in a price wave.
Features
A light-weighted oscillator that efficiently identifies the upward and downward crossovers and marks them using vertical lines. It also finds regular and hidden diverg

PriceRunner MT5 The PriceRunner indicator is based on pure relative power. It gives promising results even in M1 timeframes in currency pairs and M2 in commodities and cryptos. The indicator is designed with user-friendly and simple settings. It is very suitable even for beginners who are interested in indicators and strategies. I am ready to make improvements on the indicator in line with the needs of those who buy or rent. However, even in its current state, you can see very promising results
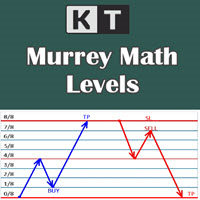
It shows the Murrey Math levels on chart and also provides an alert when price touch a particular level. T. Henning Murrey, in 1995, presented a trading system called Murrey Math Trading System, which is based on the observations made by W.D Gann.
Applications
For Murrey Math lovers, this is a must-have indicator in their arsenal. There is no need to be present on the screen all the time. Whenever the price touches a level, it will send an alert. Spot upcoming reversals in advance by speculatin
KT Candle Timer shows the remaining time in the closing of the current bar. You can use the bar closing time for multiple purposes, including time and trade management during the trading hours.
Features
It also shows the Symbol spreads along with the remaining time. It offers two convenient timer display positions, i.e., chart corner or next to the current bar. From colors to text size, it offers full customization according to user preferences. It is optimized to work without using extensive c
KT Bullish Bearish shows the bullish/bearish regime of the market in the form of a colored histogram representing both of the market states alternately. Bull Market (Blue Histogram): A bull market indicates an uptrend when an instrument price rises over a continued period like days, months, or years. Bear Market (Red Histogram): A bear market indicates a downtrend when an instrument price rises over a continued period like days, months, or years.
Applications
It prevents trading against the big
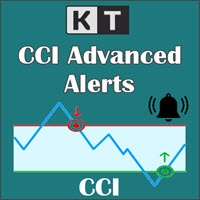
KT CCI Alerts is a personal implementation of the Commodity Channel Index (CCI) oscillator that provide signals and alerts on four custom events: When CCI enter in an overbought zone. When CCI exit from an overbought zone. When CCI enter in an oversold zone. When CCI exit from an oversold zone.
Features A perfect choice for traders who speculate the CCI movements within an overbought/oversold zone. Lightly coded without using extensive memory and resources. It implements all Metatrader alerts.
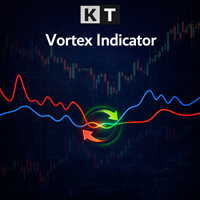
The Vortex Indicator was first presented by Douglas Siepman and Etienne Botes in January 2010 edition of Technical Analysis of Stocks & Commodities. Despite its based on a complex implosion phenomenon, the vortex is quite simple to interpret. A bullish signal is generated when +VI line cross above the -VI line and vice versa. The indicator is mostly used as a confirmation for trend trading strategies. The Vortex was inspired by the work of Viktor Schauberger, who studied the flow of water in tur
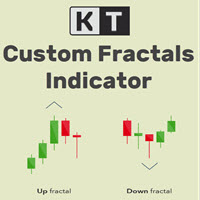
KT Custom Fractals is a personal implementation of the Fractal indicator first introduced by Bill Williams. With KT Custom Fractals you can choose a custom number of bars to allow to the left and right side of the fractal. For example, you can display the fractals that have "three" successive bars with the highest high in the middle and one lower high on both sides , or you can display the fractals that have "Eleven" consecutive bars with the lowest low in the middle and five higher lows on bot

KT Fractal Channel Breakout draws a continuous channel by connecting the successive Up and Down fractals. It provides alerts and also plots the Up and Down arrows representing the bullish and bearish breakout of the fractal channel.
Features
If you use Bill Williams fractals in your technical analysis, you must also include it in your trading arsenal. It can be very effective and useful for stop-loss trailing. A new market trend often emerges after a fractal channel breakout in a new direction.
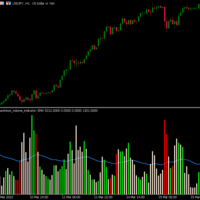
Hawkeye Volume Indicator contains a complex algorithm which executes over 300 calculations per bar in order to analyze the price action and associated volume, giving traders a tremendous advantage. Now Available in MT5 for U nlimited Use !
Volume is the only leading indicator which: .signals a price movement prior to it happening
.provides the fuel that drives the market Hawkeye Volume works in all markets and can be used in all timeframes for both tick and time charts – from longer term swing a
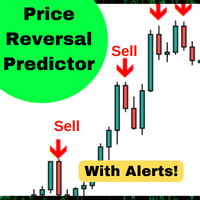
Cet algorithme prédit les changements de prix à court terme avec une précision de 90% *. Prédit si le prix sera supérieur ou inférieur à la bougie de signal. Parfait pour le trading de réversion moyenne, les options binaires ou les contrats à terme sur des délais plus longs. L'indicateur a été testé sur 5 ans de données et a une précision de 90% pour prédire les inversions de prix au fil du temps.
Caractéristique: 1. Configuration simple a. Glisser-déposer sur n'importe quel graphique b. Activ
FREE

Cet algorithme prédit les changements de prix à court terme avec une précision de 86% *. Lorsqu'il y a un mouvement important tel que déterminé par l'ATR, lors d'une condition de surachat ou de survente, l'indicateur vous alertera. Prédit si le prix sera supérieur ou inférieur à la bougie de signal. Parfait pour le trading de réversion moyenne, les options binaires ou les contrats à terme sur des délais plus longs. L'indicateur a été testé sur 5 ans de données et a une précision de 90% pour pré
FREE
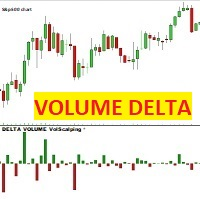
VOLUME DELTA Volscalping Cet indicateur, pour chaque bougie de prix, dessine une bougie Delta, qui est la différence entre les contrats achetés et vendus. La bougie sera rouge et négative si les contrats négociés dans l'offre (vendus) dépassent ceux dans la demande, au contraire, la bougie sera verte et positive si les contrats négociés dans l'ASK (achetés) dépassent ceux dans l'offre.
ATTENTION : L'indicateur ne fonctionne qu'avec des courtiers qui fournissent un flux de données de marché ré
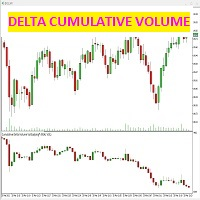
cet indicateur détecte la différence entre les contrats conclus en offre et en demande (agression) pour chaque bougie.
l'indicateur affiche dans la fenêtre dédiée sous le graphique des prix, des bougies données précisément par la différence entre les contrats vendus et achetés, qui génèrent la force volumétrique du marché.
il est possible (voir sur les captures d'écran) comment sélectionner uniquement le graphique delta des chandeliers cumulatifs, ou même avec une ligne de tendance des bougie

KT Coppock Curve transforme une lecture lissée du momentum en une vision claire de la direction du marché. L'indicateur fonctionne dans une fenêtre séparée sous le graphique des prix, où la ligne zéro sert de repère principal. Au lieu de réagir à chaque petit mouvement de la courbe, vous voyez rapidement si le momentum reste du côté haussier ou baissier. La courbe combine des taux de variation de périodes plus longues et plus courtes, puis lisse le résultat. Elle permet ainsi de suivre des chang
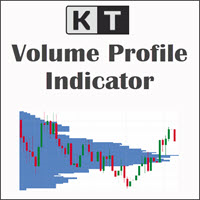
KT Volume Profile vous aide à étudier où l'activité s'est concentrée dans une zone du graphique que vous choisissez. Placez le rectangle sur le mouvement à analyser, puis faites glisser son bord gauche ou droit. Le profil est recalculé immédiatement et trace un histogramme horizontal sur la plage de prix sélectionnée. Choisissez la partie du graphique qui compte vraiment Vous n'êtes pas limité à une session ni à une période fixe. Le rectangle mobile permet d'isoler une jambe de tendance, une con

ROC mesure la vitesse à laquelle le prix a changé par rapport à une période antérieure. Il devient particulièrement utile lorsque le prix inscrit un nouveau sommet ou creux de swing, mais que le momentum derrière le mouvement ne le confirme pas. KT ROC Divergence détecte automatiquement ces désaccords et trace des lignes correspondantes sur le graphique du prix et dans la fenêtre ROC. Contrairement aux oscillateurs qui restent dans une plage fixe, ROC s'élargit et se contracte avec la vitesse du

Notre indicateur fournira un filtre de propagation pour surveiller la propagation de plusieurs paires simultanément et également un compte à rebours de la minuterie de bougie affiche le temps restant avant la fermeture de la barre actuelle et la formation d'une nouvelle barre.
OFFRE À DURÉE LIMITÉE : Tous nos indicateurs premium sont disponibles pour seulement 50$, en accédant à notre blog MQL5 vous trouverez tous les détails de nos indicateurs premium. Cliquez ici.
Principales caractéristi
FREE
Indicateur Relative Vigor Index (RVI) avancé avec signaux à double ligne, système de niveau zéro, support multi-temporalité, signaux visuels personnalisables et système d'alertes hautement configurable.
Services de programmation freelance, mises à jour et autres produits TrueTL sont disponibles sur mon profil MQL5 .
Les retours et avis sont très appréciés !
Qu'est-ce que le Relative Vigor Index (RVI) ? Le Relative Vigor Index (RVI) est un oscillateur de momentum développé par John Ehlers qui
FREE
Voyez dans quelle session forex vous tradez et combien de pips chaque session a parcourus, directement sur votre graphique MetaTrader 5. KT Forex Sessions MT5 est un indicateur de sessions qui dessine les sessions de Tokyo, Londres et New York sous forme de boîtes colorées et écrit la taille de chaque session en pips sur sa boîte. L'indicateur lit lui-même le décalage GMT de votre courtier, et chaque session suit l'heure locale et l'heure d'été de sa propre ville. Les boîtes restent au bon endro
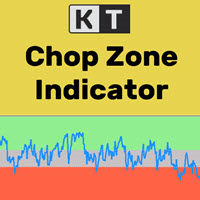
Il est bien connu que les marchés financiers évoluent en tendance seulement 30 % du temps, tandis qu’ils se déplacent dans une plage de consolidation les 70 % restants. Pourtant, la plupart des traders débutants ont du mal à savoir si le marché est en tendance ou bloqué dans une phase latérale. KT Chop Zone résout ce problème en mettant en évidence la phase du marché à travers trois zones distinctes : zone baissière, zone haussière et zone neutre (Chop Zone).
Fonctionnalités
Améliorez instantan
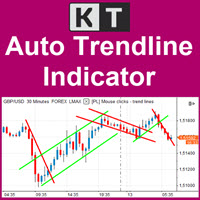
Gardez vos lignes de tendance importantes à jour KT Auto Trendline construit automatiquement une ligne de tendance supérieure et une ligne inférieure à partir des récents points de retournement ZigZag, puis les prolonge vers l'avenir sur le graphique actif. Vous obtenez ainsi une structure claire pour suivre les cassures en formation, les réactions et les changements de direction sans redessiner continuellement les mêmes lignes à la main. Suivez ensemble la structure proche et les mouvements plu
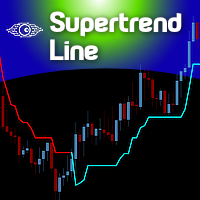
The Supertrend indicator was originally created by a french fellow named Olivier Seban , and its goal is to identify the Primary Trend of prices . Its calculation is easy and based on the average of Highs and Lows and then we add the volatility of a custom period, plus a multiplier. This way we get the Supertrend Line. You can find in the web several approaches and trading strategies using this very useful indicator.
HOW TO "READ" THIS INDICATOR
If the closing prices are above Supertrend Line,
FREE

The Analytical cover trend indicator is a revolutionary trend trading and filtering solution with all the important features of a trend tool built into one tool! The Analytical cover indicator is good for any trader, suitable for any trader for both forex and binary options. You don’t need to configure anything, everything is perfected by time and experience, it works great during a flat and in a trend.
The Analytical cover trend indicator is a tool for technical analysis of financial markets
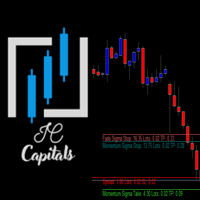
Key Features: Multi-Target Volatility: Configure multiple Take Profit and Stop Loss levels based on real-time market volatility. Fully Customizable: Set specific volatility multipliers (e.g., 4x for Stop, 10x for Take) using any look-back period (e.g., previous 20 bars on a 2-minute chart). Clear Visuals: Assign unique names to each level to be displayed directly on your symbol's chart for easy monitoring. Consistency: Every level calculated is synchronized with the volatility of your chosen per
FREE
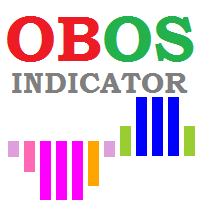
OBOS indicator
OBOS Indicator is an exclusive indicator to spot entries based on price action.
The OBOS Indicator is both effective and user friendly.
Indicator uses simple color codes and levels to indicate Overbought and Oversold conditions. No more headache.
The OBOS Indicator will only gives you indication when there are possible entries. Means you only get useful information.
Inputs of the indicator are:
MaxBars : number of bars to display in your chart Smoothing period : number of b

Tick imbalance bars (TIB), described in the book Advances in Financial Machine Learning (2018) by Marcos López de Prado. Indicator that show candlestick bars with an different sampling method than time fixed. Real time data is sourced to the indicator and it may be used as substitute of the default graph. Each bar is formed when a predefined tick balance is exceeded, showing in the graph the OHLC of this cluster of ticks. The input variable is the amount of ticks of each bar. The indicator may
FREE
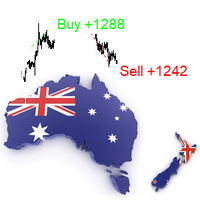
The indicator is a trading system for AUDUSD or NZDUSD currency pairs.
The indicator was developed for time periods: M15, M30.
At the same time, it is possible to use it on other tools and time periods after testing.
"Kangaroo Forex" helps to determine the direction of the transaction, shows entry points and has an alert system.
When the price moves in the direction of the transaction, the maximum length of the movement in points is displayed.
The indicator does not redraw, all actions occ
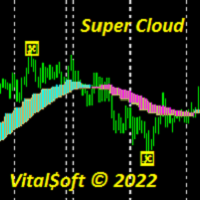
The Super Cloud indicator helps to determine the direction of the trend when trading. Shows on the chart signals about a possible upcoming trend change. The indicator provides an opportunity to detect various features and patterns in price dynamics that are invisible to the naked eye. Based on this information, traders can anticipate further price movement and adjust their strategy accordingly. Works on all timeframes except MN.

Trend Direction ADX indicator Trend Direction ADX is part of a serie of indicators used to characterize market conditions.
Almost any strategy only work under certain market conditions.
Therefore it is important to be able to characterize market conditions at any time: trend direction, trend strength, volatility, etc..
Trend Direction ADX is an indicator to be used to characterize trend direction:
trending up trending down ranging Trend Direction ADX is based on ADX standard indicator.
Tre

Trend Strength MA indicator Trend Strength MA is a part of a series of indicators used to characterize market conditions.
Almost any strategy only works under certain market conditions.
Therefore, it is important to be able to characterize market conditions at any time: trend direction, trend strength, volatility, etc.
Trend Strength MA is an indicator to be used to characterize trend strength:
Up extremely strong Up very strong Up strong No trend Down strong Down very strong Down extremely

Trend Direction Up Down Indicator Trend Direction Up Down is part of a series of indicators used to characterize market conditions.
Almost any strategy only works under certain market conditions.
Therefore it is important to be able to characterize market conditions at any time: trend direction, trend strength, volatility.
Trend Direction Up Down is an indicator to be used to characterize trend direction (medium term trend):
trending up trending down ranging Trend Direction Up Down is based

Hunt markets with Hunttern ZigZag . Easy to use with one parameter
You can use it for the following: -Classic patterns -Heads and shoulders -Harmonic patterns -Elliott Wave -Support and resistance -Supply and Demand
Single parameter: -Period (1-120)
Features: -Candle time -Single parameter -Light mode template
This is version 1 of Hunttern ZigZag. We are very happy to receive feedback from you.
FREE
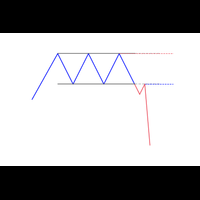
A new box will be added, if the closing price is higher than the maximum (lower than the minimum) of the current box series no less than for the specified value. Reversal will be made, if the closing price is higher (lower) than the last box on a value no less than the specified.
T his is a trend indicator and it can be used as an alternative for the trend definition instruments which use averaging.

KT Risk Reward shows the risk-reward ratio by comparing the distance between the stop-loss/take-profit level to the entry-level. The risk-reward ratio, also known as the R/R ratio, is a measure that compares the potential trade profit with loss and depicts as a ratio. It assesses the reward (take-profit) of a trade by comparing the risk (stop loss) involved in it. The relationship between the risk-reward values yields another value that determines if it is worth taking a trade or not.
Features
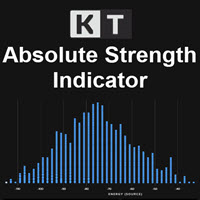
KT Absolute Strength measures and plots the absolute strength of the instrument's price action in a histogram form. It combines the moving average and histogram for a meaningful illustration. It supports two modes for the histogram calculation, i.e., it can be calculated using RSI and Stochastic both. However, for more dynamic analysis, RSI mode is always preferred.
Buy Entry
When the Absolute Strength histogram turns green and also it's higher than the previous red column.
Sell Entry
When th
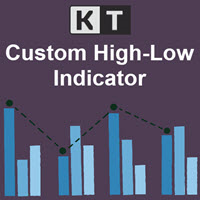
KT Custom High Low shows the most recent highs/lows by fetching the data points from multi-timeframes and then projecting them on a single chart. If two or more highs/lows are found at the same price, they are merged into a single level to declutter the charts.
Features
It is built with a sorting algorithm that declutters the charts by merging the duplicate values into a single value. Get Highs/Lows from multiple timeframes on a single chart without any fuss. Provide alerts when the current pri
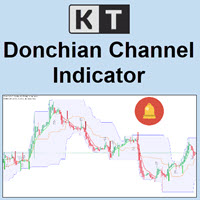
KT Donchian Channel is an advanced version of the famous Donchian channel first developed by Richard Donchian. It consists of three bands based on the moving average of last high and low prices. Upper Band: Highest price over last n period. Lower Band: Lowest price over last n period. Middle Band: The average of upper and lower band (Upper Band + Lower Band) / 2. Where n is 20 or a custom period value is chosen by the trader.
Features
A straightforward implementation of the Donchian channel ble
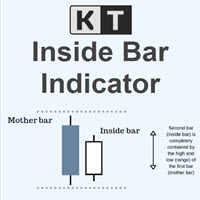
KT Inside Bar plots the famous inside bar pattern in which the bar carries a lower high and higher low compared to the previous bar. The last bar is also known as the mother bar. On smaller time-frames, the inside bar sometimes appears similar to a triangle pattern.
Features
Also plots entry, stop-loss, and take-profit levels with the inside bar pattern. No complex inputs and settings. Erase unwanted levels when the price reaches the entry line in either direction. All Metatrader alerts include
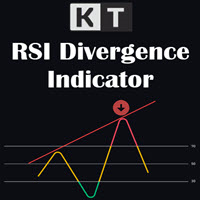
KT RSI Divergence shows the regular and hidden divergences built between the price and Relative Strength Index (RSI) oscillator. Divergence can depict the upcoming price reversal, but manually spotting the divergence between price and oscillator is not an easy task.
Features
Ability to choose the alerts only for the divergences that occur within an overbought/oversold level. Unsymmetrical divergences are discarded for better accuracy and lesser clutter. Support trading strategies for trend reve

Best indicator for MT5 providing accurate and sniper signals to enter a trade without repainting!
It can be applied to any financial assets: forex, synthetic, cryptocurrencies, metals, stocks, indices . It will provide pretty accurate trading signals and tell you when it's best to open a trade and close it. Most traders improve their trading results during the first trading week with the help of the Power Indicator Pro.
Benefits of the Power Indicator Pro
Entry signals without repaint

KT Average Daily Range(ADR) shows the upper and lower levels using the average daily range covered by the currency pair or the instrument. The average daily range is calculated using the chosen period in the input settings. ADR High: ADR upper level is found by adding the average daily range value to the current day's low.
ADR Low: ADR lower level is found by subtracting the ADR value from the current day's high.
Features
It shows the ADR levels with several other helpful information benefici

主要城市的时间。北京时间、东京时间、悉尼时间、惠灵顿时间、纽约时间、法兰克福时间、伦敦时间、迪拜时间。 城市时间可选择开启或者关闭。 点差变色提醒。设置点差提醒点数,例如,设置100点,点差大于100点,文字会变红色。 Time in major cities. Beijing time, Tokyo time, Sydney time, Wellington time, New York time, Frankfurt time, London time, Dubai time. City time can be turned on or off. Dot difference color change reminder. Set the point difference reminder points. For example, set 100 points. If the point difference is greater than 100 points, the text will turn red.
FREE

LT Easy Trend - La puissance de la confluence dans un seul indicateur Avez-vous déjà ressenti de la confusion en voyant un indicateur pointer vers un achat alors qu'un autre indiquait une vente ? LT Easy Trend a été développé pour éliminer cette indécision, en délivrant des signaux à haute probabilité basés sur le consensus mathématique de 9 des indicateurs techniques les plus respectés au monde. Au lieu de polluer votre graphique avec des dizaines de fenêtres, Easy Trend traite tout en temps ré
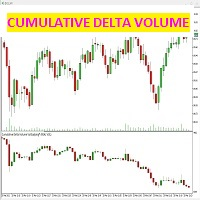
cet indicateur détecte la différence entre les contrats conclus en offre et en demande (agression) pour chaque bougie.
l'indicateur affiche dans la fenêtre dédiée sous le graphique des prix, des bougies données précisément par la différence entre les contrats vendus et achetés, qui génèrent la force volumétrique du marché.
il est possible (voir sur les captures d'écran) comment sélectionner uniquement le graphique delta des chandeliers cumulatifs, ou même avec une ligne de tendance des bougie

Lisez la direction de la tendance directement sur le graphique KT Trend Magic associe momentum et volatilité dans une ligne colorée qui suit le prix. La ligne donne une vue continue de l'état actif de la tendance et change de couleur lorsque la direction calculée se modifie. Ligne verte : indique un état de tendance haussier. Ligne rouge : indique un état de tendance baissier. Changement de couleur : marque une nouvelle transition directionnelle sur le graphique. Pendant un mouvement soutenu, la
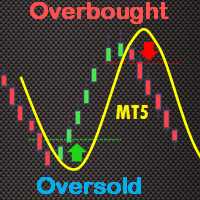
The True Oversold Overbought indicator provides you with ability to swiftly check whether the asset is oversold or overbought. Other than complementing your trading with True Oversold Overbought, you can use the indicator as your only trading system. It works with all forex instruments and will save you the headache of estimating when the market is due for a reversal or retracement. When the "Super Charge" feature is enabled, the areas where the price is in oversold/overbought status are ampli
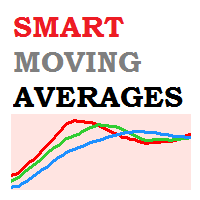
Smart Moving Averages Indicator Smart Moving Averages is an exclusive indicator for Metatrader platform.
Instead of calculating moving averages for the selected chart time frame, the Smart Moving Averages indicator gives you the opportunity to calculate moving averages independently from the chart time frame.
For instance you can display a 200 days moving average in a H1 chart.
Inputs of the indicator are:
Timeframe : timeframe to be used for the calculation of the moving average Period : m

Bar Strength Divergence Indicator BarStrength Indicator is an exclusive indicator to trade Forex, Stocks, Indices, Futures, Commodities and Cryptos.
BarStrength Indicator shows the strength of each candle.
The indicator shows in a separate windows candles relatively to 2 price levels representing resistance and support in the market.
Once candle is near resistance it is highly probable that price movement will change direction and will go down in the next candles.
Once candle is near support

HighLow Arrow Indicator HighLow Arrow is a simple indicator to be used to signal major lows and major highs in your chart.
This indicator is not intended to be used to trade alone but more as an alert that a turning point might be forming.
In this case the HighLow Arrow indicator signals that a new high or a new low is forming and that traders can prepare for seeking new signals.
The formation of the High or the Low is confirmed after 2 bars have been closed. In the meantime, the alert can b
Daily Pivots Multi Indicator Daily Pivots Multi is an exclusive indicator to draw your pivots levels and much more.
Most indicators draw daily pivots for the day. Daily Pivots Multi is able to draw levels for different days.
The indicator can do the calculation for unlimited number of days backward. It means that you can draw the levels for today but also for the past days.
This is very useful if you want to study a strategy with Pivots levels over a period of time.
Another problem is that e
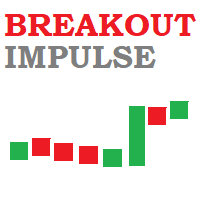
Breakout Impulse Indicator Breakout Impulse Indicator is a pattern recognition indicator for Forex, Stocks, Indices, Futures, Commodities and Cryptos.
The Breakout Impulse is a multi-bar pattern.
The purpose of the pattern is to identify a fast change in momentum.
This type of change can announce the start of a big directional move.
Inputs of the indicator are:
Distance : distance in pixel relative to top or bottom of candle to display the arrow symbol MaxBars : number of bars back used to
Savez-vous pourquoi MetaTrader Market est le meilleur endroit pour vendre des stratégies de trading et des indicateurs techniques ? Pas besoin de publicité ou de protection logicielle, pas de problèmes de paiement. Tout est fourni dans le MetaTrader Market.

Vous manquez des opportunités de trading :
- Applications de trading gratuites
- Plus de 8 000 signaux à copier
- Actualités économiques pour explorer les marchés financiers
Inscription
Se connecter
Vous acceptez la politique du site Web et les conditions d'utilisation
Si vous n'avez pas de compte, veuillez vous inscrire