Osama Echchakery / Vendedor
Productos publicados
"GA Moving Average" ("GA Media Móvil") es un Asesor Experto (EA) que ha sido desarrollado para automatizar el trading basado en la estrategia de cruce de medias móviles. Con sus ajustes personalizables, este EA permite a los operadores crear la estrategia perfecta adaptando diferentes parámetros a sus preferencias de trading.
El concepto central del EA "GA Moving Average" se basa en el uso de indicadores de medias móviles para identificar posibles oportunidades de trading. Mediante el análisis
FREE

Jesus XAUUSD es un EA profesional construido específicamente para el XAUUSD, utilizando el reconocimiento avanzado de patrones de precio-acción y análisis multi-marco de tiempo para ofrecer entradas estables y precisas en el oro. Este Asesor Experto está diseñado para los operadores que buscan un verdadero robot de grado institucional XAUUSD con la lógica real de velas, probado a través de más de 100.000 ciclos de optimización. - SEÑAL REAL : 5K Live Signal : Haga clic aquí El oro es rápido, agr

Infi Trade: Revoluciona tu Trading con Automatización Avanzada Desbloquea el Poder del Trading Automatizado: Infi Trade es un Asesor Experto de vanguardia diseñado para traders que buscan eficiencia y rentabilidad en el mercado Forex. Nuestro EA aprovecha la sofisticada estrategia de cobertura en rejilla para maximizar tus oportunidades de trading, proporcionando una experiencia de trading automatizada sin interrupciones. Estrategia Inteligente de Cobertura en Rejilla: En el corazón de Infi Trad

Hola, traders! Soy Jesús , la máquina definitiva de trading en GBP . Mi estrategia se basa en miles de patrones de velas optimizados, meticulosamente refinados para extraer las mejores configuraciones en GBPUSD . La precisión es mi base, y mi objetivo es simple: dominar el mercado GBPUSD con precisión láser. No soy sólo un Asesor Experto, soy una fuerza implacable en el trading del GBPUSD, diseñado para cortar el ruido del mercado y ofrecer resultados excepcionales. Ya se trate de picos volátil
"GA Moving Average" ("GA Media Móvil") es un Asesor Experto (EA) que ha sido desarrollado para automatizar el trading basado en la estrategia de cruce de medias móviles. Con sus ajustes personalizables, este EA permite a los operadores crear la estrategia perfecta adaptando diferentes parámetros a sus preferencias de trading.
El concepto central del EA "GA Moving Average" se basa en el uso de indicadores de medias móviles para identificar posibles oportunidades de trading. Mediante el análisis
FREE

Libere el poder del trading automatizado con el EA de Retroceso de Fibonacci Totalmente Automatizado para MetaTrader 5. Este Asesor Experto identifica dinámicamente los niveles de retroceso de Fibonacci y coloca operaciones basadas en formaciones de velas, completamente manos libres. Diseñado para simplificar su proceso de negociación, garantiza una ejecución precisa y oportuna sin necesidad de supervisión constante. Características principales: Ejecución automática de operaciones : El EA anali
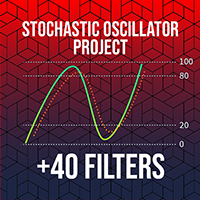
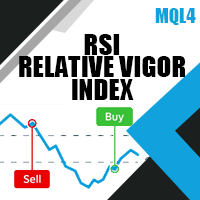
Libere todo el potencial del trading con el Asesor Experto (EA) Stochastic Oscillator PROject , una herramienta automatizada y altamente personalizable creada en torno al indicador Stochastic Oscillator, ampliamente utilizado. Este EA está diseñado con filtros avanzados y ajustes flexibles, lo que permite a los operadores gestionar el riesgo de forma eficaz a través de parámetros personalizables como el tamaño del lote, stop-loss, take-profit y filtros de sesión. Con múltiples opciones de confi
"GA Moving Average" ("GA Media Móvil") es un Asesor Experto (EA) que ha sido desarrollado para automatizar el trading basado en la estrategia de cruce de medias móviles. Con sus ajustes personalizables, este EA permite a los operadores crear la estrategia perfecta adaptando diferentes parámetros a sus preferencias de trading.
El concepto central del EA "GA Moving Average" se basa en el uso de indicadores de medias móviles para identificar posibles oportunidades de trading. Mediante el análisis
FREE

¡Presentamos Last Hope EA , uno de mis 30 EA principales, el innovador Asesor Experto MQL4 que está transformando la forma en que opera! Desarrollado por mí y con amor, con más de 5 años de experiencia comercial. ¡IMPORTANTE! Pares recomendados: EURCHF, EURUSD, USDCHF, GBPCAD y EURCAD ¡Precio promocional de sólo 50 USD! ¡El precio pronto aumentará a $ 100 y luego aumentará en $ 50 después de cada 10 compras! Este EA no necesita descripción, pruébelo usted mismo y vea los resul

El patrón de velas Tweezer Bottom está formado por dos velas. He aquí cómo identificar el patrón de velas Tweezer Bottom: La primera vela es bajista La segunda vela es alcista Los mínimos de ambas velas deben estar más o menos al mismo nivel Este patrón de velas alcistas de 2 velas es un patrón de inversión, lo que significa que se utiliza para encontrar mínimos. Por esta razón, queremos ver este patrón después de un movimiento a la baja, mostrando que los toros están empezando a tomar el contro

El patrón de velas Three Outside Up está formado por tres velas. He aquí cómo identificar el patrón de velas Three Outside Up: La primera vela es bajista y pequeña La segunda vela es alcista y envuelve a la primera por completo La tercera vela es alcista y cierra por encima de las demás Este patrón de vela alcista de 3 velas es un patrón de inversión, lo que significa que se utiliza para encontrar mínimos. Por esta razón, queremos ver este patrón después de un movimiento a la baja, mostrando que

El patrón de vela Línea de Contraataque Alcista está formado por dos velas. A continuación te explicamos cómo identificar el patrón de velas Bullish Counterattack: La primera vela es bajista y grande La segunda vela es alcista y pequeña Hay un hueco entre el cierre de la primera vela y la apertura de la segunda. Ambas cierran al mismo nivel Este patrón de vela alcista de 2 velas es un patrón de inversión, lo que significa que se utiliza para encontrar mínimos. Por esta razón, queremos ver este p
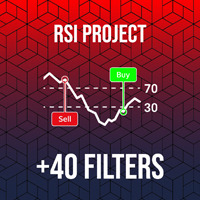
Descubra todo el potencial del trading automatizado con RSI PROject, nuestro vanguardista Asesor Experto (EA) para MT5. Esta sofisticada herramienta está diseñada para agilizar su operativa, ofreciendo una interfaz fácil de usar combinada con potentes filtros y opciones de personalización en profundidad. Si usted es un principiante o un operador experimentado, RSI PROject se adapta a sus necesidades, ayudándole a optimizar estrategias y tomar decisiones informadas con confianza. $32 (quedan 3 co

Libere todo el potencial del trading con el Asesor Experto (EA) Parabolic SAR PROject , una herramienta automatizada y altamente personalizable creada en torno al indicador Parabolic SAR. Este EA está diseñado con filtros avanzados y ajustes flexibles, lo que permite a los operadores gestionar el riesgo de forma eficaz a través de parámetros personalizables como el tamaño del lote, stop-loss, take-profit y filtros de sesión. Con múltiples opciones de confirmación de tendencia y métodos versátil

Hola, traders! Soy Jesús , la máquina definitiva de trading en Oro . Mi estrategia se basa en miles de patrones de velas optimizados, meticulosamente refinados para extraer las mejores configuraciones en XAUUSD . La precisión es mi base, y mi objetivo es simple: dominar el mercado del oro con precisión láser. No soy sólo un Asesor Experto, soy una fuerza implacable en el comercio de oro, diseñado para cortar a través del ruido del mercado y ofrecer resultados excepcionales. Tanto si se trata de
Libere todo el potencial del trading con el Asesor Experto (EA) ADX PROject , una herramienta automatizada altamente personalizable creada en torno al indicador ADX ampliamente utilizado. Este EA está diseñado con filtros avanzados y configuraciones flexibles, lo que permite a los operadores gestionar el riesgo de forma eficaz a través de parámetros personalizables como el tamaño del lote, el stop-loss, el take-profit y los filtros de sesión. Con múltiples opciones de confirmación de tendencia

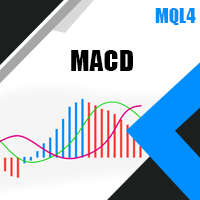
Libere todo el potencial del trading con MACD PROject Expert Advisor (EA) , una herramienta automatizada altamente personalizable basada en el popular indicador MACD. El EA está diseñado con filtros robustos, lo que permite a los operadores gestionar los riesgos a través de ajustes flexibles como el tamaño del lote, stop-loss, take-profit y filtros de sesión. Ofrece múltiples opciones de confirmación de tendencia y métodos de trailing stop, por lo que es adecuado para diversas condiciones de me
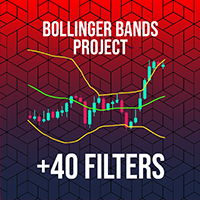
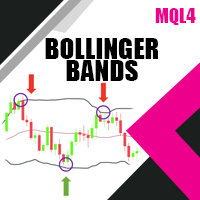
Libere todo el potencial del trading con el Asesor Experto (EA) de las Bandas de Bollinger, una herramienta automatizada y altamente personalizable creada en torno al indicador ampliamente utilizado de las Bandas de Bollinger. Este EA está diseñado con filtros avanzados y configuraciones flexibles, lo que permite a los operadores gestionar el riesgo de forma eficaz a través de parámetros personalizables como el tamaño del lote, stop-loss, take-profit y filtros de sesión. Con múltiples opciones
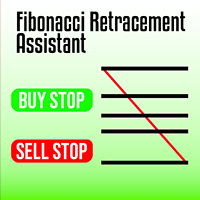
Maximice la eficiencia de sus operaciones con el Asistente de retroceso de Fibonacci para MetaTrader 5. Esta potente herramienta automatiza el proceso de colocación de órdenes Buy Limit y Sell Limit tan pronto como usted dibuja sus niveles de retroceso de Fibonacci. Diseñado para los operadores que buscan precisión y velocidad, elimina el esfuerzo manual de colocación de órdenes, lo que le permite centrarse en el análisis del mercado. Características principales: Colocación automática de órdene

El patrón de vela Hammer está formado por una sola vela. A continuación te explicamos cómo identificar el patrón de velas Hammer: La vela tiene un cuerpo pequeño La mecha en la parte inferior debe ser grande en comparación con el cuerpo En la parte superior, no debe tener mecha, o ser muy pequeña El color del cuerpo no importa Este patrón de vela alcista de 1 vela es un patrón de inversión, lo que significa que se utiliza para encontrar fondos. Por esta razón, queremos ver este patrón después d

GOLD xKiller es un EA de precisión para operar con oro basado en una poderosa verdad del mercado: las tendencias fuertes no se invierten al azar .
Al explotar rachas raras pero de alta probabilidad de más de 5 velas diarias consecutivas en una dirección , esta estrategia se centra en movimientos agotados con un rendimiento histórico excepcional en XAUUSD.
Lógica simple. Selectividad extrema. Resultados respaldados por datos que hablan por sí mismos. - SEÑAL REAL: 3K Señal en vivo : Haga clic aqu

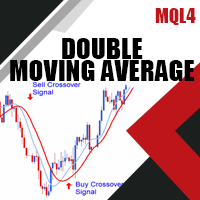
MA Crossover EA es un Asesor Experto de grado profesional construido sobre la poderosa y probada estrategia de Doble Cruce de Medias Móviles , diseñado para dar a los operadores control total, flexibilidad total y personalización ilimitada . El doble cruce de medias móviles es uno de los conceptos de trading más utilizados en el análisis técnico. Es simple, eficaz y adaptable a todos los mercados y plazos - Forex, Oro, Índices, Crypto, y más.
Este EA toma ese concepto clásico y lo eleva a un ma

Euro xKiller es un EA de precisión para EURUSD basado en una poderosa verdad del mercado: las tendencias fuertes no se invierten aleatoriamente .
Al explotar rachas raras pero de alta probabilidad de más de 5 velas diarias consecutivas en una dirección , esta estrategia se centra en movimientos agotados con un rendimiento histórico excepcional en EURUSD.
Lógica simple. Selectividad extrema . Resultados respaldados por datos que hablan por sí mismos. Asesor totalmente automático. - SEÑAL REAL:

Pound xKiller es un EA de precisión para GBPUSD basado en una poderosa verdad del mercado: las tendencias fuertes no se invierten aleatoriamente .
Al explotar rachas raras pero de alta probabilidad de más de 5 velas diarias consecutivas en una dirección , esta estrategia se centra en movimientos agotados con un rendimiento histórico excepcional en GBPUSD.
Lógica simple. Selectividad extrema . Resultados respaldados por datos que hablan por sí mismos. Asesor totalmente automático. - SEÑAL REAL:

GBPJPY xKiller es un EA de precisión para GBPJPY basado en una poderosa verdad del mercado: las tendencias fuertes no se invierten aleatoriamente .
Al explotar rachas raras pero de alta probabilidad de más de 5 velas diarias consecutivas en una dirección , esta estrategia se centra en movimientos agotados con un rendimiento histórico excepcional en GBPJPY.
Lógica simple. Selectividad extrema . Resultados respaldados por datos que hablan por sí mismos. Asesor totalmente automático. - SEÑAL REAL