Osama Echchakery / Verkäufer
Veröffentlichte Produkte
"GA Moving Average" („GA Gleitender Durchschnitt“) ist ein Expert Advisor (EA), der entwickelt wurde, um den Handel basierend auf der Strategie des Gleitenden Durchschnitts automatisiert durchzuführen. Mit seinen anpassbaren Einstellungen ermöglicht dieser EA Tradern, die perfekte Strategie zu erstellen, indem verschiedene Parameter an ihre Handelspräferenzen angepasst werden.
Das Hauptkonzept des EAs "GA Moving Average" basiert auf der Verwendung von gleitenden Durchschnittsindikatoren zur Id
FREE

Jesus XAUUSD ist ein professioneller EA für den Goldhandel, der speziell für den XAUUSD entwickelt wurde. Er nutzt eine fortschrittliche Erkennung von Preisaktionsmustern und eine Multi-Timeframe-Analyse, um stabile und präzise Einstiege in Gold zu ermöglichen. Dieser Expert Advisor wurde für Händler entwickelt, die einen echten XAUUSD-Roboter auf institutioneller Ebene mit echter Candlestick-Logik suchen, der durch über 100.000 Optimierungszyklen getestet wurde. - ECHTES SIGNAL : 5K Live-Signal

Infi Trade: Revolutionieren Sie Ihr Trading mit Fortschrittlicher Automatisierung Entfesseln Sie die Macht des Automatisierten Handels: Infi Trade ist ein hochmoderner Expert Advisor, der für Trader konzipiert wurde, die im Forex-Markt Effizienz und Profitabilität anstreben. Unser EA nutzt die ausgeklügelte Grid-Hedge-Strategie, um Ihre Handelsmöglichkeiten zu maximieren und ein nahtloses, automatisiertes Handelserlebnis zu bieten. Intelligente Grid-Hedge-Strategie: Im Kern von Infi Trade liegt

Hallo, liebe Trader, ich bin Jesus , die ultimative GBP-Handelsmaschine . Meine Strategie basiert auf Tausenden von optimierten Kerzenmustern, die akribisch verfeinert wurden, um die besten Setups für GBPUSD zu finden. Präzision ist meine Grundlage, und mein Ziel ist einfach: den GBPUSD-Markt mit laserscharfer Präzision zu dominieren. Ich bin nicht nur ein Expert Advisor - ich bin eine unerbittliche Kraft im GPBUSD-Handel, die das Marktrauschen durchbricht und außergewöhnliche Ergebnisse liefer
"GA Moving Average" („GA Gleitender Durchschnitt“) ist ein Expert Advisor (EA), der entwickelt wurde, um den Handel basierend auf der Strategie des Gleitenden Durchschnitts automatisiert durchzuführen. Mit seinen anpassbaren Einstellungen ermöglicht dieser EA Tradern, die perfekte Strategie zu erstellen, indem verschiedene Parameter an ihre Handelspräferenzen angepasst werden.
Das Hauptkonzept des EAs "GA Moving Average" basiert auf der Verwendung von gleitenden Durchschnittsindikatoren zur Id
FREE

Erschließen Sie die Möglichkeiten des automatisierten Handels mit dem vollautomatischen Fibonacci Retracement EA für MetaTrader 5. Dieser Expert Advisor identifiziert dynamisch Fibonacci-Retracement-Levels und platziert Trades auf der Grundlage von Kerzenformationen - völlig freihändig. Er wurde entwickelt, um Ihren Handelsprozess zu vereinfachen, und gewährleistet eine genaue und zeitnahe Ausführung, ohne dass Sie ihn ständig überwachen müssen. Hauptmerkmale: Automatisierte Handelsausführung :
Schöpfen Sie das volle Potenzial des Handels mit dem Stochastic Oscillator PROject Expert Advisor (EA) aus , einem hochgradig anpassbaren, automatisierten Tool, das auf dem weit verbreiteten Indikator Stochastic Oscillator basiert. Dieser EA ist mit fortschrittlichen Filtern und flexiblen Einstellungen ausgestattet und ermöglicht Händlern ein effektives Risikomanagement durch anpassbare Parameter wie Losgröße, Stop-Loss, Take-Profit und Session-Filter. Mit mehreren Trendbestätigungsoptionen und
"GA Moving Average" („GA Gleitender Durchschnitt“) ist ein Expert Advisor (EA), der entwickelt wurde, um den Handel basierend auf der Strategie des Gleitenden Durchschnitts automatisiert durchzuführen. Mit seinen anpassbaren Einstellungen ermöglicht dieser EA Tradern, die perfekte Strategie zu erstellen, indem verschiedene Parameter an ihre Handelspräferenzen angepasst werden.
Das Hauptkonzept des EAs "GA Moving Average" basiert auf der Verwendung von gleitenden Durchschnittsindikatoren zur Id
FREE

Wir stellen Ihnen Last Hope EA vor, einen meiner besten 30 persönlichen EAs, den bahnbrechenden MQL4-Expertenberater, der die Art und Weise, wie Sie handeln, verändert! Von mir und mit Liebe entwickelt, mit über 5 Jahren Handelserfahrung. WICHTIG! Empfohlene Paare: EURCHF, EURUSD, USDCHF, GBPCAD und EURCAD Aktionspreis von nur 50 USD ! Der Preis wird bald auf 100 USD steigen und dann nach jeweils 10 Käufen um 50 USD steigen! Für diesen EA ist keine Beschreibung erforderlich. Testen

Das Tweezer Bottom Candlestick-Muster wird von zwei Kerzen gebildet. So erkennen Sie das Tweezer Bottom Candlestick-Muster: Die erste Kerze ist bärisch Die zweite Kerze ist bullisch Die Tiefststände beider Kerzen sollten ziemlich genau auf demselben Niveau liegen. Dieses bullische 2-Kerzen-Muster ist ein Umkehrmuster, d.h. es wird verwendet, um Tiefpunkte zu finden. Aus diesem Grund wollen wir dieses Muster nach einer Abwärtsbewegung sehen, die zeigt, dass die Bullen beginnen, die Kontrolle zu ü

Das Candlestick-Muster Three Outside Up wird durch drei Kerzen gebildet. Hier erfahren Sie, wie Sie das Three Outside Up Candlestick-Muster erkennen können: Die erste Kerze ist bärisch und klein Die zweite Kerze ist bullisch und verschlingt die erste Kerze vollständig Die dritte Kerze ist bullisch und schließt über den anderen Kerzen Dieses bullische 3-Kerzen-Muster ist ein Umkehrmuster, d.h. es wird verwendet, um Tiefpunkte zu finden. Aus diesem Grund wollen wir dieses Muster nach einer Abwärts

Das Kerzenmuster Bullish Counterattack Line wird von zwei Kerzen gebildet. Hier erfahren Sie, wie Sie das Bullish Counterattack Candlestick-Muster erkennen können: Die erste Kerze ist bärisch und groß Die zweite Kerze ist bullisch und klein Es gibt eine Lücke zwischen dem Schluss der ersten Kerze und der Eröffnung der zweiten Kerze Beide Kerzen schließen auf demselben Niveau Dieses bullische 2-Kerzen-Muster ist ein Umkehrmuster, d.h. es wird verwendet, um Tiefpunkte zu finden. Aus diesem Grund w
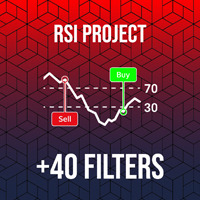
Entdecken Sie das volle Potenzial des automatisierten Handels mit RSI PROject, unserem hochmodernen MT5 Expert Advisor (EA). Dieses hochentwickelte Tool wurde entwickelt, um Ihre Handelsreise zu optimieren. Es bietet eine benutzerfreundliche Oberfläche in Kombination mit leistungsstarken Filtern und tiefgreifenden Anpassungsoptionen. Egal, ob Sie ein Anfänger oder ein erfahrener Trader sind, RSI PROject passt sich Ihren Bedürfnissen an und hilft Ihnen, Strategien zu optimieren und fundierte Ents

Schöpfen Sie das volle Potenzial des Handels mit dem Parabolic SAR PROject Expert Advisor (EA) aus , einem hochgradig anpassbaren, automatisierten Tool, das auf dem weit verbreiteten Parabolic SAR-Indikator basiert. Dieser EA ist mit fortschrittlichen Filtern und flexiblen Einstellungen ausgestattet und ermöglicht Händlern ein effektives Risikomanagement durch anpassbare Parameter wie Losgröße, Stop-Loss, Take-Profit und Session-Filter. Mit mehreren Trendbestätigungsoptionen und vielseitigen Tr

Hallo, liebe Trader, ich bin Jesus , die ultimative Goldhandelsmaschine . Meine Strategie basiert auf Tausenden von optimierten Kerzenmustern, die akribisch verfeinert wurden, um die besten Setups für den XAUUSD zu finden. Präzision ist meine Grundlage, und mein Ziel ist einfach: den Goldmarkt mit laserscharfer Genauigkeit zu dominieren. Ich bin nicht nur ein Expert Advisor - ich bin eine unerbittliche Kraft im Goldhandel, die das Marktrauschen durchbricht und außergewöhnliche Ergebnisse liefert
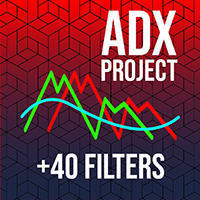
Schöpfen Sie das volle Potenzial des Handels mit dem ADX PROject Expert Advisor (EA) aus , einem hochgradig anpassbaren, automatisierten Tool, das auf dem weit verbreiteten ADX-Indikator basiert. Dieser EA ist mit fortschrittlichen Filtern und flexiblen Einstellungen ausgestattet und ermöglicht Händlern ein effektives Risikomanagement durch anpassbare Parameter wie Losgröße, Stop-Loss, Take-Profit und Session-Filter. Mit mehreren Trendbestätigungsoptionen und vielseitigen Trailing-Stop-Methoden

Schöpfen Sie das volle Potenzial des Handels mit dem MACD PROject Expert Advisor (EA) aus, einem hochgradig anpassbaren, automatisierten Tool auf Basis des beliebten MACD-Indikators. Der EA ist mit robusten Filtern ausgestattet, die es Händlern ermöglichen, Risiken durch flexible Einstellungen wie Losgröße, Stop-Loss, Take-Profit und Session-Filter zu verwalten. Er bietet mehrere Trendbestätigungsoptionen und Trailing-Stop-Methoden, wodurch er sich für verschiedene Marktbedingungen eignet. Prei
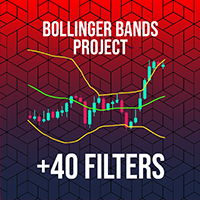
Schöpfen Sie das volle Potenzial des Handels mit dem Bollinger Bands Expert Advisor (EA) aus , einem hochgradig anpassbaren, automatisierten Tool, das auf dem weit verbreiteten Bollinger Bands Indikator basiert. Dieser EA ist mit fortschrittlichen Filtern und flexiblen Einstellungen ausgestattet und ermöglicht Händlern ein effektives Risikomanagement durch anpassbare Parameter wie Losgröße, Stop-Loss, Take-Profit und Session-Filter. Mit mehreren Trendbestätigungsoptionen und vielseitigen Traili
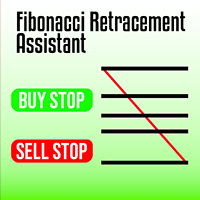
Maximieren Sie Ihre Handelseffizienz mit dem Fibonacci Retracement Assistant für MetaTrader 5. Dieses leistungsstarke Tool automatisiert den Prozess der Einstellung von Buy-Limit- und Sell-Limit-Orders, sobald Sie Ihre Fibonacci-Retracement-Levels einzeichnen. Es wurde für Händler entwickelt, die Präzision und Schnelligkeit suchen, und eliminiert den manuellen Aufwand der Orderplatzierung, so dass Sie sich auf die Marktanalyse konzentrieren können. Hauptmerkmale: Automatische Orderplatzierung :

Das Hammer-Candlestick-Muster wird durch eine einzige Kerze gebildet. Hier erfahren Sie, wie Sie das Hammer-Kerzenmuster erkennen können: Die Kerze hat einen kleinen Körper Der Docht an der Unterseite muss im Vergleich zum Körper groß sein. Oben sollte sie keinen Docht haben oder sehr klein sein. Die Farbe des Körpers spielt keine Rolle. Dieses bullische 1-Kerzen-Muster ist ein Umkehrmuster, d.h. es wird verwendet, um Tiefpunkte zu finden. Aus diesem Grund wollen wir dieses Muster nach einer Ab

GOLD xKiller ist ein präziser EA für den Goldhandel, der auf einer mächtigen Marktwahrheit beruht: Starke Trends kehren nicht zufällig um .
Diese Strategie nutzt die seltenen, aber sehr wahrscheinlichen Schwankungen von mehr als 5 aufeinanderfolgenden Tageskerzen in eine Richtung und zielt auf erschöpfte Bewegungen mit außergewöhnlicher historischer Performance beim XAUUSD ab.
Einfache Logik. Extreme Selektivität. Datengestützte Ergebnisse, die für sich selbst sprechen. vollautomatischer Berater

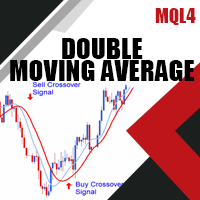
MA Crossover EA ist ein professioneller Expert Advisor, der auf der leistungsstarken und bewährten Double Moving Average Crossover-Strategie aufbaut, um Händlern volle Kontrolle, volle Flexibilität und unbegrenzte Anpassungsmöglichkeiten zu bieten. Der Crossover des doppelten gleitenden Durchschnitts ist eines der am häufigsten verwendeten Handelskonzepte in der technischen Analyse. Es ist einfach, effektiv und anpassungsfähig an alle Märkte und Zeitrahmen - Forex, Gold, Indizes, Krypto und meh

Euro xKiller ist ein Präzisions-EA für den EURUSD-Handel , der auf einer mächtigen Marktwahrheit aufbaut: Starke Trends kehren sich nicht zufällig um .
Durch die Ausnutzung seltener, aber hochwahrscheinlicher Streifen von 5+ aufeinanderfolgenden Tageskerzen in einer Richtung zielt diese Strategie auf erschöpfte Bewegungen mit außergewöhnlicher historischer Performance auf EURUSD ab.
Einfache Logik. Extreme Selektivität. datengestützte Ergebnisse, die für sich selbst sprechen. vollautomatischer

Pound xKiller ist ein Präzisions-EA für den GBPUSD-Handel , der auf einer starken Marktwahrheit aufbaut: Starke Trends kehren sich nicht zufällig um .
Durch die Ausnutzung seltener, aber sehr wahrscheinlicher Streifen von 5+ aufeinanderfolgenden Tageskerzen in einer Richtung zielt diese Strategie auf erschöpfte Bewegungen mit außergewöhnlicher historischer Performance auf GBPUSD.
Einfache Logik. Extreme Selektivität. datengestützte Ergebnisse, die für sich selbst sprechen. vollautomatischer Be

GBPJPY xKiller ist ein Präzisions-EA für den GBPJPY-Handel , der auf einer mächtigen Marktwahrheit aufbaut: Starke Trends kehren sich nicht zufällig um .
Durch die Ausnutzung seltener, aber sehr wahrscheinlicher Streifen von 5+ aufeinanderfolgenden Tageskerzen in einer Richtung zielt diese Strategie auf erschöpfte Bewegungen mit außergewöhnlicher historischer Performance beim GBPJPY.
Einfache Logik. Extreme Selektivität. datengestützte Ergebnisse, die für sich selbst sprechen. vollautomatische