CandleFilter
- Indicadores
- Igor Gerasimov
- Versión: 1.1
- Actualizado: 12 abril 2023
- Activaciones: 5
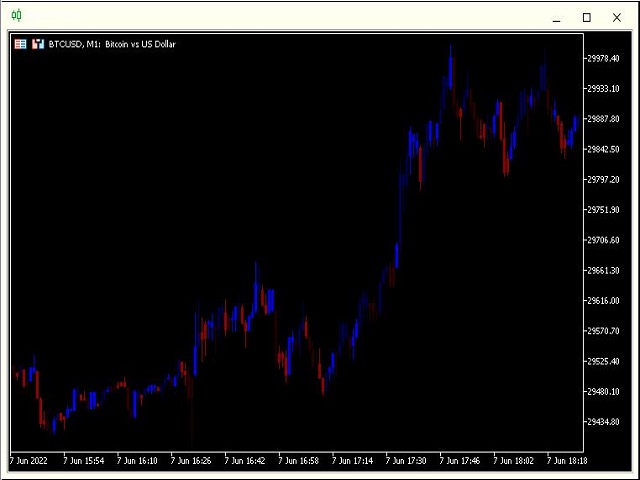
Este indicador muestra información de precios filtrada
en forma de gráfico de velas utilizando 64 gamas de colores.
Perfectamente útil para determinar la fuerza de la dirección del movimiento del precio.
Este indicador no tiene ninguna configuración.
Los 64 colores ya están incluidos en el programa,
cuanto más brillante es el color azul, más fuerte es la fuerza del movimiento para comprar,
y cuanto más brillante sea el color rojo, más fuerte será la fuerza del movimiento para vender.
//////////////////////////////////////////////////////////////////////////////////
Espero que este indicador le sea muy útil para operar con éxito.
Buena suerte.