CandleFilter
- 指标
- Igor Gerasimov
- 版本: 1.1
- 更新: 12 四月 2023
- 激活: 5
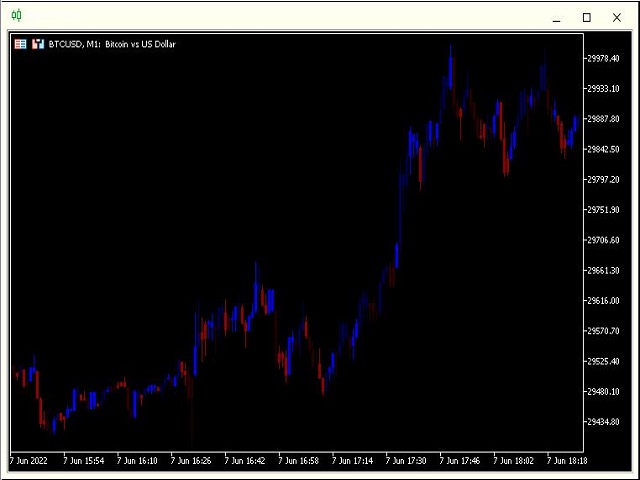
該指標顯示過濾後的價格信息
以燭台圖的形式使用 64 個顏色範圍。
對於確定價格走勢方向的強度非常有用。
該指標沒有任何設置。
所有 64 種顏色都已包含在程序中,
藍色越亮,運動購買力越強,
並且紅色越亮,運動賣出的力量越強。
////////////////////////////////
////////////////////////////////
我希望這個指標對您成功交易非常有用。
祝你好運。
////////////////////////////////
////////////////////////////////
////////////////////////////////
////////////////////////////////