• 概要
  • レビュー
  • コメント
  • 最新情報

CandleFilter

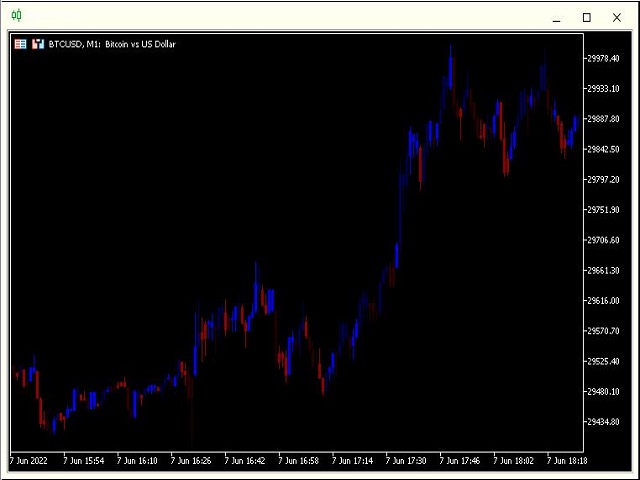
このインジケーターは、フィルターされた価格情報を表示します
64色の範囲を使用したローソク足チャートの形式で。
価格変動の方向性の強さを判断するのに最適です。
このインジケーターには設定がありません。
64色すべてがすでにプログラムに含まれています。
青い色が明るいほど、購入する運動の力が強くなります。
そして赤い色が明るいほど、販売する運動の力が強くなります。
///////////////////////////////////////////////////////
///////////////////////////////////////////////////////
この指標が取引の成功に非常に役立つことを願っています。
幸運を。
おすすめのプロダクト
Limitless MT5 is a universal indicator suitable for every beginner and experienced trader. works on all currency pairs, cryptocurrencies, raw stocks Limitless MT5 - already configured and does not require additional configuration And now the main thing Why Limitless MT5? 1 complete lack of redrawing 2 two years of testing by the best specialists in trading 3 the accuracy of correct signals exceeds 80% 4 performed well in trading during news releases Trading rules 1 buy signa
革新的な MT5 インジケーター、DARWIN Assistant   をご紹介します。これは、トレーディングを成功させる世界への究極のゲートウェイです。精度と専門知識に基づいて設計された DARWIN Assistant   は、RSI、ストキャスティクス、CCI、トレンドなどの高度なテクニカル指標をすべての時間枠にわたって活用する特別な戦略に基づいて動作します。この最先端のインジケーターはエントリーのための最も正確なシグナルを提供し、比類のない自信を持って市場をナビゲートできるようにするため、並外れた取引体験に備えてください。 DARWIN Assistant   を使用すると、最も収益性の高い取引機会を検出するために細心の注意を払って調整された、重要な指標の包括的な分析にアクセスできるようになります。不確実性に別れを告げ、情報に基づいた意思決定の新時代を迎えましょう。 RSI、ストキャスティクス、CCI、トレンドを DARWIN Assistant   内でシームレスに統合することでその力を解き放ち、これまでにないほど市場のダイナミクスを鮮明に描きます。 DARWIN
Introduction to X3 Chart Pattern Scanner X3 Cherart Pattern Scanner is the non-repainting and non-lagging indicator detecting X3 chart patterns including Harmonic pattern, Elliott Wave pattern, X3 patterns, and Japanese Candlestick patterns. Historical patterns match with signal patterns. Hence, you can readily develop the solid trading strategy in your chart. More importantly, this superb pattern scanner can detect the optimal pattern of its kind. In addition, you can switch on and off individu
CoioteTarget
Alexandre Moraes De Souza Lima
Projeção de alvos harmônicos com dois cliques, os alvos possuem melhor qualidade quando ancorados em candles climáticos, seja de ignição ou exaustão ou em pivôs de alto volume. Funciona com qualquer ativo (volume real e volume tick), em qualquer tempo gráfico, ações, indicies, futuros, forex, criptomoedas, commodities, energia, mineiro e qualquer outro. As projeções devem respeitar os princípios de confluência e simetria, portanto não devem ser utilizados unicamente como critério de decisão, se
Elliott Wave Trend was designed for the scientific wave counting. This tool focuses to get rid of the vagueness of the classic Elliott Wave Counting using the guideline from the template and pattern approach. In doing so, firstly Elliott Wave Trend offers the template for your wave counting. Secondly, it offers Wave Structural Score to assist to identify accurate wave formation. It offers both impulse wave Structural Score and corrective wave Structure Score. Structural Score is the rating to sh
このインジケーターは、H.M.Gartley (「株式市場の利益」、1935 年) の開発に従って調和パターン (XABCD) を識別します。 D 点を透視投影の点として投影します (設定で ProjectionD_Mode = true を指定します)。 再描画はしません。 作業時間枠のバーが閉じるとき、特定されたパターン ポイントが Patterns_Fractal_Bars バーの間に移動していない場合、チャート上に (予想される価格変動の方向に) 矢印が表示されます。 この瞬間から、矢印はチャート上に永久に残ります。 連続した 2 ~ 3 つ以上の矢印 - これは市場状況の変化であり、再描画/再描画ではありません (時間枠を前後に切り替えてはなりません)。 注: 2 ~ 3 つ以上の矢印が連続している場合 - これは市況の変化であり、再描画ではありません。 パターンの総数は 85 です (Gartley-222 と Gartley-222WS を含む。完全なリストはコメント セクションにあります)。 識別されたすべてのパターンのうち、最後に識別されたパター
稼ぎと研究のためのツール。 トレーディングシグナルと戦略の中核は、価格予測パターンを形成するための著者のアルゴリズムに基づいています。どんな楽器にも使えます! MA「九尾の狐」に基づく制御システムが追加され、市場、機器、および作業期間に合わせて信号を可能な限り正確に更新および調整します。 対象:すべての市場のすべての商品(例外があります)。 対象者:ヘッジファンド、ファンドおよび資産運用会社、投資運用会社、投機家、投資家および利害関係者。 .................................................................................................................................................................................
The Smooth Price technical indicator is used for plotting a smoothed line as close to the price of the financial instrument as possible, and serves to eliminate its noise components. The indicator is part of the Monarch trading system, but here it is presented as an independent technical analysis tool. The indicator is based on the cluster digital filter , which, unlike the ClusterSMA , is applied directly to the price time series. Smooth Price does not redraw (except the very last, zero bar) an
Introduction to Harmonic Volatility Indicator Harmonic Volatility Indicator is the first technical analysis applying the Fibonacci analysis to the financial volatility. Harmonic volatility indicator is another level of price action trading tool, which combines robust Fibonacci ratios (0.618, 0.382, etc.) with volatility. Originally, Harmonic Volatility Indicator was developed to overcome the limitation and the weakness of Gann’s Angle, also known as Gann’s Fan. We have demonstrated that Harmonic
This indicator is based on the crossing of two Moving Average with the RSI It is intended for scalpers Specially designed for Boom and Crash syhtetic indices from Binary.com/Deriv.com It is easy to use and intuitive. We recommend its use on M1 and is equipped with three types of notification Email alert Sound notification Push notification these parameters can be activated and deactivated.
スイングトレーディング は、トレンドの方向のスイングと可能な反転スイングを検出するように設計された最初のインジケーターです。トレーディングの文献で広く説明されているベースラインスイングトレーディングアプローチを使用します。インディケータは、いくつかの価格と時間のベクトルを調査して、全体的なトレンドの方向を追跡し、市場が売られ過ぎまたは買われ過ぎて修正の準備ができている状況を検出します。 [ インストールガイド | 更新ガイド | トラブルシューティング | よくある質問 | すべての製品 ] むち打ちを起こさずに市場スイングの利益 インジケーターは常にトレンドの方向を表示します 色付きの価格帯は機会のベースラインを表します 色付きのダッシュは、可能な反転スイングを表します この指標は、独自の品質とパフォーマンスを分析します 複数時間枠のダッシュボードを実装します カスタマイズ可能なトレンドおよびスイング期間 電子メール/サウンド/プッシュアラートを実装します インジケータは再描画またはバックペインティングではありません Swing Tradingとは Swing Tradi
Win43 Scalper
Eadvisors Software Inc.
O novo s43 Scalper para Mini-Índice (WIN-IND) faz operações de curto prazo no timeframe 1min buscando pequenas variações do mercado, utiliza nova tecnologia de trade, os resultados no intraday são íncríveis, confira:      Após a instalação adicione no gráfico dos instrumentos win para visualizar os resultados no backteste. Recomendamos o timeframe de 1min.
QuantXMarketScanner is a multi assets indicator for MT5 - Mathematical model based on 7 custom moving averages indicators  - Adaptable on Currencies, Stocks and Crypto - Automatic setup, self optimized About QuantXsystem Products: –         Simple installation & integration into MT5   –         Unlimited License after purchase (for one user) –         Automatic pattern recognition to identify the best timing and price levels. –         Trading indicators are displayed directly and automatica
This is the spike indicator , determining the highest high and lowest lows of price in the given period ,  it is also a zigzag indicator , to it may recalculate the values  or repaint if a new higher high or lower low forms in that given period,so beware How ever the indicator can be very powerful when used with other technical indicators for entry confirmation  Be sure to check out some of my other premium products   
プレミアムレベルは、正しい予測の精度が80%を超える独自の指標です。 この指標は、最高のトレーディングスペシャリストによって2か月以上テストされています。 あなたが他のどこにも見つけられない作者の指標! スクリーンショットから、このツールの正確さを自分で確認できます。 1は、1キャンドルの有効期限を持つバイナリーオプションの取引に最適です。 2はすべての通貨ペア、株式、商品、暗号通貨で機能します 手順: 赤い矢印が表示されたらすぐにダウントレードを開き、青い矢印が表示されたら閉じます。青い矢印の後に開くこともできます。 試してテストしてください!推奨設定はデフォルトです! 日足チャートで最高の精度を示します! インディケータは、2600 Pipsの収益性に対して、約10Pipsという非常に小さなマージンを使用します。
Multi-currency, multi-timeframe, harmonic pattern indicator AB = CD. Supports sending push notifications about signals to a mobile device, messages on e-mail, as well as messages using alerts on all available currency pairs and timeframes. This indicator was based on the indicator Harmonic ABCD Universal. Version for MetaTrader 5:  https://www.mql5.com/en/market/product/44972 . See also: Harmonic ABCD Universal for MetaTrader 4 . Using modern software development methods has made the indicator a
A scalping indicator based on mathematical patterns, which on average gives signals with relatively small SL, and also occasionally helps to catch big moves in the markets (more information in the video) This indicator has three main types of notifications: The first type warns of a possible/upcoming signal on the next bar The second type indicates the presence of a ready signal to enter the market/open a position The third type is for SL and TP levels - you will be notified every time price r
How to use? • Buy Low and Sell High. • Brighter zones means strong Support or Resistance. • Weaker zones appear lighter. • Brighter zones are formed by overlapping of lines from multiple levels of support or resistance. Indicator Menu • The indicator can input 5 different Lengths. • The default settings uses 13, 21, 52, 100 & 200. • Every option are customizable.
This is a multi frame stochastic indicator, you can attach any time frame of stoch indicator on one chart. It is very useful if you like to check multi time frame stoch data. If you are interested in EA,click below links to take a look: https://www.mql5.com/en/market/product/80170 https://www.mql5.com/en/market/product/81136 How to use: > Atach the first time frame you want on to the currency pair's chart > Atach the second time frame you want on to the currency pair's   chart > Atach the thir
FREE
AW Candle Patterns
AW Trading Software Limited
AWキャンドルパターンインジケーターは、強力なキャンドルパターンスキャナーと組み合わせた高度なトレンドインジケーターの組み合わせです。これは、最も信頼性の高い30のローソク足パターンを認識して強調表示するための便利なツールです。さらに、それは色付きのバーに基づく現在の傾向分析器です。     サイズ変更と配置が可能なプラグインマルチタイムフレームトレンドパネル。トレンドフィルタリングに応じてパターンの表示を調整する独自の機能。 利点: キャンドルパターンを簡単に識別 結果を再描画しません 内蔵のマルチタイムトレンドパネル 無効なパターンタイプ(1、2、3キャンドル) パターン表示時のトレンドフィルタリングの調整 MT4 version  表示されるパターンのリスト: ハンマーパターン ピンアップ/ピンダウン 弱気なハラミ/強気なハラミ 弱気のハラミクロス/強気のハラミクロス ピボットポイント反転アップ/ピボットポイント反転ダウン ダブルバーローとハイクローズ/ダブルバーローとロークローズ 終値反転アップ/終値反転ダウン ニュートラルバー/       2つのニュートラルバー ダブルイン
Forex BUY and SELL signals from the best Heiken Ashi Smoothed indicator. Draw bullish/bearish bars on the chart. Accurate trend detector. Heiken Ashi Smoothed is a simple MT5 indicator that draws bullish and bearish bars in the chart to reflect the direction of the trend. The indicator consists of orange bearish bars and green bullish bars. When the trend changes its direction, the indicator changes its color. The indicator is a modernization of the traditional Heiken Ashi indicator. Moving Aver
Welcome to the world of SMC (Smart Money Concepts) Trading, where we empower traders with the tools and knowledge to make smarter trading decisions. Our latest addition to our suite of trading tools is the SMC Trading Pro indicator, version 1.0. Key Features: Major Market Structure Identification with BODY break. Order Block must be in Major Swing ( not Small Swing ). Order Block with Fair Value Gap Detection. Order Block in Discount | Premium zone. Filter for only Bullish, Bearish or All Order
The indicator displays the delta and the cumulative delta based on the "Time & Sales" deals list data. In addition to the standard timeframes, the indicator displays data regarding the seconds timeframes (S5, S10, S15, S20, S30) to choose from. Using the rectangle, user can select an arbitrary area in the indicator subwindow to view the ratio of the volumes of deals of buyers and sellers within this area. Indicator features: The indicator works correctly only on those trading symbols for whi
Naked Forex Big Shadow Indicator Big Shadow Indicator is a pattern recognition indicator for Forex, Stocks, Indices, Futures, Commodities and Cryptos. When you have a Big Shadow on your chart then this is a strong signal meaning that you might be ahead of a reversal. You can take other elements (momentum, trend, volatility, price action, fundamentals) to build a complete strategy and confirm your entries. Beware that you might not make money just following the arrows generated by the pattern r
123パターン は、最も人気のある強力で柔軟なチャートパターンの1つです。このパターンは、3つの価格ポイントで構成されています。ボトム、ピークまたはバレー、および38.2%〜71.8%のフィボナッチリトレースメントです。パターンは、価格が最後のピークまたは谷、インディケーターが矢印をプロットし、アラートを上昇させ、取引を行うことができる瞬間を超えたときに有効と見なされます。 [ インストールガイド | 更新ガイド | トラブルシューティング | よくある質問 | すべての製品 ] クリアな取引シグナル カスタマイズ可能な色とサイズ パフォーマンス統計を実装します カスタマイズ可能なフィボナッチリトレースメントレベル 適切なストップロスおよび利益レベルを表示します インジケーターを使用して、継続パターンまたは反転パターンを見つけることができます 再描画および非再描画ではありません 電子メール/音声/視覚アラートを実装します 123パターン は、継続パターンまたは反転パターンとして現れます。物事を簡単にするために、このインジケーターを使用して、検索するパターンのタイプを選択でき
Introduction Harmonic Patterns are best used to predict potential turning point. Traditionally, Harmonic Pattern was identified manually connecting peaks and troughs points in the chart. Manual harmonic pattern detection is painfully tedious and not suitable for everyone. You are often exposed under subjective pattern identification with manual pattern detection. To avoid these limitations, Harmonic Pattern Plus was designed to automate your harmonic pattern detection process. The functionality
Introduction Excessive Momentum Indicator is the momentum indicator to measure the excessive momentum directly from raw price series. Hence, this is an extended price action and pattern trading. Excessive Momentum Indicator was originally developed by Young Ho Seo. This indicator demonstrates the concept of Equilibrium Fractal Wave and Practical Application at the same time. Excessive Momentum detects the market anomaly. Excessive momentum will give us a lot of clue about potential reversal and
IVISTscalp5
Vadym Zhukovskyi
5 (3)
iVISTscalp5インジケーターをご紹介します。このインジケーターは、トレーディングにおいて独自でありながら効果的です。時間データに基づくこのインジケーターは、多年にわたる経験と金融市場の深い分析の結果です。iVISTscalp5インジケーターは、手動トレーディングにとって優れたツールです。便利さ、簡単さ、可視化 - すべての複雑さが内部に隠されています。私たちは、iVISTscalp5インジケーターの設定と使用を最大限に簡素化しました。このインジケーターは、MT5ターミナルにあるすべての金融商品に適しています。 稼働時間は、4時から20時(UTC+3)です。 iVISTscalp5インジケーターメニュー(スクリーンショット1を参照): History - 引用を計算する週数 dT_min - 時間間隔の選択(分) TFline - 水平ボリュームの作成(時間枠) BARSline - 水平ボリュームの作成(バー数) TFtrend1 - デイリーチャンネルの作成(時間枠) BARStrend1 - デイリーチャンネルの作成(バー数) TFtrend2 - 週次チャンネルの作成(時
Matreshka
Dimitr Trifonov
5 (1)
Matreshka self-testing and self-optimizing indicator: 1. Is an interpretation of the Elliott Wave Analysis Theory. 2. Based on the principle of the indicator type ZigZag, and the waves are based on the principle of interpretation of the theory of DeMark. 3. Filters waves in length and height. 4. Draws up to six levels of ZigZag at the same time, tracking waves of different orders. 5. Marks Pulsed and Recoil Waves. 6. Draws arrows to open positions 7. Draws three channels. 8. Notes support and re
PTS - Precision Trading Systemsによるダイバージェンスバイファインダー Precision Divergence Finderは、市場の底を非常に正確に見つけることを目的としており、頻繁に成功しています。 テクニカル分析において、底を選ぶ技術は通常、トップを選ぶよりもはるかに簡単です。このアイテムは、まさにこのタスクのために設計されました。ブルシューダイバージェンスが識別された後、買い物をする前にトレンドが上向きに転換するのを待つのが賢明です。10本または20本のバーの高値を入力するか、移動平均15-30を上昇中に使用してトレンドの変化を特定できます。 この複雑なアルゴリズムは、リアルタイムのバーバーベースでアクティブなデマンドインデックスのダイバージェンスの数を検出し、カウントします。 モデルは、市場価格が新しい安値を付けており、デマンドインデックスが新しい安値を付けていないときに、ダイバージェンスが発生していると観察します。 このインジケーターは、2つの設定を使用します。 1. デマンドインデックス(DI)の長さは、インジケー
このプロダクトを購入した人は以下も購入しています
Bill Williams Advanced is designed for automatic chart analysis using Bill Williams' "Profitunity" system. The indicator analyzes four timeframes at once. Manual (Be sure to read before purchasing) Advantages 1. Automatically analyzes the chart using the "Profitunity" system of Bill Williams. The found signals are placed in a table in the corner of the screen. 2. Equipped with a trend filter based on the Alligator indicator. Most of the system signals are recommended to be used only accordi
note: this indicator is for METATRADER4, if you want the version for METATRADER5 this is the link:  https://www.mql5.com/it/market/product/108106 TRENDMAESTRO recognizes a new TREND in the bud, he never makes mistakes. The certainty of identifying a new TREND is priceless. DESCRIPTION TRENDMAESTRO identifies a new TREND in the bud, this indicator examines the volatility, volumes and momentum to identify the moment in which there is an explosion of one or more of these data and therefore the mome
VTrende Pro
Andrii Diachenko
5 (1)
VTrende Pro - MTF indicator for trend trading with a display panel for MT5 *** Videos can be translated into any language using subtitles (video language - Russian) Although the signals of the VTrende Pro indicator can be used as signals of a full-fledged trading system, it is recommended to use them in conjunction with the Bill Williams TS. VTrende Pro is an extended version of the VTrende indicator. Difference between Pro version and VTrende: - Time zones - Signal V - signal 1-2 waves
SMCpro MT5  Original Price  $440   ---  Currently Price  40% OFF  ( for unlimited use ) Hello World! Introducing.. SMCpro tool and Indicator for  MetaTrader 5 , a cutting-edge feature designed to revolutionize your trading experience. With innovative ICT Smart Money Concept, you gain unparalleled insight into market dynamics, empowering you to make informed trading decisions like never before. Built on the foundation of advanced algorithms and real-time data analysis, SMCpro tool and Indicat
Weis Wave with Alert MT5
Trade The Volume Waves Single Member P.C.
4.93 (15)
Rental/Lifetime Package Options and Privileges  * For optimum results the yearly or lifetime package is suggested due to live training ! Rent Monthly Six Months   Yearly/Lifetime Weis Wave with Speed with Alert+Speed Index x x x Manual  x x x Quick Set up Video x x x Blog x x x Lifetime Updates x x x Setup and Training Material x x Free Rectangle Break Alert Tool      x Discord Access Channel "The SI traders" x 2-hour live methodology training x How to trade with it:    http://
これはほぼ間違いなく、MetaTraderプラットフォームで見つけることができる最も完全な調和価格形成自動認識インジケーターです。 19種類のパターンを検出し、フィボナッチプロジェクションをあなたと同じように真剣に受け止め、潜在的逆転ゾーン(PRZ)を表示し、適切なストップロスとテイクプロフィットレベルを見つけます。 [ インストールガイド | 更新ガイド | トラブルシューティング | よくある質問 | すべての製品 ] 19の異なる調和価格形成を検出します プライマリ、派生および補完フィボナッチ投影(PRZ)をプロットします 過去の価格行動を評価し、過去のすべてのパターンを表示します この指標は、独自の品質とパフォーマンスを分析します 適切なストップロスとテイクプロフィットのレベルを表示します ブレイクアウトを使用して適切な取引を通知します すべてのパターン比をグラフにプロットします 電子メール/音声/視覚アラートを実装します スコット・M・カーニーの本に着想を得て、この指標は最も純粋で急を要するトレーダーのニーズを満たすように設計されています。ただし、トレードを
RAD CRITICAL LEVES RAD indicator tracks “Relevant Volume” in real time, identifying accumulation and distribution processes, projecting them in the chart as SUPPORT or RESISTANCE zones. Natural   support   and resistance levels are generated by Volume Accumulation and Distribution processes. As these processes evolve, levels at which the relevant volume in the market place is positioned, become difficult areas to cross upwards or downwards. By using this information, traders can identify very s
"Piranha" - an autonomous trading system that determines overbought and oversold levels on the chart. Red and blue zones represent overbought and oversold levels respectively. Entry points are marked with arrows: a downward arrow in the red zone for "sell" and an upward arrow in the blue zone for "buy". The Take profit level is indicated by the green moving average. Key features: Adjusting the Take profit level as the green moving average changes position. Averaging ability when a new market e
Big Player Range
Thalles Nascimento De Carvalho
5 (2)
「BigPlayerRange」インジケーターへようこそ。これは金融機関が市場で示す重要なエリアを特定するために開発されたテクニカル分析ツールです。このインジケーターは、主要な市場参加者が相当な活動と興味を示す価格範囲を正確に分析します。 主な特徴: 1. 金融機関の関心エリアのマッピング:「BigPlayerRange」は金融機関が強い活動を示すチャート上のエリアを正確に強調表示します。これらのポイントは戦略的に重要であり、市場の将来の動きについての洞察を提供します。 2. 出口の基準としてのプロジェクション:関心のあるエリアを特定するだけでなく、このインジケーターはプロジェクションを使用して可能な出口の基準としています。これらのプロジェクションは市場が将来どの方向に動くかに基づいて戦略を計画するのに役立ちます。 3. 識別された範囲に戻るときの引き戻しの確率:「BigPlayerRange」のユニークな機能の1つは、価格が関心のある範囲に戻ったときの引き戻しの確率を計算できることです。これは潜在的なトレンドの反転を評価するのに役立ちます。 「BigPl
バイナリ オプションの可能なコールおよびプット エントリを生成する人工知能に基づくインジケーター。 このインジケーターは 3 つの異なる戦略で機能します。 1) 出来高を読み取ることで、価格が反転する時期にシグナルを送信します。 2) 価格と出来高の乖離を通じて、トレンドが継続するか反転するかを知らせます。 3) 価格と出来高の収束を通じて、トレンドが継続すべき時期にシグナルを送信します。 この指標はすべての時間枠で機能しますが、最良の結果は 3 分または 5 分の期限で得られます (制度的な攻撃は短い時間枠で見られるため)。 最も流動性の高い時間帯、つまりグリニッジ標準時 7 時からグリニッジ標準時 18 時までが最適です。 このインジケーターは正しいシグナルの 70% 以上を生成しますが、価格を操作する機関同士の争いに遭遇したり、相互に拒否したりして、一連の誤ったシグナルが生成される可能性があります。そのため、適切な資金管理を使用することをお勧めします (Masaniello の例) )
The indicator is designed to close positions on the market in time. For example: to take profits ahead of schedule if the price has not reached TakeProfit, and the market is turning around. The indicator analyzes the momentum, not the trend. He does not give any information about the trend. The indicator is well suited for finding divergence. The Ershov 38 Parrots indicator dynamically adjusts to the market and detects price movement impulses of medium and high amplitude. It almost does not rea
Tatino Super Signals is Non Repaint Indicator for Binary Option trading and Forex trading. Recommendations: Timeframe: All timeframes. For best results we recommend using it on M1, M5 and M15 timeframes. Currency pairs: All Pairs Account type: All Type Broker time: Any Brokers : Alls Binary Trading : Expired 1 Candle Buffer Buy=1, Sell=0, Entry Next Candle Recommended Forex trading stop loss : 15 pips Recommended  Forex tradingTake profit levels : 15 pips Specifications: Does not repaint  
How to use Pair Trading Station Pair Trading Station is recommended for H1 time frame and you can use it for any currency pairs. To generate buy and sell signal, follow few steps below to apply Pair Trading Station to your MetaTrader terminal. When you load Pair Trading Station on your chart, Pair Trading station will assess available historical data in your MetaTrader platforms for each currency pair. On your chart, the amount of historical data available will be displayed for each currency pai
Teniendo una entrada de precios suavizados, los cuales son procesador por un ZigZag en tiempo real, dando como resultado un suavizador ajustado a un ZigZag. Con valores de entrada (periodo) mayores se vuelve un poco lenta en M1,, Ideal para H1, H4, D1 Trabaja bien con otros suavizadores, ya que su intersección es ideal Al iniciar empiza con mayor precisión desde el momento de activación, siendo el historial (anterior) de referencia ----------------------------------------------------------------
Super Suavizador
Cesar Juan Flores Navarro
Indicador en MQL5 que obtiene el promedio de 10 EMAS que son alineadas y procesadas según Fibonacci luego el promedio es suavizado"  Se ingresa un número de 2 a N que multiplica los EMA-Fibonacci y por consiguiente aumenta los fibonacci, resultando un promedio.   Se ingresa un número que suaviza los EMA-Fibonacci. Considerando los números 1/1 seria la suavización minima. Considerando los números 3/5 seria la suavización media. Considerando los números 10/30 seria la suavización alta.....etc
Entry Pro
Bartlomiej Tadeusz Tomaja
Entry Pro Indicator is a powerful multi-functional trading tool designed to increase your market entry accuracy. It combines the power of several key market trend indicators, including ATR Trailing Stop and both fast and slow EMA, to provide comprehensive market insight. It offers easy-to-interpret market entry signals represented by colored arrows. Also, it's fully customizable, allowing you to adjust ATR and EMA periods to suit your trading strategy. Trend filters and alerts can be toggled on
Классификатор силы тренда. Показания на истории не меняет. Изменяется классификация только незакрытого бара. По идее подобен полной системе ASCTrend, сигнальный модуль которой, точнее его аппроксимация в несколько "урезанном" виде, есть в свободном доступе, а также в терминале как сигнальный индикатор SilverTrend . Точной копией системы ASCTrend не является. Работает на всех инструментах и всех временных диапазонах. Индикатор использует несколько некоррелируемых между собой алгоритмов для класси
Currency Index Watcher is a simple and user-friendly tool for whoever wish to trade Forex using currencies indexes. Currency Index Watcher is configurable and usable directly from the panel. Indexes of 8 custom currencies EUR, USD, GBP, JPY, CHF, AUD, CAD, NZD (default) Any 3-chars symbol from your market watch could be used (BTC = bitcoin, RUB = ruble, CNH = yuan etc ...) : double click the symbol label  Ability to select which currencies and made-of pairs will be analyzed : check/uncheck want
The SmartTrendMt5 trend indicator generates signals based on the principle of combined analysis of calculated reference points within the Keltner channel. The indicator plots the Keltner channel in a separate window (by default, red lines and a blue line - the middle of the channel), and also draws the histogram of calculated reference points for each candle (by default, the histogram bars are yellow). The should be attached to a chart of any timeframe and any trading symbol in the usual way.
If there is only one MT5 indicator you ever buy for trading forex – this has to be it. Your success as a forex trader depends on being able to identify when a currency or currency pair is oversold or overbought. If it is strong or weak. It is this concept which lies at the heart of forex trading. Without the Quantum Currency Strength indicator, it is almost impossible. There are simply too many currencies and too many pairs to do this quickly and easily yourself. You need help! The Quantum C
Forex Relative Performance indicator This indicator calculates the relative strength of major currencies against the US dollar. The basic idea behind this indicator is "to buy strong currency and to sell weak currency". This indicator allows you to quickly identify the best forex pair to trade according to your trading style (Intraday, Scalping, Swing, or Long Term)
The latest most requested Binary Options arrow indicator in the Garuda Signals product line is now on MT5! Binary options signal based on multiple time frame cross over analysis. Gets confirmation from the most consistent signals known to man; Ichimoku, SMA, Bollinger Bands; and also uses the 1 Hour time frame as trend confirmation , so you don't have to open up multiple chart and waste time. - Can be used for all time frames up to 1 hour, but is most POWERFUL for 1 and 5 min options. - Place yo
Funciona identificando picos de máximos y mínimos, para luego eliminarlos haciendo una linea o curva, pudiendo el usuario ingresar el valor de que tanto puede suavizar. Nos facilita poder ver la tendencia así como ver el cruce que puede hacer con otros indicadores, mostrando a simple vista los inicios y salidas de una tendencia u operación. Así también facilita la visualización de subidas y bajadas.
Indicador en base a la pendiente de la linea de precio, dibuja una línea de color cuando sube a base de los precios que previamente has sido procesados o linealizados, y cuando baja la pendiente la linea linealizada toma otro color. En este caso se a considerado 6 lineas de diferentes procesos desde pendientes largas hacia las cortas, observándose que cuando coincidan las pendientes se produce un máximo o mínimo, lo que a simple vista nos permitirá hacer una COMPRA O VENTA.
Description Very precise patterns to detect: entry signals as well as breakout, support and resistance reversal patterns. It points out zones in which, with a high probability, institutional orders with the potential to change the price’s direction and keep moving towards it, have been placed. Support:   We create great tools for the entire trading community. Most of them are free. If you believe in what we do  Support Us Here.   KEY LINKS:   Indicator Manual  -  All Products  How is this ind
Индикатор Coefficient Of Determination (COD) представляет собой значение коэффициента детерминации или квадрат коэффициента корреляции между зависимой переменной — ценой и объясняющей переменной — тиковым объемом. Что это дает нам на практике? COD отлично распознает кульминацию трендовых движений, что позволяет подбирать оптимальные точки и ловить развороты рынка. Как использовать индикатор: Наиболее популярная торговая стратегия строится совместно с трендовым индикатором Moving Average (MA), пе
Fibonacci Múltiple 12, utiliza la serie fibonacci plasmado en el indicador fibonacci, aumentadolo 12 veces según su secuencia. El indicador fibonacci normalmente muestra una vez, el presente indicador se mostrara 12 veces empezando el numero que le indique siguiendo la secuencia. Se puede utilizar para ver la tendencia en periodos cortos y largos, de minutos a meses, solo aumentado el numero MULTIPLICA.
Recommended TimeFrame >= H1. 100% Non Repainted at any moment.  Use it carefully, only with Trend Direction. Trading Usage: 2 Variants: as Range System or as BreakOut System (Both Only With Trend Direction)::: (Always use StopLoss for minimise Risk); [1] as Range System: (Recommended) in UP TREND:  - BUY in Blue Line , then if price goes down by 50 points (on H1) open Second BUY.   Close in any Profit you wish: TrailingStop(45 points) or Close when Price touches upper Gold Line. in DOWN TR
Super Zone   For several years of observing the principles of the market, Super Zone worked, both then and now, because the indicator  allows you to see the trading range of the  week and even the month that major market participants use. It’s very easy to use, we work on H4 in the weekly range (  in the tester it doesn’t work in the demo mode  ) - we sell from the upper zones, we buy from the lower ones. It marks the zones from the beginning of the week (month) that are  not redrawn  , works on
En base a cálculos matemáticos de determino una linea Horizontal que cruza a todas las señales de trading, mostrando los máximos y mínimos. La linea horizontal parte en dos las subidas y bajadas de las señales de trading, de tan manera que es fácil identificar los máximos y mínimos, y es inteligente por que es sensible a las subidas y bajadas, afín de no quedarse en un solo lado por siempre, trabaja excelentemente con otros indicadores suavizadores ya que les garantiza que en un intervalo de tie
作者のその他のプロダクト
//////////////////////////////////////////////// ////////////////////////////////// An improved version of the standard Bulls Power and Bears Power indicators. Now it's two in one. The setup is simple - you just need to specify the period. It is also very easy to understand the readings of this indicator, a signal above zero is a buy, and below it is a sell. //////////////////////////////////////////////// /////////////////////////////////// I hope this indicator will be very useful t
FREE
An improved version of the standard Standard Deviation indicator. It is now a responsive and smoothed line. The setup is not straightforward - but I hope you can do it. It is very easy to understand the readings of this indicator, the meaning is the same as that of the usual Standard Deviation. //////////////////////////////////////////////// /////////////////////////////////// I hope this indicator will be very useful to you in successful trading. Good luck.
FREE
//////////////////////////////////////////////// ////////////////////////////////// An improved version of the standard Average True Range indicator. It is now a responsive and smoothed line. The setup is not straightforward - but I hope you can do it. It is very easy to understand the readings of this indicator, the meaning is the same as that of the standard Average True Range. //////////////////////////////////////////////// /////////////////////////////////// I hope this indicator
FREE
インジケータに垂直方向のボリュームが含まれる !!!! 指標には予測モジュールが含まれています。 あなたが迷惑なメッセージを止めたいなら このエキスパートを購入したものと一緒に使用する 有料インジケータ「V-Scale Live Trainer」。 手動取引のみ。 簡単な専門家がトレーダーの生活を楽にします。 注:それを使用するには、ワンクリック取引を有効にするだけです。 AUTO_TRADEを無効にすることを忘れないでください。 ターミナルが新たに起動するたびに、直ちに約2回、メタトレーダー4がエキスパートがインストールされている各ウィンドウのすべての時間フレームを切り替えて、正しく初期化されるようにします。 おおよそ次のようになります:M1、M5、M15、M30、H1、H4、D1、W1、MN。 その後、希望の時間枠に切り替えることができます。 ///////////////////////////////////////////////////////// 美しいインターフェイスと機能をお楽しみください。 がんばろう。 /////
FREE
このエキスパートは、同じ指標と組み合わせて機能するように設計されています。 https://www.mql5.com/ru/market/product/34834 専門家は画面には何も表示せず、取引もしません。 それは指標の計算のみを実行します、これはあなたのコンピュータリソースを節約するために行われます。 エキスパートはMarket Watchのシンボルを扱うので、テスターでそれをテストする方法はありません。 使用のための指示: 0)インディケータに表示されるMarket Watchで必要なシンボルを選択してください。 (注:!!!設定で使用する前に、必ず自動チェック機能を無効にしてください!!!) 1)任意の時間枠で任意の商品のチャートを開き、その上にこのエキスパートを置きます。 画面上のコメントがマーケットウォッチからのすべての文字を表示しなくなるまで待ちます。その後、このウィンドウを閉じたり、このエキスパートを削除したりしないでください。 エラーが発生した場合、またはエキスパートが動けなくなった場合は、もう一度起動してください。 2)同じ名前の無料のインディケータをダ
FREE
このエキスパートは、同じ指標と組み合わせて機能するように設計されています。 https://www.mql5.com/ru/market/product/34836 専門家は画面には何も表示せず、取引もしません。 それは指標の計算のみを実行します、これはあなたのコンピュータリソースを節約するために行われます。 エキスパートはMarket Watchのシンボルを扱うので、テスターでそれをテストする方法はありません。 使用のための指示: 0)インディケータに表示されるMarket Watchで必要なシンボルを選択してください。 (注:!!!設定で使用する前に、必ず自動チェック機能を無効にしてください!!!) 1)任意の時間枠で任意の商品のチャートを開き、その上にこのエキスパートを置きます。 画面上のコメントがマーケットウォッチからのすべての文字を表示しなくなるまで待ちます。その後、このウィンドウを閉じたり、このエキスパートを削除したりしないでください。 エラーが発生した場合、またはエキスパートが動けなくなった場合は、もう一度起動してください。 2)同じ名前の無料のインディケータをダ
FREE
An improved version of the standard Standard Deviation indicator. It is now a responsive and smoothed line. The setup is not straightforward - but I hope you can do it. It is very easy to understand the readings of this indicator, the meaning is the same as that of the usual Standard Deviation. //////////////////////////////////////////////// /////////////////////////////////// I hope this indicator will be very useful to you in successful trading. Good luck.
FREE
////////////////////////////////////////////////// ////////////////////////////////////////////////// ///////////////////////////////// Go My Wayは、トレンドの方向性または価格の動きを示す非常に正確な指標です。 この指標は、他の12の指標に基づいて計算され、非常に複雑なメカニズムを備えています。 ////////////////////////////////////////////////// ////////////////////////////////////////////////// ///////////////////////////////// 設定は非常に簡単ですが、変更しないことを強くお勧めします。これはほとんどの場合、すべての時間枠で機能します。 このインジケーターを使用すると、時間通りに高精度で価格変動の方向を常に知ることができます。 このインジケータの読み取り値は、特別な数式によって注意深く
////////////////////////////////////////////////// //////////////////////////////// このインジケーターは、多項式回帰を使用して、それに応じて3つのチャネルと6つの線をプロットします。 最初のチャネルとその境界は大きな周期で、2番目は平均で、3番目は小さな周期です。 セットアップは簡単です。色を指定し、価格ラベルの表示を有効/無効にするだけです。 この指標の読みを理解することも非常に簡単です。 チャネルラインは、ストップロスを設定し、利益レベルを取得するために使用されます。 ストラテジーテスターにインジケーターの読み取り値が表示されない場合は、チャートウィンドウでズームアウトしてみてください。 ////////////////////////////////////////////////// ///////////////////////////////// この指標が取引の成功に非常に役立つことを願っています。 がんばろう。
//////////////////////////////////////////////// とても簡単です。設定はありません。 矢印の色とサイズのみを指定する必要があります。 この指標の読みを理解することも非常に簡単です。 上向き矢印は買いシグナルであり、下向き矢印は売りシグナルです。 ストラテジーテスターでテストしてみてください-あなたはそれを好きになるでしょう!!! ////////////////////////////////////////////////// ///////////////////////////////// この指標が取引の成功に非常に役立つことを願っています。 がんばろう。
これは、2番目の形式の目盛りチャートです。 OpenCLのサポートがあります。 設定は非常に簡単です。インジケーターが計算される曜日を選択できます。 たとえば、週末に相場が更新されないような金融商品の場合、6日目と7日目の曜日を選択する必要がありますが、たとえばビットコインの場合、ブローカーが相場を更新する場合は、次のことができます。 6日目(土曜日)と7日目(日曜日)を指定します。 必要に応じて、色をカスタマイズすることもできます。 これは、適応性のある滑らかなカラーラインです。 このインジケーターはストラテジーテスターでは機能しません。購入する前にビデオをご覧ください。 ////////////////////////////////////////////////// / /////////////////////////////////// この指標が取引の成功に非常に役立つことを願っています。 幸運を。
////////////////////////////////////////////////// //////////////////////////////// 標準の平均トゥルーレンジインジケーターの改良版。 これにより、精度が2倍になり、平均化線が色付けされます。 セットアップは非常に簡単です。メイン期間と平均期間を指定する必要があります。 このインジケーターの読みは非常に簡単に理解できます。意味は標準の平均真の範囲と同じです。 ////////////////////////////////////////////////// ///////////////////////////////// この指標が取引の成功に非常に役立つことを願っています。 がんばろう。
////////////////////////////////////////////////// //////////////////////////////// このインジケーターは、1分間の価格変動の範囲を表示します。 リスク管理に最適です。 これは、ティックチャートの標準の平均トゥルーレンジインジケーターの改良版です。 これにより、精度が2倍になり、平均化線が色付けされます。 設定は非常に簡単です-必要に応じて色を変更する必要があります。 このインジケーターの読みは非常に簡単に理解できます。意味は標準の平均真の範囲と同じです。 ストラテジーテスターにインジケーターの読み取り値が表示されない場合は、早送りしてから、 読み取り値が表示されたら、グラフウィンドウの速度を遅くします。 ストラテジーテスターの特性により、データが常に正しく表示されるとは限りません。 ターミナルでは、実際のデータではすべて正常に機能します。 ////////////////////////////////////////////////// /////////////////////
////////////////////////////////////////////////// / ////////////////////////////////// このインジケーターは、非線形多項式回帰チャネルを表示します。稲妻のように非常に高速に動作します。特にOpenCLアクセラレーションテクノロジーを使用する場合。 このインジケーターの特別バージョンがまもなく利用可能になります。これは、しばらく先の価格も予測します。 これらは適応性のある滑らかな色の線です。 このインジケーターには4つのオプションがあります。 1)1秒の時間枠 2)2秒の時間枠 3)12秒の時間枠 4)チャートの時間枠 すべての設定は非常にシンプルで、その主なものは次のとおりです。 0)時間枠の選択 1)データ正規化のタイプの選択。 2)OpenCLアクセラレーターの選択 3)その他の簡単な設定。 必要に応じて色を変更することもできます。 この指標の読みを理解することは非常に簡単で、青-買い、赤-売りです。 また、チャネルラインを追加で構築することもできます。チャネルラインは、傾斜角度に応じて色が変
4つのアンサンブルに分割された12の人工ニューラルネットワーク 将来の価格変動の方向性を予測しようとしています: 小:1分、 中:5分、 大:30分、 ロイヤル:15分。 アクティブな高頻度取引のこのインジケーターは、すぐに使用できます EAは個別に起動され、インジケーターによって公開されたグローバル変数の形式でインジケーターからシグナルを受信します。 このインジケーターはストラテジーテスターでは機能しないため、ビデオを見るか、 1週間に限定された試用版のデモ版を提供するという要件を記載したリクエストを私のメールに書いてください。 tgwls2@gmail.com このプログラムは64ビットバージョンであり、コンピュータが OpenCLアクセラレータバージョン2.0以降をサポートし、 少なくとも8GBのRAMと最新のプロセッサ。 予測は、メインチャートウィンドウの右側に矢印として表示されます。 小さな期間-小さな矢印、大きなもの-大きなもの。 王室のアンサンブルには独自の矢印があります。 現在のバーに対する矢印の色とオフセットを変更できます メインウィンドウの右側、およびその他の
このインジケーターは、フィルタリングされた価格情報を表示します 3 つの色付きのヒストグラムと 1 つの共通の色付きの線の形式で。 これは非常にカラフルで美しいインジケーターです。 価格変動の強さと方向を判断するのに最適です。 このインジケーターの設定は非常に簡単です。 1) 指標を計算するための 3 つのオプションの選択: - オリジナル、 - デマーカー、 - バランスボリューム。 2) 5 つの異なる期間の選択。 3) 表示色の選択。 4) 精度の選択。 ///////////////////////////////////////////////////////////// この指標が取引の成功に非常に役立つことを願っています。 幸運を。
フィルタ:
レビューなし
レビューに返信
バージョン 1.1 2023.04.12
Update //