CandleFilter
- Indicators
- Igor Gerasimov
- Version: 1.1
- Updated: 12 April 2023
- Activations: 5
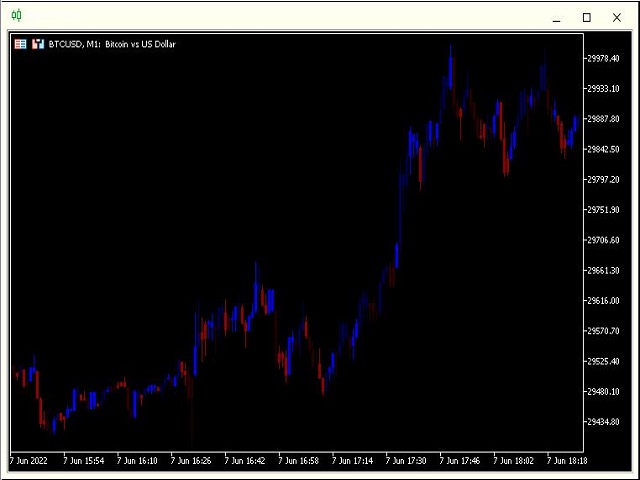
This indicator displays filtered price information
in the form of a candlestick chart using 64 color ranges.
Perfectly useful for determining the strength of the direction of price movement.
This indicator does not have any settings.
All 64 colors are already included in the program,
the brighter the blue color, the stronger the force of the movement to buy,
and the brighter the red color, the stronger the force of the movement to sell.
////////////////////////////////////////////////////////////////////
I hope this indicator will be very useful to you in successful trading.
Good luck.