Netsrac ADR Dashboard Free
- Indicadores
- Carsten Pflug
- Versión: 4.1
- Actualizado: 26 enero 2021
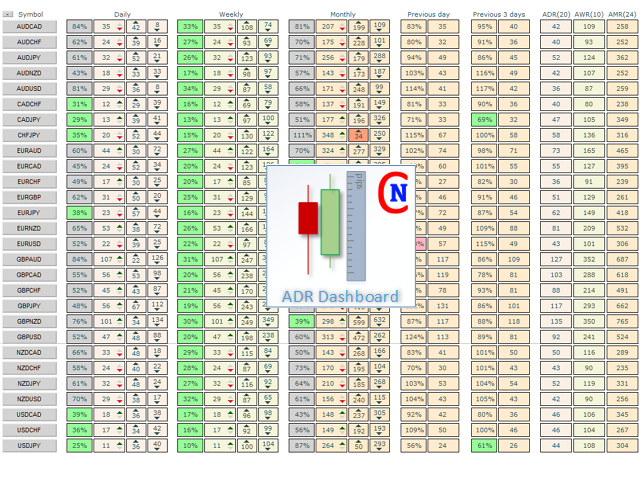
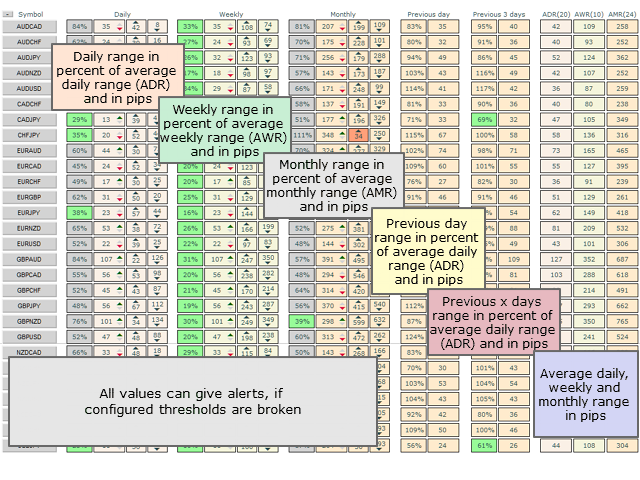
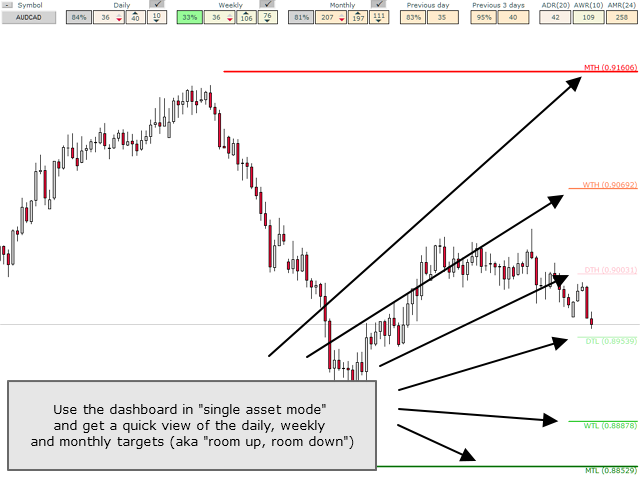
The intention of the dashboard is to provide a quick overview of the daily, weekly and monthly range of configured assets. In "single asset mode" the dashboard shows you possible reversal points directly in the chart, thus making statistics directly tradable. If a configured threshold is exceeded, the dashboard can send a screen alert, a notification (to the mobile MT4) or an email.
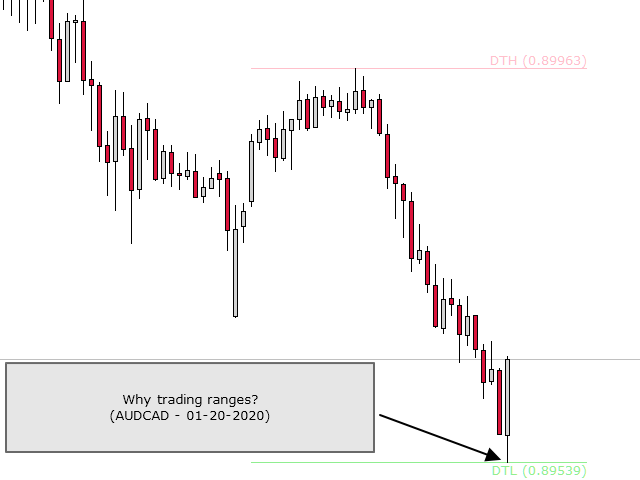
There are various ways of using this information. One approach is that an asset that has completed nearly 100% of its average daily movement shows a tendency to reverse. Another approach is to observe the assets, which has a very low volatility compared to the average. Now the challenge is to trade the breakout from this low volatility.
These are just two possible strategies for which the dashboard can be an important aid. Discover the possibilities!
For full description of the controls, please watch my blog entry (https://www.mql5.com/en/blogs/post/732999).
Please note: This is the free version of Netsrac ADR Dashboard, which can be found at https://www.mql5.com/de/market/product/33805. You can only watch three underlyings with the free version. The "Single Asset Mode" works only with AUDNZD!
This indicator can not be used in the Strategy Tester. So the demo version here from the market does not work. Please use the free version of the indicator for testing.
!Feature Freeze - Version 4.1 is the last free version of this product! - My free products no longer get any updates. Unfortunately, I don't get any recognition for my work and I can't feed my family with it either. Sorry.

cant download free verson