• Información general
  • Comentarios (336)
  • Discusión (1050)
  • Novedades

Advanced Supply Demand

4.93

¡Actualmente con 33% de descuento!

¡La mejor solución para cualquier tráder principiante o experto!

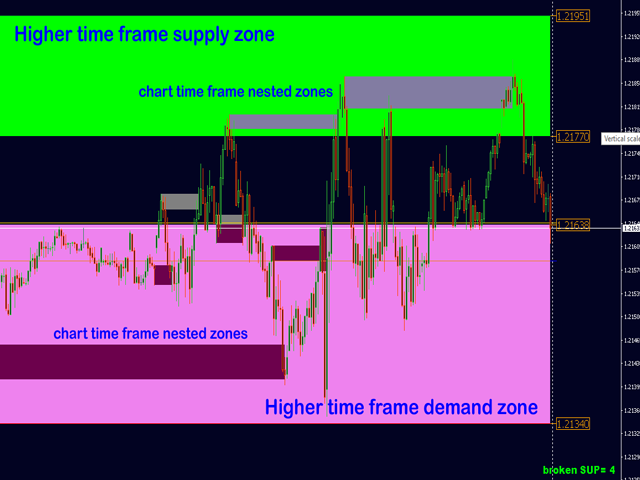
Este indicador es una herramienta comercial única, de alta calidad y asequible, porque incorpora una serie de características patentadas y una nueva fórmula. Con esta actualización, podrá mostrar zonas de doble marco temporal. No solo podrá mostrar un marco temporal más alto, sino también mostrar ambos, el marco temporal del gráfico MÁS el marco temporal más alto: MOSTRANDO ZONAS ANIDADAS. A todos los tráders de oferta-demanda les encantará. :)


Información importante revelada

Maximice el potencial de Advanced Supply Demand, visite https://www.mql5.com/en/blogs/post/720245  

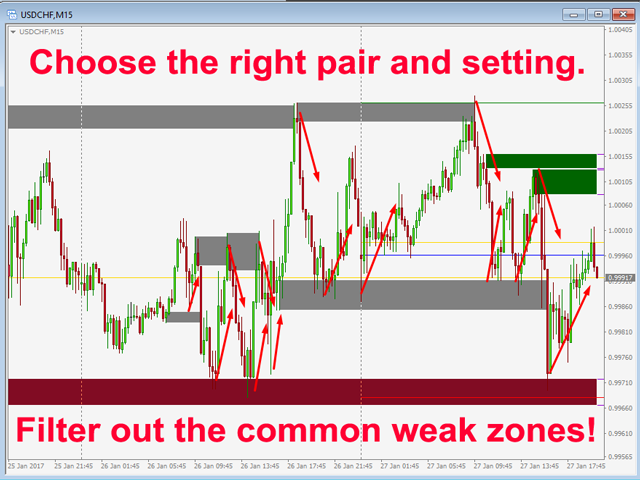
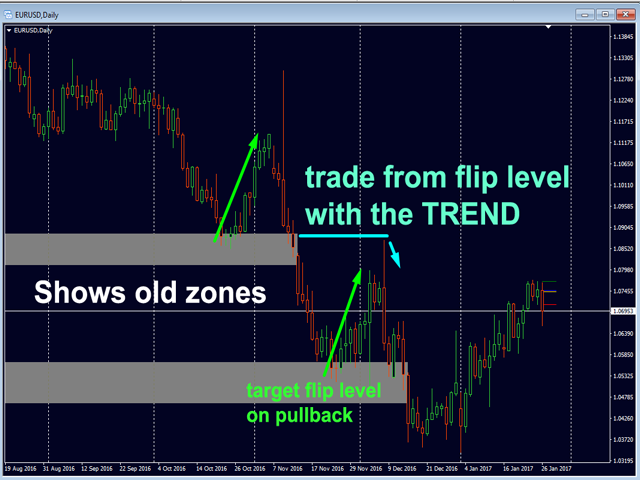
Imagínese cómo mejorará su comercio cuando pueda identificar el punto de activación exacto de la entrada o el objetivo. Construido sobre nuevos algoritmos subyacentes, facilita aún más la identificación de posibles desequilibrios entre compradores y vendedores. Esto se debe a que muestra gráficamente las zonas de oferta y demanda más fuertes y qué rendimiento hubo en el pasado (mostrando las zonas antiguas). Estas funciones se han diseñado para facilitar la búsqueda de las mejores zonas y niveles de entrada.

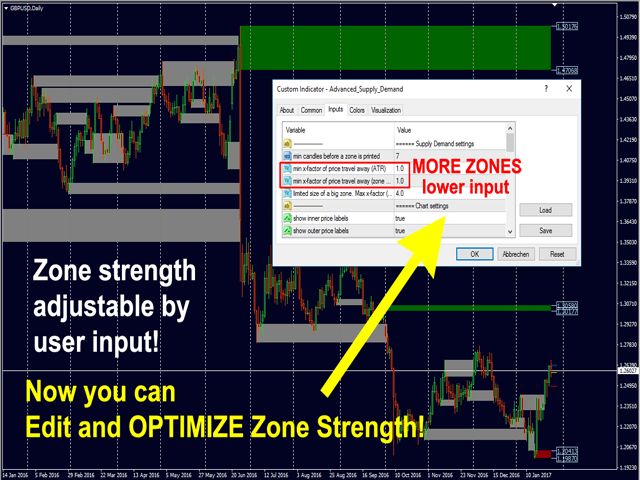
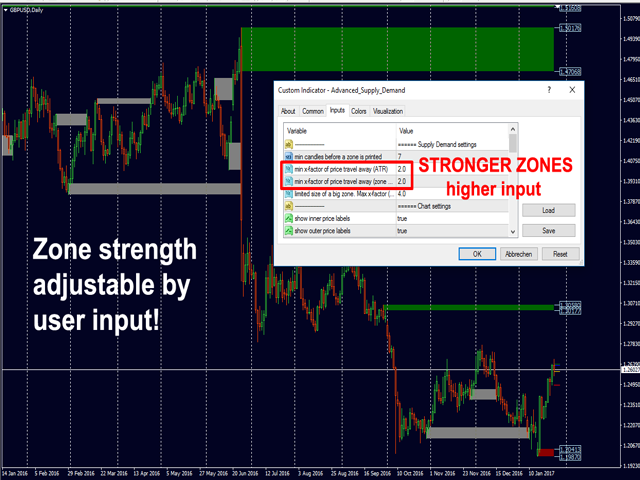
¡Ahora podrá optimizar y editar la intensidad de la zona para su símbolo y marco temporal!

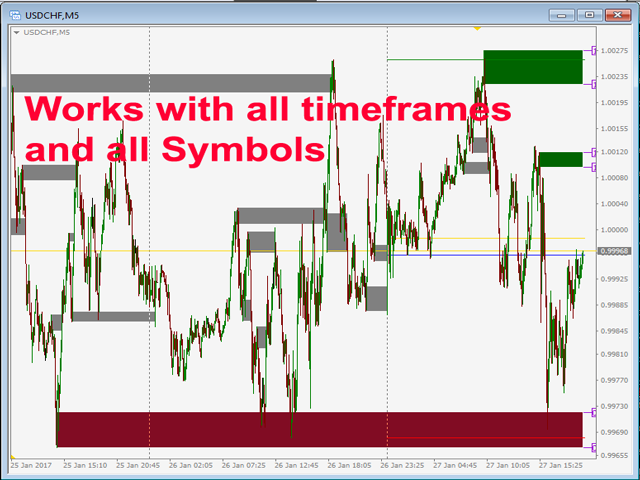
El indicador Advanced Supply Demand funciona con todos los productos y marcos temporales. Se trata de una fórmula nueva, y sus novísimas características son funciones de fuerza con dos zonas ajustables mediante los parámetros de entrada del usuario. Esto supone una gran ventaja en el trading. Cuando aprenda a utilizar las funciones patentadas, como la fuerza de la zona con un factor X mínimo de desplazamiento del precio, podrá saber si la zona es fuerte o no.

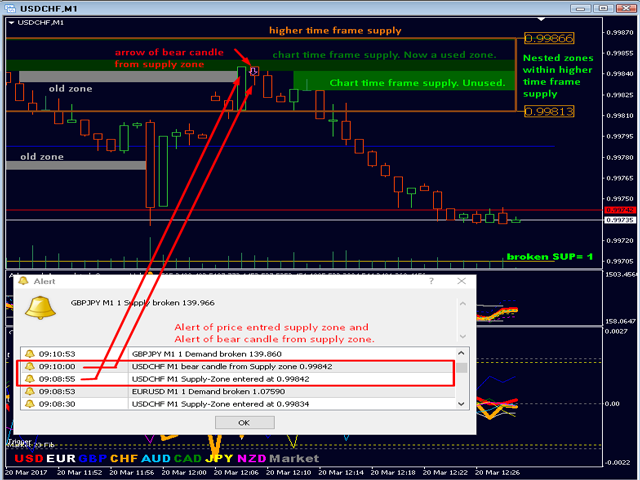
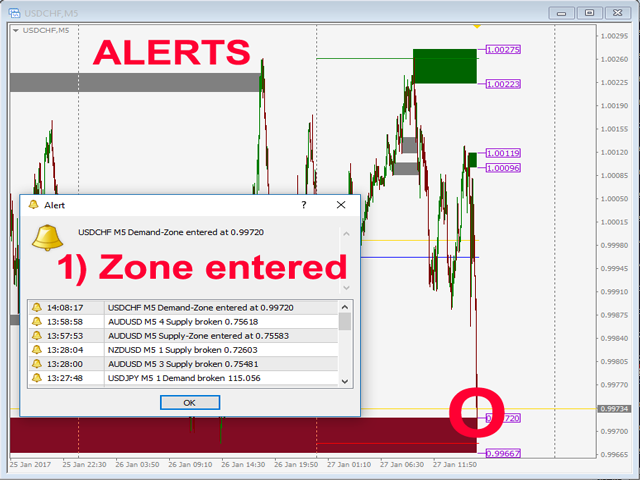
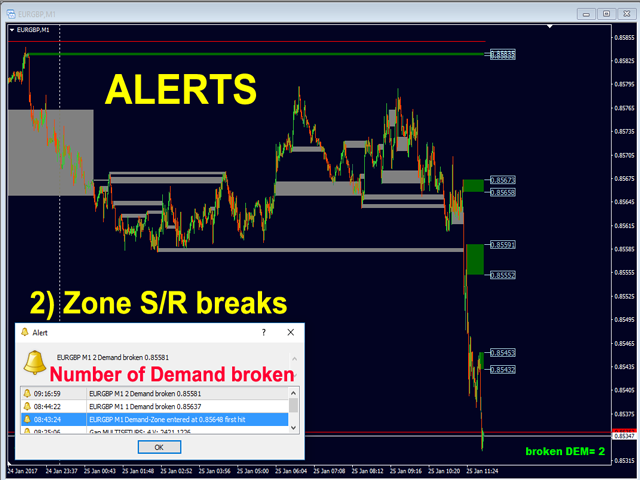
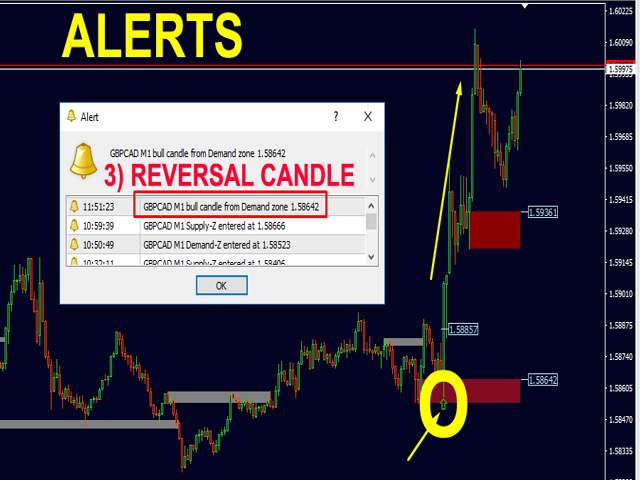
Las zonas de oferta y demanda se utilizan como disparador de alerta. Tiene la opción de 3 alertas. Si el precio 1) entra en la zona y/o 2) rompe la zona y/o 3) se ha formado una vela de inversión a partir de una zona. Podrá usar una alerta acústica emergente en MetaTrader 4 y/o push y/o correo electrónico. Cuando reciba la alerta, como tráder, ya sabrá qué hacer.

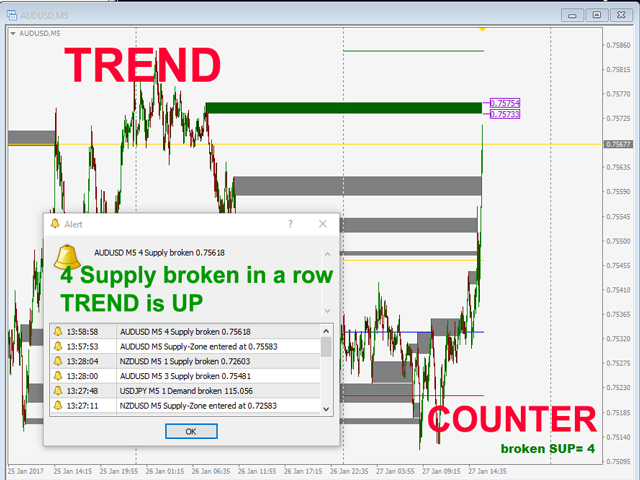
Un mensaje le dirá cuántas zonas de demanda seguidas se han roto, por lo que podrá optar por comerciar con la tendencia y buscar una continuación de la misma.

¡El indicador puede detectar zonas de oferta/demanda anidadas!

¡Una característica muy potente! ¡La alerta le dirá si una zona de oferta/demanda está anidada (dentro) de una zona de oferta/demanda de un marco temporal mayor! Todas las alertas se pueden filtrar por zonas anidadas.


Parámetros

Configuración de Supply Demand:

  • Velas mínimas antes de que se imprima una zona (se usa para el gráfico en vivo).
  • Factor X mínimo del desplazamiento del precio (ATR) (cuanto mayor sea el número, más fuertes serán las zonas). ¡OPTIMICE AQUÍ SU SÍMBOLO Y MARCO TEMPORAL!
  • Factor Y mínimo del desplazamiento del precio (tamaño de la zona) 2ª Entrada: cuanto mayor sea el número, más fuertes serán las zonas. ¡OPTIMICE AQUÍ SU SÍMBOLO Y MARCO TEMPORAL!
  • Tamaño limitado de una gran zona. Factor máximo (ATR) (se reducirán las zonas grandes sobredimensionadas. Cuanto mayor sea el número, mayores serán las zonas permitidas).

Configuración de MTF:

  • Añadir un marco temporal más alto
  • Periodo de marco temporal más alto (si el marco temporal máximo (MTF) es igual o menor que el marco temporal del gráfico, se usará el más alto)
  • min HTF!-velas antes de que se imprima una zona
  • factor X mínimo de desplazamiento del precio (ATR) MTF
  • factor Y mínimo del desplazamiento del precio (tamaño de la zona) MTF
  • Tamaño limitado de una gran zona. Factor máximo (ATR) MTF (se reducirán las zonas grandes sobredimensionadas. Cuanto mayor sea el número, mayores serán las zonas permitidas).
  • Mostrar etiquetas de precio internas de MTF
  • Mostrar etiquetas de precio externas de MTF

Configuración del gráfico:

  • Mostrar etiquetas de precios internas.
  • Muestre etiquetas de precios externas.
  • Mostrar zonas antiguas (necesarias para el contador de Oferta/Demanda, ver más abajo).
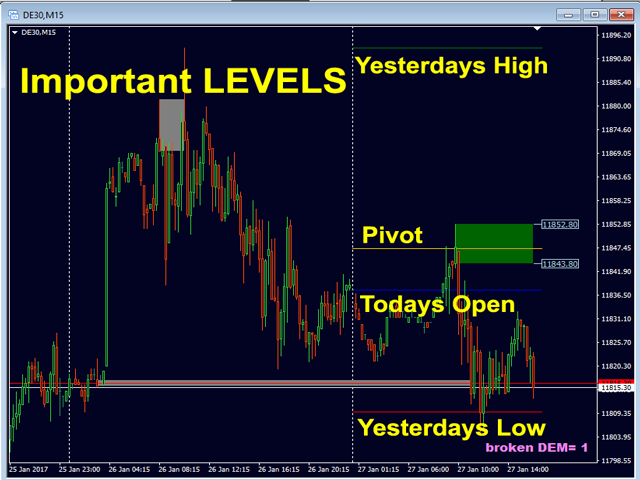
  • Mostrar el high/low de ayer
  • Mostrar el pivote de hoy
  • Mostrar el número de ofertas/demandas rotas seguidas (contador)
  • Mostrar arriba en la esquina
  • dibujar un rectángulo extendido sobre una vela en vivo
Comentarios 20
Matthew Kotecki
227
Matthew Kotecki 2023.09.06 03:03 
 

indicator is very accurate, and saves me time when marking up my charts. has improved my trading immensely

Noboru Sato-
184
Noboru Sato- 2023.08.23 07:09 
 

色々と悩みましたが、こちらのインジケータは抵抗帯、しかも時間足を1つに集約してもらえるので、トレードするのが非常に助かります。スイングが多いので、1時間足に4時間足の抵抗帯が見えまた大抵は消えがちですが、過去に意識された(ブレイクした)抵抗も見えるので、振り返りにも役立ちます。

muzzu-qureshi
31
muzzu-qureshi 2023.07.21 18:52 
 

Best indicator I love it just one thing is missing (buy and sell signals alert) It is a great way to enter, exit and put your stop losses. Once I got this indicator I was so impressed

Productos recomendados
VR Cub
Vladimir Pastushak
VR Cub es un indicador para obtener puntos de entrada de alta calidad. El indicador fue desarrollado para facilitar los cálculos matemáticos y simplificar la búsqueda de puntos de entrada a una posición. La estrategia comercial para la cual se diseñó el indicador ha demostrado su eficacia durante muchos años. La simplicidad de la estrategia comercial es su gran ventaja, que permite que incluso los operadores novatos negocien con éxito con ella. VR Cub calcula los puntos de apertura de posiciones
49 USD
This is the complete REX package. It consists of the lite, pro and ULTRA version.  Perfect for beginners and intermediates. REX complete is 100% non repaint. The strategy is based on a mix of different strategies, statistics, including pivot points, oscillators and patterns.  As the trading idea consists of a variety of some classic indicators like Momentum, Williams Percent Range, CCI, Force Index, WPR, DeMarker, CCI, RSI and Stochastic, it is clear that the fundamental indicators have being
1 800 USD
Supply and Demand Monster MT4
Tsog Erdene Borjigon Enkhkhudulmur
Supply and demand zones are at the heart of   supply and demand trading . These zones are areas that show  liquidity at a specific price.  The supply zone is also called the distribution zone, while the demand zone is called the accumulation zone.   Our indicator automatically draw supply and demand zones in Metatrader 5. It give opportunity to understand trading zone and avoiding risk.
40 USD
Introduction to X3 Chart Pattern Scanner X3 Cherart Pattern Scanner is the non-repainting and non-lagging indicator detecting X3 chart patterns including Harmonic pattern, Elliott Wave pattern, X3 patterns, and Japanese Candlestick patterns. Historical patterns match with signal patterns. Hence, you can readily develop the solid trading strategy in your chart. More importantly, this superb pattern scanner can detect the optimal pattern of its kind. In addition, you can switch on and off individu
250 USD
Infinity Trend Pro
Yaroslav Varankin
1 (1)
This is a trend indicator without redrawing Developed instead of the binary options strategy (by the color of the Martingale candlestick) Also works well in forex trading When to open trades (binary options) A signal will appear in the place with a candle signaling the current candle It is recommended to open a deal for one candle of the current timeframe M1 and M5 When a blue dot appears, open a deal up When a red dot appears, open a trade down. How to open trades on Forex. When a signal is rec
1 000 USD
Auto Levels
Yaroslav Varankin
Auto Level this tool is able to determine the levels of support and resistance. search and display when the price has broken through the level and when it pushed off from it. the indicator can be useful if you use resistance support levels in your trading. or the highs and lows of the price, then it will greatly simplify your work and help you more quickly and more accurately determine the rebound or breakdown of the current trend or tendencies level. blue line bottom uptrend red line on top dow
500 USD
The indicator detects and displays 3 Drives harmonic pattern (see the screenshot). The pattern is plotted by the extreme values of the ZigZag indicator (included in the resources, no need to install). After detecting the pattern, the indicator notifies of that by a pop-up window, a mobile notification and an email. The indicator highlights the process of the pattern formation and not just the complete pattern. In the former case, it is displayed in the contour triangles. After the pattern is com
30 USD
WanaScalper MT4
Isaac Wanasolo
1 (1)
A scalping indicator based on mathematical patterns, which on average gives signals with relatively small SL, and also occasionally helps to catch big moves in the markets (more information in the video) This indicator has three main types of notifications: The first type warns of a possible/upcoming signal on the next bar The second type indicates the presence of a ready signal to enter the market/open a position The third type is for SL and TP levels - you will be notified every time price r
1 350 USD
Trend Ray
Andriy Sydoruk
The indicator shows the potential trend direction by cyclical-wave dependence. Thus, all the rays of the intersection will be optimal rays, in the direction of which the price is expected to move, taking into account the indicator period. Rays can be used as a direction for potential market movement. But we must not forget that the approach must be comprehensive, the indicator signals require additional information to enter the market.
59 USD
Before
Nadiya Mirosh
The Before indicator predicts the most likely short-term price movement based on complex mathematical calculations. Most of the standard indicators commonly used in trading strategies are based on fairly simple calculations. This does not mean that there were no outstanding mathematicians in the world at the time of their creation. It is just that computers did not yet exist in those days, or their power was not enough for the sequential implementation of complex mathematical operations. Nowa
77 USD
Diamond Trend
Segundo Calvo Munoz
Indicador que identifica la tendencia, así como puntos de entrada. Usar para entradas a favor de tendencia. Aunque este indicador es muy preciso identificando entradas, siempre se recomienda usar otro indicador de soporte para confirmar. Recuerda buscar los Activos y Timeframes que mejor se adapten a tu operativa... Válido tanto para Scalping como para entradas de Largo Plazo Por favor, utiliza un Gráfico de Barras para poder visualizar el indicador correctamente Inputs: EMA Value for Long Term
50 USD
BPSPanel
Remi Passanello
BPS Panel Breakout Pro Scalper Solution Panel This indicator is part of the   RPTrade Pro Solutions  systems. BPS Panel   is a daily trend indicator using Price Action, Dynamic Support and Resistances. It's designed to be used by anyone, even the absolute beginner in trading can use it. NEVER repaints . Indications are given   from close to close . Designed to   be used alone , no other indicators are required. Gives you the trend and potential Take Profit at the beginning of the day. How
1 300 USD
FiboRec
Alfred Kamal
This indicator depends on Fibonacci lines but there is a secret lines i used them, by using FiboRec indicator you will be able to know a lot of important information in the market such as: Features You can avoid entry during market turbulence. You can enter orders in general trend only. You will know if the trend is strong or weak. Signal Types and Frame used You can use this indicator just on H1 frame. Enter buy order in case Candle break out the square area and closed over it, at least 20
100 USD
Trendiness Index
Libertas LLC
5 (3)
"The trend is your friend" is one of the best known sayings in investing, because capturing large trendy price movements can be extremely profitable. However, trading with the trend is often easier said than done, because many indicators are based on price reversals not trends. These aren't very effective at identifying trendy periods, or predicting whether trends will continue. We developed the Trendiness Index to help address this problem by indicating the strength and direction of price trend
49 USD
Este indicador detectará patrones armónicos dibujados en el gráfico mediante métodos manuales y automáticos. Agrega tu comentario, por favor. Notas: El indicador tiene un panel de control y guardará cada configuración (gráfico y marco de tiempo). Puedes minimizarlo para tener más espacio en el gráfico y presionar el botón de cierre para ocultar todos los datos del indicador en el gráfico si prefieres trabajar con otras herramientas de análisis. Cuando uses este indicador y cambies las configurac
66 USD
Black series MT4
Dmitriy Kashevich
1 (1)
Black series MT4 - The indicator is designed for trading on binary options with Timeframe M1-M5-M15 Multicurrency (Works on cryptocurrency and currency pairs) The signal appears when the candle opens Up to 90% correct signals There is no signal redrawing at all Can be used with other indicators. Good for scalping! In Settings there is: -Indicator working methods -I Allert Arrow color Red signal down Blue signal up Also watch the video how the indicator works and signals
999 USD
PZ 123 Pattern
PZ TRADING SLU
3.75 (4)
El patrón 123 es uno de los patrones de gráficos más populares, potentes y flexibles. El patrón se compone de tres puntos de precio: un fondo, un pico o valle, y un retroceso de Fibonacci entre 38.2% y 71.8%. Un patrón se considera válido cuando el precio se rompe más allá del último pico o valle, momento en el que el indicador traza una flecha, levanta una alerta y se puede colocar el comercio. [ Guía de instalación | Guía de actualización | Solución de problemas | FAQ | Todos los productos ]
75 USD
El indicador calcula y traza automáticamente los niveles de soporte y resistencia de Fibonacci, una de las herramientas más efectivas para el análisis de mercado. El cálculo utiliza los datos de precios promediados para el período y el marco de tiempo seleccionados. El mínimo y el máximo para este período se toman como inicio y final del movimiento. Los niveles de Fibonacci le permiten ver puntos de referencia potenciales, alrededor de los cuales el movimiento del precio puede ralentizarse o rev
30 USD
Trend Scanner
Vladimir Kalendzhyan
4.43 (7)
By purchasing this indicator, you have the right to receive a free copy of one of   my other indicator's or advisor’s!  (All future updates are included. No limits) . To get it , please contact me by  mql5 message ! The Trend Scanner trend line indicator displays the trend direction and its changes. The indicator works on all currency pairs and  timeframes. The indicator simultaneously displays multiple readings on the price chart: the support and resistance lines of the currency pair, the exist
50 USD
Laser Trend
Nicolas Zouein
The trend is your friend! This is what this indicator is all about. Follow this famous saying and be safe. Characteristics: Buy/Sell signals fixed on the close of a bar. Works on all symbols and all timeframes. Clear visual market trend laser line, Buy/Sell signal arrows, market strength meter, TP1 & TP2 boxes. Visual signals when to enter, when to exit the market. No repainting. Compatible with Flexible EA for trading automation. (Ask for a free set file optimized to perform 2010-2018) Para
50 USD
Mr Beast Cobertura
Luis Mariano Vazquez Marcos
Mr Beast Super Hedge Asesor experto diseñado para trabajar encerrando el precio entre 2 valores hasta que rompa en una dirección tanto de compra como de venta. Este robot de trading de Forex ha sido desarrollado por MRBEAST como una herramienta para facilitar el trading intradía. Tenga en cuenta que el uso de este robot implica ciertos riesgos y no garantiza ganancias consistentes en el mercado de divisas. El robot de trading se basa en algoritmos y estrategias que he diseñado, los cuales se han
50 USD
The indicator detects and displays М. Gartley's Butterfly pattern. The pattern is plotted by the extreme values of the ZigZag indicator (included in the resources, no need to install). After detecting the pattern, the indicator notifies of that by the pop-up window, a mobile notification and an email. The pattern and wave parameters are displayed on the screenshots. The default parameters are used for demonstration purposes only in order to increase the amount of detected patterns. Parameters
30 USD
UniversalIndicator is a universal indicator. A great helper for beginners and professional traders. The indicator algorithm uses probabilistic and statistical methods for analyzing the price of a trading instrument. The indicator is set in the usual way. Advantages of the indicator works on any time period works with any trading tool has a high probability of a positive forecast does not redraw Indicator Parameters LengthForecast = 30 - the number of predicted bars
400 USD
The indicator detects and displays Shark harmonic pattern (see the screenshot). The pattern is plotted by the extreme values of the ZigZag indicator (included in the resources, no need to install). After detecting the pattern, the indicator notifies of that by a pop-up window, a mobile notification and an email. The indicator highlights the process of the pattern formation and not just the complete pattern. In the former case, it is displayed in the contour triangles. After the pattern is comple
30 USD
Shark Surfer is a new generation indicator applying a well-established trend-following trading. The product is good both for scalping, as well as medium- and long-term trading. Shark Surfer analyzes a selected symbol and shows the recommended market entry, take profit and stop loss levels. Shark Surfer trades on all symbols and timeframes. It also features email and push notifications concerning the new trading signals. The indicator searches for suitable market entry points on an already formed
500 USD
Line Magnit
Aleksey Trenin
The LineMagnit Indicator for MT4 is a highly precise tool that builds support and resistance levels which magnetically attract prices. This feature allows traders to easily determine the most probable entry and exit points in the market, as well as identify the market's directional forces, as levels are based on capital inflows into the instrument. Equipped with an intuitively understandable graphical interface, the LineMagnit Indicator enables users to quickly locate and analyze support and res
150 USD
DMAX pro
Danny Teoh Kok Keong
DMAX SIGNAL IS VERY POWERFUL TOOL TO HELP YOU ENTRY,ITS CAN DETECT OVERSOLD AND OVERBOUGHT IN FOREX MARKET. ITS CAN TRADE 24 FOREX PAIR IN MARKET, 80% ACCURATE RESULT. MANY TRADER FAIL BECAUSE OF ENTRY POINT AND EXIT POINT , SIGNAL OF DMAX WILL GIVE VERY GOOD SIGNAL TO LET YOU KNOW WHERE TO ENTRY AND EXIT.  RISK MANAGEMENT IS VERY IMPORTANT IN TRADING FOREX, PLEASE DONT RISK OVER 5% PER TRADE IS FORE MARKET
150 USD
This is a new strategy for SUPPLY DEMAND areas It is based on a calculation using the tick volume to detect the big price action in market for both bear /bull actions this smart volume action candles are used to determine the supply and demand areas prices in between main supply and demand lines indicate sideway market  up arrows will be shown when prices moves above the main supply and the secondary supply lines Down arrows will be shown when prices moves below the main demand and the secondary
30 USD
Wave Reversal Indicator - determines the direction of trend waves and price reversals. The indicator shows wave movements and trend directions. It gives recommendations where to follow the trader, helps to follow the trading strategy. It is an addition to an intraday or medium-term strategy. Almost all parameters are selected for each time frame and are changed automatically, the only parameter for manual adjustment is the wavelength. Works on various trading instruments and timeframes, rec
45 USD
The Wing Patterns indicator scans for many different kinds of Patterns using an XABCD structure. The term Wing Pattern is used to refer to all types of patterns based on a general XABCD structure, which is plotted in an alternate high-low extreme form. In other words, assume that point X is started at a low point on the chart. The point A is plotted at the next highest point within a certain number of bars. This certain number of bars is called the depth level. In this example, point B would be
100 USD
Los compradores de este producto también adquieren
¡Actualmente 20% OFF ! ¡La mejor solución para cualquier novato o trader experto! Este software funciona con 28 pares de divisas. Se basa en 2 de nuestros principales indicadores (Advanced Currency Strength 28 y Advanced Currency Impulse). Proporciona una gran visión general de todo el mercado de divisas. Muestra los valores de Advanced Currency Strength, la velocidad de movimiento de las divisas y las señales para 28 pares de divisas en todos los (9) marcos temporales. Imagine cómo mejorar
199 USD
Price Action Entry Alerts
Stephen Sanjeeve Sahayam
5 (2)
Este indicador analiza cada barra en busca de presión de compra o venta e identifica 4 tipos de patrones de velas con el volumen más alto. Estas velas luego se filtran utilizando varios filtros lineales para mostrar señales de compra o venta. Las señales funcionan mejor, junto con una dirección de marco de tiempo más alta y cuando se negocian durante horas de alto volumen. Todos los filtros son personalizables y funcionan de forma independiente. Puede ver señales de una sola dirección con el cli
225 USD
Ultimate Sniper Dashboard
Hispraise Chinedum Abraham
4.67 (24)
¡Descuento de 299 $! ¡Los precios pueden aumentar en el futuro! ¡Lea la descripción a continuación! Mejor Sistema de Entrada para Ultimate Sniper Dashboard: ULTIMATE DYNAMIC LEVELS. (Por favor, compruebe mis productos) El Ultimate Sniper Dashboard SÓLO funciona en mercados en vivo debido a los límites de prueba multidivisa de MT4. ¡Presentamos el Ultimate Sniper Dashboard! Nuestro mejor que contiene tanto HA-Sniper, MA-Sniper. y muchos modos especiales. ¡El Ultimate Sniper Dashboard es
349 USD
Please send me Direct message on MQL5 CHAT after purchasing the Indicator for Training and Installation Support There are some additional files that is important to use with the Indicator . So be sure to contact me after purchasing the Indicator So that I can add you for training and support . If you find any difficulty with installation then send me Direct message here So that I can connect with you via Anydesk or Teamview for the product installation. " Smart Order Block Indicator " to find
249 USD
GOLD Impulse with Alert
Bernhard Schweigert
4.43 (7)
Este indicador es una super combinación de nuestros 2 productos Advanced Currency IMPULSE with ALERT  +   Currency Strength Exotics . ¡Funciona para todos los marcos de tiempo y muestra gráficamente el impulso de fuerza o debilidad para las 8 divisas principales más un Símbolo! Este Indicador está especializado en mostrar la aceleración de la fuerza de la divisa para cualquier símbolo como Oro, Pares Exóticos, Materias Primas, Índices o Futuros. Es el primero de su clase, cualquier símbol
149 USD
TPA True Price Action indicator reveals the true price action of the market makers through 100% non-repainting signals (except early signals mode) strictly at the close of a candle! TPA shows entries and re-entries, every time the bulls are definitely stronger than the bears and vice versa. Not to confuse with red/green candles. The shift of power gets confirmed at the earliest stage and is ONE exit strategy of several. There are available now two free parts of the TPA User Guide for our custo
168 USD
Shepherd Harmonic Pattern
Abdullah Alrai
4.45 (33)
Este indicador detectará patrones armónicos que se dibujen en el gráfico mediante métodos manuales y automáticos. Puede consultar el manual del usuario en el siguiente enlace: Agregue su opinión y contáctenos para obtenerlo Existe una versión gratuita para probar este producto en mt4. Puede utilizarlo para detectar patrones de Gartley y Nenstar: https://www.mql5.com/en/market/product/30181 Puede comprar la versión completa de MT4 en: https://www.mql5.com/en/market/product/15212 Notas El indicad
1 250 USD
Cycle Sniper
Elmira Memish
4.5 (32)
NEW YEAR SALE PRICE FOR LIMITED TIME!!! Please contact us after your purchase and we will send you the complimentary indicators to complete the system. Cycle Sniper is not a holy grail but when you use it in a system which is explained in the videos, you will feel the difference. If you are not willing to focus on the charts designed with Cycle Sniper and other free tools we provide, we recommend not buying this indicator. We recommend watching the videos about the indiactor and system before
200 USD
Allows multiple indicators to be combined into a single indicator, both visually and in terms of an alert. Indicators can include standard indicators, e.g. RSI, CCI, etc., and also Custom Indicators, even those purchased through Market, or where just have the ex4 file. An early alert is provided, say when 4 out 5 indicators have lined up, and a confirmed alert when all are in agreement. A‌lso features a statistics panel reporting the success of the combined indicator by examining the current cha
149 USD
PTS - Buscador de Compras por Divergencia de Precision Trading Systems El Buscador de Divergencias de Precisión fue diseñado para encontrar los mínimos del mercado con una precisión milimétrica y lo hace con frecuencia. En el análisis técnico, la habilidad de identificar mínimos generalmente es mucho más fácil que identificar máximos, y este elemento está diseñado precisamente para esa tarea. Después de identificar una divergencia alcista, es prudente esperar a que la tendencia se vuelva al
397 USD
Best Currency Strength Indicator
Tumelo Patrick Rakotsoane
4.54 (46)
Advanced Currency Strength Indicator The Advanced Divergence Currency Strength Indicator. Not only it breaks down all 28 forex currency pairs and calculates the strength of individual currencies across all timeframes , but, You'll be analyzing the WHOLE forex market in 1 window (In just 1 minute) . This indicator is very powerful because it reveals the true movements of the market.  It is highly recommended to  analyze charts knowing the performance of individual currencies or the countries ec
149 USD
Descubre un enfoque revolucionario para el trading con el Indicador Shepherd Numerology Levels. Esta innovadora herramienta combina la antigua sabiduría de la numerología con técnicas de trading de vanguardia para ayudarte a identificar niveles clave de soporte y resistencia en tus gráficos. Al utilizar el poder del método Cuadrado de Nueve, este indicador ofrece una perspectiva única sobre la dinámica del mercado, permitiéndote tomar decisiones de trading más informadas. Características Clave y
250 USD
Blahtech Supply Demand
Blahtech Limited
4.61 (33)
Was: $299    Now: $149   Supply Demand uses previous price action to identify potential imbalances between buyers and sellers. The key is to identify the better odds zones, not just the untouched ones. Blahtech Supply Demand indicator delivers functionality previously unavailable on any trading platform. This 4-in-1 indicator not only highlights the higher probability zones using a multi-criteria strength engine, but also combines it with multi-timeframe trend analysis, previously confirmed swin
149 USD
Introduction Excessive Momentum Indicator is the momentum indicator to measure the excessive momentum directly from raw price series. Hence, this is an extended price action and pattern trading. Excessive Momentum Indicator was originally developed by Young Ho Seo. This indicator demonstrates the concept of Equilibrium Fractal Wave and Practical Application at the same time. Excessive Momentum detects the market anomaly. Excessive momentum will give us a lot of clue about potential reversal and
200 USD
Introduction to Fractal Pattern Scanner Fractal Indicator refers to the technical indicator that makes use of the fractal geometry found in the financial market. Fractal Pattern Scanner is the advanced Fractal Indicator that brings the latest trading technology after the extensive research and development work in the fractal geometry in the financial market. The most important feature in Fractal Pattern Scanner is the ability to measure the turning point probability as well as the trend probabi
185 USD
El Indicador de Venta PTS Divergence Finder de Roger Medcalf - Precision Trading Systems. Este indicador solo proporciona indicaciones bajistas - de venta. En primer lugar, muchas veces me han preguntado por qué no proporcioné un indicador de divergencia de venta mientras proporcionaba felizmente un buscador de divergencias de señal de compra durante muchos años. Di la respuesta de que las divergencias de venta son menos confiables que las divergencias de compra, lo cual sigue siendo cierto. Se
397 USD
MR Volume POC Levels 4
Sergey Khramchenkov
5 (3)
The most crucial price level in any "Volume Profile" is the "Point of Control" . Is the price level with the highest traded volume. And mainly, is the level where the big guys start there their positions, so it's an accumulation/distribution level for smart money. The idea of the indicator arose after the "MR Volume Profile Rectangles" indicator was made. When creating the "MR Volume Profile Rectangles" indicator, we spent a lot of time comparing the volumes with those from the volume profil
150 USD
Elliott Wave Trend was designed for the scientific wave counting. This tool focuses to get rid of the vagueness of the classic Elliott Wave Counting using the guideline from the template and pattern approach. In doing so, firstly Elliott Wave Trend offers the template for your wave counting. Secondly, it offers Wave Structural Score to assist to identify accurate wave formation. It offers both impulse wave Structural Score and corrective wave Structure Score. Structural Score is the rating to sh
200 USD
Candle Power Pro
Thushara Dissanayake
4.33 (6)
Libere el poder de la información de volumen real con el indicador   Candle Power Pro   . Esta herramienta dinámica captura los datos del volumen real de cada vela y los presenta como un porcentaje del volumen total. Al hacerlo, le permite discernir la lucha en curso entre compradores y vendedores en el mercado. Candle Power Pro muestra la batalla entre compradores y vendedores como un porcentaje del volumen total, brindándole información valiosa sobre la dinámica del mercado. Puede confirmar fá
450 USD
Introduction to Chart Pattern MT Chart Pattern MT is a chart pattern scanner to detect the triangle pattern, falling wedge pattern, rising wedge pattern, channel pattern and so on. Chart Pattern MT uses highly sophisticated chart pattern detection algorithm. However, we have designed it in the easy to use with intuitive user interface. Chart Pattern MT will show all the patterns in your chart in the most efficient format for your trading. You do not have to do tedious manual pattern detection an
180 USD
Scientific trade
Aleksey Ivanov
5 (1)
An extremely convenient indicator that truly makes the process of making money on the exchange easy. It is based on the scientifically rigorous theory of the market developed by the author, the beginning of which is presented here .                The full algorithm of this indicator operation is presented in the article .               The indicator calculates the most probable price movement trajectory and displays it on the chart. Based on the predicted price movement trajectory
179 USD
I have been trading for some time now and always find it a difficulty remembering the timing of the various market opening hours at the other part of the world (especially, when it comes to daylight saving), but could not find any decent indicator online that could help. And it is for this reason that gives birth to this indicator, which I have spent much time, effort and thinking. As many already know that opening of a certain marketplace, depending on which currency pair, has an impact on the
200 USD
Algo Trading Indicaor  With this indicator , you’ll have zones and trends that hight probability the price will reverse from it. so will gives you all the help that you need  Why should you join us !?  1-This indicator is logical since it’s working in previous days movement , to predict the future movements. 2-Algo trading indicator will help you to draw trends which is special and are too strong than the basics trend , trends will change with the frame time that you work on . 3-We can
249 USD
Presentamos ON Trade Waves Patterns Harmonic Elliot Wolfe, un indicador avanzado diseñado para detectar diversas formas de patrones en el mercado mediante métodos tanto manuales como automáticos. A continuación, te explicamos cómo funciona: Patrones Armónicos: Este indicador puede identificar patrones armónicos que aparecen en tu gráfico. Estos patrones son esenciales para los traders que practican la teoría del trading armónico, tal como se popularizó en el libro de Scott Carney "Harmonic Tradi
800 USD
Por supuesto, aquí tienes la traducción al español: Presentamos el Indicador de Astronomía para MT4: Tu Compañero Celestial Definitivo en el Trading ¿Estás listo para elevar tu experiencia de trading a alturas celestiales? No busques más allá de nuestro revolucionario Indicador de Astronomía para MT4. Esta innovadora herramienta trasciende los indicadores de trading tradicionales, aprovechando el poder de algoritmos complejos para proporcionarte una visión astronómica sin igual y cálculos de pre
1 250 USD
Ultimate Dynamic Levels
Hispraise Chinedum Abraham
4.88 (8)
¡Actualmente en descuento por vacaciones a 399 dólares! Los precios pueden aumentar en el futuro. ¡Lea la descripción a continuación!   ¡Presentamos Ultimate Dynamic Levels - el MEJOR indicador de entrada para el tablero de Ultimate Sniper! ¡¡¡Entradas oportunas de muy bajo riesgo y altas RR!!! Encuentre el Tablero de Francotirador Definitivo AQUÍ. La habilidad más importante para los operadores principiantes y profesionales es saber exactamente dónde y cuándo es más probable que un mercado
199 USD
TheStrat Monitor
Robert Gerald Wood
5 (1)
If you've not already learnt about The Strat trading strategy , go google it now. I promise it won't be a waste of your time, and you will likely learn some new tricks whether you use it or not. OK, so now you know what TheStrat is, you will be able to understand what this indicator can do for you. Key Features In short, the Indicator will: Show Timeframe Continuity for all supported timeframes Supports two timeset views, Day trader and Swing trader Show when Full Timeframe Continuity is in pl
150 USD
Supply and Demand Dashboard PRO
Bernhard Schweigert
4.81 (21)
¡Actualmente 20% OFF ! Este tablero de instrumentos es una pieza muy poderosa de software de trabajo en múltiples símbolos y hasta 9 marcos de tiempo. Se basa en nuestro indicador principal (Mejores críticas: Advanced Supply Demand ).  El tablero de instrumentos da una gran visión general. Se muestra:  Valores filtrados de Oferta y Demanda, incluyendo la calificación de fuerza de la zona, Pips distancias a / y dentro de las zonas, Destaca las zonas anidadas, Da 4 tipos de alertas para los s
199 USD
Blahtech Market Profile
Blahtech Limited
4.59 (17)
Was: $249    Now: $149   Market Profile defines a number of day types that can help the trader to determine market behaviour. A key feature is the Value Area, representing the range of price action where 70% of trading took place. Understanding the Value Area can give traders valuable insight into market direction and establish the higher odds trade. It is an excellent addition to any system you may be using. Blahtech Limited presents their Market Profile indicator for the MetaTrader community.
149 USD
BBMA V2 Higher TF Zone Toggle Show Hide MT4
Khairul Ammar Izzuddin Bin Mohd Khairul Nizam
Intro A customizable toggle indicator based on BBMA (Bollinger Bands & Moving Averages) trading system which allows traders to switch between BBMA & Naked Chart in one click, without having the need to change the chart template. Added ability to view higher time frame zones on a lower time frame chart, in one click, to assist traders on multi-time frame analysis. Main Features One Click Toggle Show/Hide : Switch to naked chart in just one click! Combine it with other trading strategy as you pr
150 USD
Otros productos de este autor
ACTUALMENTE 26% DE DESCUENTO ¡La mejor solución para cualquier operador novato o experto! Este indicador es una herramienta única, de alta calidad y asequible porque hemos incorporado una serie de características propias y una nueva fórmula. ¡Con sólo UN gráfico puede leer la Fuerza de la Divisa para 28 pares de Divisas! Imagínese cómo mejorará su operativa porque podrá señalar el punto exacto de activación de una nueva tendencia o de una oportunidad de scalping. Manual del usuario: haga
148 USD
ACTUALMENTE 31% DE DESCUENTO Este indicador es una herramienta de transacción única, de alta calidad y asequible porque hemos incorporado una serie de características propias y una fórmula secreta. Con solo un gráfico, da Alertas para los 28 pares de divisas. ¡Imagina cómo mejorarás porque puedes identificar el punto de activación exacto de una nueva tendencia u oportunidad de crecimiento! Basado en nuevos algoritmos subyacentes , hace que sea aún más fácil identificar y confirmar operaciones po
88 USD
¡Actualmente 20% OFF ! ¡La mejor solución para cualquier novato o trader experto! Este software funciona con 28 pares de divisas. Se basa en 2 de nuestros principales indicadores (Advanced Currency Strength 28 y Advanced Currency Impulse). Proporciona una gran visión general de todo el mercado de divisas. Muestra los valores de Advanced Currency Strength, la velocidad de movimiento de las divisas y las señales para 28 pares de divisas en todos los (9) marcos temporales. Imagine cómo mejorar
199 USD
Currency Strength Exotics
Bernhard Schweigert
4.86 (29)
¡ACTUALMENTE 20% DE DESCUENTO ! ¡La mejor solución para cualquier operador novato o experto! Este indicador está especializado en mostrar la fuerza de la divisa para cualquier símbolo como Pares Exóticos, Materias Primas, Índices o Futuros. Es el primero de su clase, cualquier símbolo se puede añadir a la 9 ª línea para mostrar la verdadera fuerza de la moneda de Oro, Plata, Petróleo, DAX, US30, MXN, TRY, CNH etc. Se trata de una herramienta de trading única, de alta calidad y asequible por
128 USD
¡¡ACTUALMENTE 26% DE DESCUENTO !! Este indicador es una super combinación de nuestros dos indicadores principales ( Advanced Currency Strength 28   &  Advanced Currency IMPULSE with ALERT ). Muestra los valores de la Fuerza de la Divisa para TICK-UNIDADES y señales de alerta para 28 pares de divisas. Se pueden utilizar 11 Tick-Units diferentes. Son 1, 2, 3, 4, 5, 6, 10, 12, 15, 20 y 30 segundos. La barra de Tick-Unit en la sub-ventana se mostrará y se desplazará hacia la izquierda cuando haya
148 USD
GOLD Impulse with Alert
Bernhard Schweigert
4.43 (7)
Este indicador es una super combinación de nuestros 2 productos Advanced Currency IMPULSE with ALERT  +   Currency Strength Exotics . ¡Funciona para todos los marcos de tiempo y muestra gráficamente el impulso de fuerza o debilidad para las 8 divisas principales más un Símbolo! Este Indicador está especializado en mostrar la aceleración de la fuerza de la divisa para cualquier símbolo como Oro, Pares Exóticos, Materias Primas, Índices o Futuros. Es el primero de su clase, cualquier símbol
149 USD
Advanced Supply Demand MT5
Bernhard Schweigert
4.36 (11)
¡Actualmente con 33% de descuento! ¡La mejor solución para cualquier tráder principiante o experto! Este indicador es una herramienta comercial única, de alta calidad y asequible, porque incorpora una serie de características patentadas y una nueva fórmula. Con esta actualización, podrá mostrar zonas de doble marco temporal. No solo podrá mostrar un marco temporal más alto, sino también mostrar ambos, el marco temporal del gráfico MÁS el marco temporal más alto: MOSTRANDO ZONAS ANIDADAS. A todos
199 USD
My Trade History PRO
Bernhard Schweigert
5 (3)
¡¡ACTUALMENTE 20% DE DESCUENTO !! ¡La mejor solución para cualquier trader novato o experto! Revisar sus operaciones es el primer paso para ser un trader de éxito. Los traders de éxito tienen el hábito de revisar regularmente sus operaciones. Esta herramienta le ayudará a hacer precisamente eso. El proceso de revisión será más eficaz con esta herramienta para realizar un seguimiento de sus operaciones. Analice sus operaciones manuales o las operaciones de su EA. Utilice las 3 vistas g
65 USD
Supply and Demand Dashboard PRO
Bernhard Schweigert
4.81 (21)
¡Actualmente 20% OFF ! Este tablero de instrumentos es una pieza muy poderosa de software de trabajo en múltiples símbolos y hasta 9 marcos de tiempo. Se basa en nuestro indicador principal (Mejores críticas: Advanced Supply Demand ).  El tablero de instrumentos da una gran visión general. Se muestra:  Valores filtrados de Oferta y Demanda, incluyendo la calificación de fuerza de la zona, Pips distancias a / y dentro de las zonas, Destaca las zonas anidadas, Da 4 tipos de alertas para los s
199 USD
¡ACTUALMENTE 20% DE DESCUENTO ! ¡La mejor solución para cualquier operador novato o experto! Este Indicador es una herramienta de trading asequible porque hemos incorporado una serie de características propias junto con una nueva fórmula. El Indicador Avanzado de Volumen Acumulado de Divisas está especializado para los principales 28 pares de divisas y funciona en todos los marcos temporales. Se trata de una nueva fórmula que en un solo gráfico extrae todo el volumen de divisas (C-Volume)
58 USD
My Trades in Pips
Bernhard Schweigert
4.68 (22)
Una herramienta de negociación que no querrá perderse. El indicador muestra todas las operaciones en el gráfico con el símbolo al que está vinculado. Imprime el número de pips en ganancias o pérdidas. A elección imprime una línea vertical a través de sub-ventanas para un mejor análisis. Vea también la versión PRO aquí: Mi Historia de Operaciones PRO https://www.mql5.com/en/market/product/50206 También añade la información sobre el resultado total de las operaciones en la moneda del depósito
FREE
Este indicador es una herramienta de transacción única, de alta calidad y asequible porque hemos incorporado una serie de características propias y una fórmula secreta.   Con solo un gráfico, da Alertas para los 28 pares de divisas.   ¡Imagina cómo mejorarás porque puedes identificar el punto de activación exacto de una nueva tendencia u oportunidad de crecimiento! Basado en   nuevos algoritmos subyacentes , hace que sea aún más fácil identificar y confirmar   operaciones potenciales . Esto se d
128 USD
¡La mejor solución para cualquier operador novato o experto! Este indicador es una herramienta única, de alta calidad y asequible porque hemos incorporado una serie de características propias y una nueva fórmula. ¡Con sólo UN gráfico puede leer la Fuerza de la Divisa para 28 pares de Divisas! Imagínese cómo mejorará su operativa porque podrá señalar el punto exacto de activación de una nueva tendencia o de una oportunidad de scalping. Manual del usuario: haga   clic aquí Ese es el primero
128 USD
Filtro:
Matthew Kotecki
227
Matthew Kotecki 2023.09.06 03:03 
 

indicator is very accurate, and saves me time when marking up my charts. has improved my trading immensely

Bernhard Schweigert
81195
Respuesta del desarrollador Bernhard Schweigert 2023.09.06 20:00
We appreciate your feedback. It's great to hear that our indicator's accuracy and time-saving features have had a positive impact on your trading. 💖
Noboru Sato-
184
Noboru Sato- 2023.08.23 07:09 
 

色々と悩みましたが、こちらのインジケータは抵抗帯、しかも時間足を1つに集約してもらえるので、トレードするのが非常に助かります。スイングが多いので、1時間足に4時間足の抵抗帯が見えまた大抵は消えがちですが、過去に意識された(ブレイクした)抵抗も見えるので、振り返りにも役立ちます。

Bernhard Schweigert
81195
Respuesta del desarrollador Bernhard Schweigert 2023.08.27 12:24
あなたのレビューと共有された洞察に感謝しています。需給ゾーンとタイムフレームを統合できる機能が、あなたの取引スタイルにとって画期的なものであることは明らかです。過去のブレイクアウトを識別し、十分な情報に基づいた意思決定ができることは、トレードを成功させるために不可欠です。 💖
We're grateful for your review and the insights you've shared. It's clear that the feature allowing you to bring together Supply and Demand zones and timeframes has been a game-changer for your trading style. Being able to identify past breakouts and make well-informed decisions is essential for successful trading.
Henry Manuel Chavez Hidalgo
59
Henry Manuel Chavez Hidalgo 2023.08.10 12:42 
 

Great indicator....I am learning how to adapt it to my trading plan.

muzzu-qureshi
31
muzzu-qureshi 2023.07.21 18:52 
 

Best indicator I love it just one thing is missing (buy and sell signals alert) It is a great way to enter, exit and put your stop losses. Once I got this indicator I was so impressed

Bernhard Schweigert
81195
Respuesta del desarrollador Bernhard Schweigert 2023.07.23 11:07
Thank you for the great review! We're glad to hear that you love our indicator and find it helpful in your trading journey. It currently provides alerts for reverse candles and zone breaks, which can be used for entry buy and sell signals. Always check the signals on your chart for final trade execution. We appreciate your feedback, and we're continuously improving our indicator to meet your needs. Happy trading! 💖
Probability_Trader
71
Probability_Trader 2023.07.20 23:32 
 

Amazing indicator that is very helpful in finding imbalances in the market in order to trade in line with big banks.

Maksim Dyrin
430
Maksim Dyrin 2023.07.20 23:12 
 

How to get a bonus?

Bernhard Schweigert
81195
Respuesta del desarrollador Bernhard Schweigert 2023.07.20 23:37
You're welcome, friend.
I have sent you a personal message to your MQL5 inbox. Please take a moment to check it.
MarcoEA
118
MarcoEA 2023.06.09 23:11 
 

hello, I bought two of your indicators. Sup and Dem and Dashboard of Sup and Demand. What are the bonuses?

Bernhard Schweigert
81195
Respuesta del desarrollador Bernhard Schweigert 2023.06.25 11:59
Thank you for purchasing our indictor. As a bonus, we invite you to join our exclusive community of traders by registering at www.CurrencyStrength28.com/forum In our forum, you'll have access to valuable resources and discussions on successful trading strategies. The best part? It's completely free for our clients. Don't miss out on this opportunity to enhance your trading skills and connect with like-minded traders. If you have any further questions or need assistance, feel free to reach out. Happy trading!
michelcrews
192
michelcrews 2023.06.02 00:52 
 

Very good trading system especially when used with Bernhard's other indicators.

Bernhard Schweigert
81195
Respuesta del desarrollador Bernhard Schweigert 2023.06.08 10:55
Your feedback is much appreciated. I'm glad to hear that it has been a good trading system, especially when combined with my other indicators. 👍
FB
50
FB 2023.06.01 20:18 
 

Thank you for a properly researched and developed buying and selling zones indicator. After going through various other tools and soon after discarding them, I was very happy to see the potential of your supply and demand indicator, for my bottom line. Thanks Bernhard

Bernhard Schweigert
81195
Respuesta del desarrollador Bernhard Schweigert 2023.07.13 10:33
Thank you for your positive review of our indicator. We're grateful for your recognition of the potential our supply and demand indicator holds for improving your trading outcomes. Your feedback reaffirms our dedication to creating well-researched and developed tools that benefit our clients. We appreciate your trust in our product. 💖
Zhifeng Lin
383
Zhifeng Lin 2023.05.30 03:31 
 

broken dem/sup=3,what mean?

How should it be used?

Bernhard Schweigert
81195
Respuesta del desarrollador Bernhard Schweigert 2023.05.30 09:20
Thank you for reaching out and asking. When the indicator refers to "broken supply or demand = 3," it means that there have been three consecutive breaks of supply or demand zones. This information is used to identify and determine the prevailing trend direction. To use this feature effectively, it is important to understand that when multiple supply or demand zones are broken in succession, it indicates a strong trend in the direction of the breaks. This can provide valuable insight into the overall market sentiment and help you align your trading decisions accordingly. By recognizing and considering the trend direction indicated by the "broken supply and demand" feature, you can potentially enhance your trading strategies and make more informed decisions. If you have any further questions or need additional guidance, please feel free to ask in the comment section or send a PM. I'm here to assist you. We have sent you a starter email 2 weeks ago.
Aktals
111
Aktals 2023.05.25 20:39 
 

As the name it is really an advanced supply and demand, you miss nothing with this indicator

Bernhard Schweigert
81195
Respuesta del desarrollador Bernhard Schweigert 2023.05.29 10:22
We greatly appreciate your review of our Advanced Supply Demand indicator. It's encouraging to know that the indicator fully lives up to its name and meets your expectations. Your feedback reassures us that we're providing a tool that covers all aspects of supply and demand analysis, ensuring you don't miss out on any crucial insights. 👍
Dmitrii Castravet
454
Dmitrii Castravet 2023.05.18 20:47 
 

Not good at all. This market doesn't follow price action. all indicators are guess luck

Bernhard Schweigert
81195
Respuesta del desarrollador Bernhard Schweigert 2023.05.22 13:34
I understand your frustration, but it's important to approach trading with a more open mindset. While indicators can provide valuable insights, it's essential to learn how to interpret them correctly and use them in conjunction with other analysis techniques. The indicator we provide focuses on identifying supply and demand zones, which can be powerful areas of price movement. It is designed to assist traders in understanding market dynamics and making informed trading decisions. It's not just about luck or guesswork. I encourage you to take the time to go through the comprehensive guide we have sent you. It provides detailed instructions on how to effectively utilize the indicator and gain a deeper understanding of our trading strategy. If you have any specific questions or need further clarification, please don't hesitate to ask. We are here to help you succeed in your trading journey. Remember, trading requires continuous learning and practice. With the right knowledge and skills, you can improve your trading performance and make more informed decisions.
devine tshabalala
143
devine tshabalala 2023.05.08 12:46 
 

Good system for TP, SL and entry points. I like

Bernhard Schweigert
81195
Respuesta del desarrollador Bernhard Schweigert 2023.05.17 11:49
Thank you for sharing your feedback! We're glad to hear that you find our system helpful for determining TP, SL, and entry points. The Advanced Supply Demand indicator is specifically designed to identify key levels of supply and demand in the market. By pinpointing these significant price areas, it enables you to make more informed decisions when setting your stop loss and target levels. 👍
LeeMyra2
34
LeeMyra2 2023.05.05 15:38 
 

Best indicator

Borja Dominguez
237
Borja Dominguez 2023.05.04 09:18 
 

Well if before I said that the advance currency impulse with alerts is the perfect combination with the advance currency strength28 indicator, I have to add that the advance supply and demand indicator is the third necessary leg to understand where the price is and the possible route it has at the time of making the trade, whether we are looking for a bounce in a zoan of interest or a continuation! 3 in one! perfect match!

Bernhard Schweigert
81195
Respuesta del desarrollador Bernhard Schweigert 2023.05.06 09:55
Thank you for your review and for emphasizing the significance of studying the Advanced Currency Strenght Strategy. Your recognition of the critical role that the Advanced Supply Demand indicator plays in this strategy is much appreciated. It's always great to hear from satisfied customers like you. 👍
Sudheer Kumar Ramagiri
135
Sudheer Kumar Ramagiri 2023.05.03 08:07 
 

Good one. No need to go for any other product

mf36_fbs
19
mf36_fbs 2023.04.02 17:54 
 

i am new in trading... from using Indicator Demand and Supply create by developer, make it me easy to analyse chart, save a lot of my time to find a key level of area of Demand and Supply at any time frame becoz system already marking that particular area. Thank you so much developer. Great job...

Bernhard Schweigert
81195
Respuesta del desarrollador Bernhard Schweigert 2023.04.08 10:36
It's great to hear that our Advanced Supply Demand indicator has made your analysis easier and saved you time. Thank you for the positive feedback! 💖
BMG29
232
BMG29 2023.03.30 14:21 
 

très utile !!!

Solomon Ola
202
Solomon Ola 2023.03.26 11:29 
 

I recommend this supply and demand to everyone trading is the best of the best I have been making money 💰 the moment I bought hit

Bernhard Schweigert
81195
Respuesta del desarrollador Bernhard Schweigert 2023.03.28 13:10
We're so happy to hear that Advanced Supply Demand has been the best of the best for you! Thank you for your support and review. 💖
Reinaldo Ivan Santiago Perez
265
Reinaldo Ivan Santiago Perez 2023.03.06 05:20 
 

best indis i have try so far so much money lost but finnaly have what i need thanks

Bernhard Schweigert
81195
Respuesta del desarrollador Bernhard Schweigert 2023.03.17 11:33
Thank you for taking the time to share your positive experience with our indicators. We are so glad to hear that they have been helpful for you. 👍
Respuesta al comentario
Versión 6.5 2023.09.23
Please update to Version 6.4

Best rated Supply and Demand Zone Indicator in the Market.

Various improvements for new Metatrader version.

Please keep your indicators up to date. It's free.
Versión 6.4 2023.08.21
Upgrade to Version 6.4 for Enhanced Trading Insights

+ We're thrilled to introduce Version 6.4, featuring the industry's highest-rated Supply and Demand Zone Indicator. Elevate your trading strategy with this powerful tool, designed to help you identify critical price reversal areas.

+ In response to valuable feedback from traders like you, we've added a new feature – the "Price Label." Now, when you explore higher timeframe zones, this label serves as a helpful reminder, providing context for the purpose of each empty rectangle zone.

New input:
+ display MTF names left (default = true)

+ Don't miss out on these exciting updates. Keep your indicators up to date effortlessly and at no cost. By staying current with our latest version, you're ensuring that your trading arsenal remains at the cutting edge of the market.

+ Upgrade to Version 6.4 now and access the best-rated Supply and Demand Zone Indicator available. With the new Price Label feature, trading on higher timeframes becomes even more insightful. Join the community of savvy traders who are enhancing their strategies with our free, top-notch tools.
Versión 6.3 2023.07.21
Please update to Version 6.3

Best rated Supply and Demand Zone Indicator in the Market.

Various improvements for new Metatrader version.

Please keep your indicators up to date. It's free.
Versión 6.2 2023.06.21
We are thrilled to announce the highly anticipated release of Version 6.2 of our Advanced Supply Demand Indicator – the top-rated tool for traders like you. With its advanced capabilities, this powerful indicator will revolutionize your trading strategy by identifying critical price reversal areas, giving you a significant edge in the market.

Discover the latest enhancements we have made to ensure seamless compatibility with the newest Metatrader version. By upgrading to Version 6.2, not only do you gain access to cutting-edge features, but you also stay ahead of the competition. And the best part? These updates are completely free, so you can maximize your trading potential without any additional cost.

Upgrade now to Version 6.2 and experience firsthand the unparalleled benefits of our top-rated Supply and Demand Zone Indicator. Take control of your trading journey, make informed decisions, and elevate your profitability. Don't miss out on this opportunity to improve your trading strategy – all for free.
Versión 6.1 2023.05.25
Various improvements.
Please update.
Versión 6.0 2023.04.20
We're excited to announce the release of Version 6.0, featuring the best-rated Supply and Demand Zone Indicator on the market. This powerful tool helps you spot key areas of price reversal, giving you an edge in your trading strategy.

Our team has made various improvements to ensure compatibility with the latest Metatrader version, so you can take advantage of new features and stay ahead of the competition. Plus, keeping your indicators up to date is completely free and ensures that you're always using the most advanced tools available.

Upgrade now to Version 6.0 and experience the benefits of our best-rated Supply and Demand Zone Indicator. Stay ahead of the competition and improve your trading strategy with the latest updates, all for free.
Versión 5.9 2023.03.22
Our indicator has been updated with more improvements. We made overall enhancements to its functionality.

We highly recommend that you update your indicator to take advantage of these improvements. This will ensure that you are using the latest version of our software and that you can benefit from the latest enhancements and features.

If you need assistance with the update process or have any questions, please do not hesitate to contact us. We are always here to help.
Versión 5.8 2023.02.24
We are proud to announce that our Supply and Demand Zone Indicator continues to be the highest rated tool of its kind in the market. Our team has worked hard to develop and refine this powerful tool, and we believe it will help you identify profitable trading opportunities with greater accuracy.
With the recent release of the new Metatrader version, we have made various improvements to ensure that our software continues to integrate seamlessly with this popular trading platform. These changes include performance enhancements, so you can expect even smoother and more reliable performance from our indicators.
Versión 5.7 2023.01.24
Please update to Version 5.7

Best rated Supply and Demand Zone Indicator in the Market.

Various improvements for new Metatrader version.

Please keep your indicators up to date. It's free.
Versión 5.6 2022.12.22
Various improvements for new Metatrader version.
Please update.
Versión 5.5 2022.11.21
Best rated Supply and Demand Zone Indicator in the Market.
Various improvements.
Please update.
Versión 5.4 2022.10.21
Added more improvements.
Updating is recommended.
Versión 5.3 2022.09.22
Added more improvements,
Updating is recommended.

Versión 5.2 2022.08.20
More improvements.
Please update.
Versión 5.1 2022.07.21
Best rated Supply and Demand Zone Indicator in the Market.
Various improvements.
Please update.
Versión 5.0 2022.06.22
Various improvements for new Metatrader version.
Versión 4.9 2022.05.18
A useful feature has been added at the request of a trader.
A trader can have only buy or sell preferences for an instrument. This selects the alarms that are chosen. The graph and alert when entering a zone are unaffected.

==== General Alert Settings ====
New input:
+ Traders preference alerts buy-sell-both

Please update.
Versión 4.8 2022.04.20
Various improvements.
Please update.
Versión 4.7 2022.03.20
Various improvements.
Please update.
Versión 4.6 2022.02.18
Various improvements.
Please update.
Versión 4.5 2022.01.17
Various improvements for new Metatrader version.
Please update.
Versión 4.4 2021.12.17
Various improvements.
Please update.
Versión 4.3 2021.11.18
More improvements.
A "Must" update.
Another bridge for EA import has been added.
Versión 4.2 2021.10.11
Best rated Supply and Demand Zone Indicator in the Market.
Various improvements.
Please update.
Versión 4.1 2021.08.23
Various improvements.
Versión 4.0 2021.06.13
IMPORTANT UPDATE!
VERSION 4 !!!
Versión 3.7 2021.05.09
Various improvements.
Versión 3.6 2021.03.14
Best rated Supply and Demand Zone Indicator in the Market.
Various improvements for new Metatrader version.
Versión 3.5 2020.10.20
MAJOR UPDATE 2020 SERIES 03
==================

The new update brings:
MODIFICATION FOR ZONE SIZE (optional)

Some traders of supply and demand zones asked for a new function. It was added optionally: Including a wick for the width of the supply and demand zones.

New input:
+ Include wick 1 for the zone size
By default, the function is not used. To use the function, you must set the new input = true (the selection is also copied to the higher time frame).
Since the zones will be wider, some zones could be filtered. You may want to use lower XY factors.

This is possibly the last update from a 2020 series.
From now on I will add the new features to "Supply and Demand Dashboard PRO".
Versión 3.4 2020.10.10
The new update brings:
1) Graphical improvements and
2) Some traders of supply and demand zones requested a new function. It was added optionally: Draw supply and demand zones only at major highs and lows.
New input:
+ use only major highs and lows
By default, the function is not used. To use the function, you must set the new input = true. (The choice will be copied to the higher timeframe as well.
To show all zones at highs and lows you might want to set all XY-factors = 1.0, but it can be combined.)
Versión 3.3 2020.10.04
MAJOR UPDATE 2020
==================

Added optional: Supply and Demand zones with ENGULFING BARS pattern at the beginning of the zone.
Use reversal candle color for bar 1 or bar 2 (the one before). Use either ones or both.
Use true engulfing pattern for above mentioned bars. (Must choose above.)

By default the use is false. To use the function you must set the new inputs = true.

New inputs:
==== Candle pattern
+ use reversal candle color bar 1
+ use reversal candle color bar 2 (both or either)
+ use true engulfing pattern (choose above)
Versión 3.2 2020.09.17
Various improvements and graphic options for counter of broken zones.
Versión 3.1 2020.07.23
Thanks to client report, fixed an issue with show old zones and number of broken Sup/Dem in a row.
Versión 3.0 2020.02.10
Added zone size info in point. As requested by trader.
It will show in the right corner of the rectangles. The size of the higher timeframe is shifted a few bars to the left.
new inputs:
=== Chart settings
+ show zone size (point)
+ show zone size MTF (point)

associated inputs:
+ color price labels
=== other settings
+ font size zone
+ Label font 1
Versión 2.90 2020.01.14
Various improvements.
Versión 2.80 2019.10.18
At the request of a trader:
Added room in points for HIT-alert. Now the trader can receive an earlier alert when price is NEAR a zone. Then he can take action or watch. This input should be applied according to the symbol and timeframe. The trader can make it bigger to suit his needs. The default value is 5 points. (10 point = 1 pip.)
new input:
+ room in points for HIT-alert
Versión 2.70 2019.09.21
1) A new alert for a fake (or false) breakout has been added with several variables:
new inputs:
==== FBO Alert settings
+ Alert Fake Breakout (FBO)
+ FBO min bar Size Point
+ FBO bar closes back % (20-90)
+ FBO pattern bar count (1-3)

2) For old zones a new candle limit was added. If there is a strong trend, zones with only 2000 bars lookback may not be within range. Therefore, this limit has been increased to 5000. But so far we don't have to draw old zones. Therefore, a new limit has been added for old zones with 1000 bars.
new input:
+ Show Bars back for old zones

3) Now you can edit the size for arrow as requested by trader.
new input:
+ reverse candle arrow size (1 to 5)
Versión 2.60 2019.05.29
1) Optimized some issue with old zones and counter.

2) As requested by a trader the reversal arrow will now only draw on nested zones if the filter "alert only nested" is true.

3) A new filter for alerts has been added to alert only if the zone is new or untouched. (Excluding break alert.)
New input:
+ reverse candle: use only new zones (default = false)
To activate the filter set above input to true;

4) A new candle limit has been added for old zones. If there is a strong trend the zones might not be in range with only 2000 bars look back. So this limit was set higher to 5000 bars. But we do not need to draw old zones so far. That's why a new limit for old zones has been added. (Default = 1000 bars.)
New input:
+ show Bars back for old zones
Versión 2.50 2019.04.25
Optimized diverse functions and graphics.
Versión 2.40 2018.12.06
Optimized XY-filter for higher timeframe MTF.
To make sure the higher timeframe filters out weak S/D zones the same way as the lower timeframe (chart) does.
Also you can setup different values for each timeframe.
Default values are now set to:
+ min X-factor of price travel away (ATR) = 1.4
+ min Y-factor of price travel away (zone size) = 2
Versión 2.30 2018.11.04
New features added!

Added an optional filter to alert only nested zones. (The lower timeframe zone must be within a higher timeframe zone.)
It applies to all 3 actual alerts (hit - reverse - break).
If turned off the alerts will still tell if the alerted zone was nested or not.
New input:
+ alert only NESTED zones! (within MTF)

Added an optional pause in seconds for less CPU use. (Set to 0 to turn it off) At least on each new candle new zones will be checked.
New input:
+ pause runs in seconds to next update (for less CPU use) (0=not)
Versión 2.20 2018.10.25
Added a new visual option for higher timeframe zones rectangles.
If the square is not filled and the width is 1 it can be used as dashed/dotted etc...

New input below other settings:
+ rectangle line style MTF (width must be 1)
Versión 2.10 2018.10.01
Added XY-filter for higher timeframe.
If you want the higher timeframe to show like before set XY-filter MTF = 1.0

New input parameters:
==== MTF settings
+ min HTF!-candles before a zone is printed
+ min X-factor of price travel away (ATR) MTF
+ min Y-factor of price travel away (zone size) MTF

Added pre-name for objects. In case you want to use the indicator twice on a chart, enter here a letter for the 2nd.

New input parameters:
==== other settings
+ prename for additional objects
Versión 2.0 2018.09.25
Version 2.0 - 2018.09.24
Final upgrade with faster calculations.
It just got hypersonic speed to draw all levels and zones !!!

+ added "usePIN" for developments (Global variables)
Gives access to the first 5 supply and demand zones (outer price, inner price, if it is used or not, the timeframe, and the symbol).

Versión 1.22 2017.07.17
Added an input to draw the higher timeframe squares extended to the right to not cover the live candle.
Optimized alerts.
Minimized CPU usage with a timer.
Reorganized inputs.

New input parameters:
+ draw rectangle extended over live candle (1 to 5 bars)
+ zone print delay seconds for redraw (5 to 60 sec)
Versión 1.14 2017.04.24
On customers request, I added different colors for broken (old) zones.
+ color supply old
+ color demand old
Repeating alerts on M1 are been fixed.
Versión 1.13 2017.03.30
With this update, we have a small add for better graphic.
Now you can choose empty squares for the higher timeframe (MTF) and edit the line width. This makes it graphically easier to differentiate between chart timeframe zones and higher timeframe zones.
+ rectangle style full MTF (default=false)
+ rectangle width (1-5) MTF (default=3)
The colors have been modified for the higher TF to be more beautiful.
Versión 1.12 2017.03.16
With this update, you will be able to show double time frame zones. You will not only be able to show a higher TF but to show both, the chart TF, PLUS the higher TF: SHOWING NESTED ZONES.

Indicator parameters added:
==== MTF settings
+ ADD higher TF
+ higher TF period (or one more if chart TF)
+ show inner price labels MTF
+ show outer price labels MTF
+ limited size of a big zone. Max factor (ATR) MTF
+ color supply MTF
+ color supply used MTF
+ color demand MTF
+ color demand used MTF
+ color price labels MTF
+ size price labels MTF
Versión 1.11 2017.02.06
Corrected count of broken supply/demand zones and start of daily lines.