• Información general
  • Comentarios (4)
  • Discusión (116)
  • Novedades

PZ Trend Trading

4.75

Trend Trading es un indicador diseñado para sacar el máximo provecho posible de las tendencias que tienen lugar en el mercado, mediante el cronometraje de retrocesos y rupturas. Encuentra oportunidades comerciales al analizar qué está haciendo el precio durante las tendencias establecidas.

[ Guía de instalación | Guía de actualización | Solución de problemas | FAQ | Todos los productos ]

  • Opere en los mercados financieros con confianza y eficiencia
  • Aproveche las tendencias establecidas sin ser aturdido
  • Reconocer retrocesos rentables, rupturas y reversiones tempranas
  • El indicador analiza su propia calidad y rendimiento.
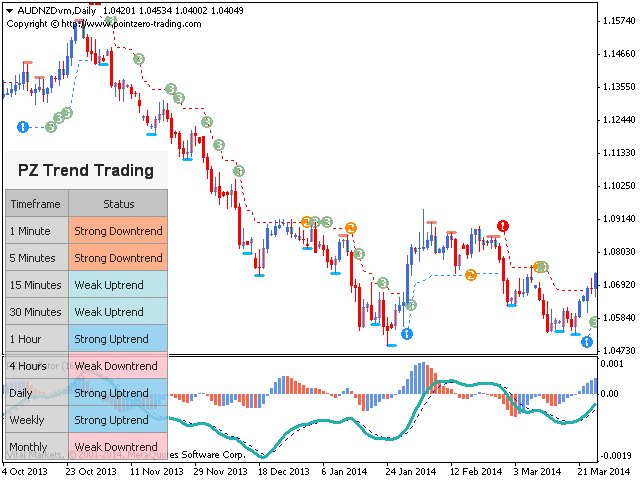
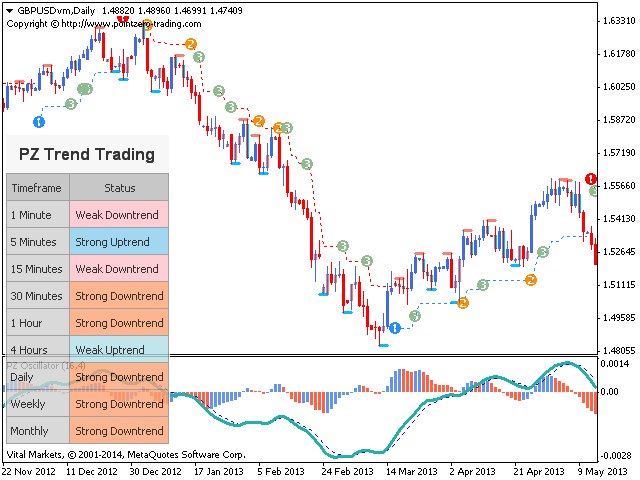
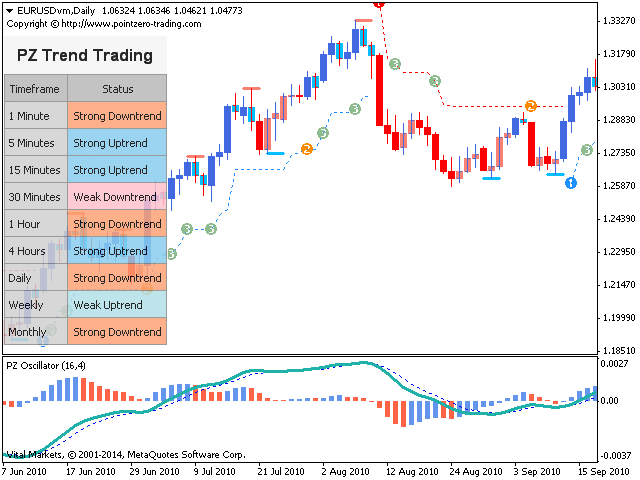
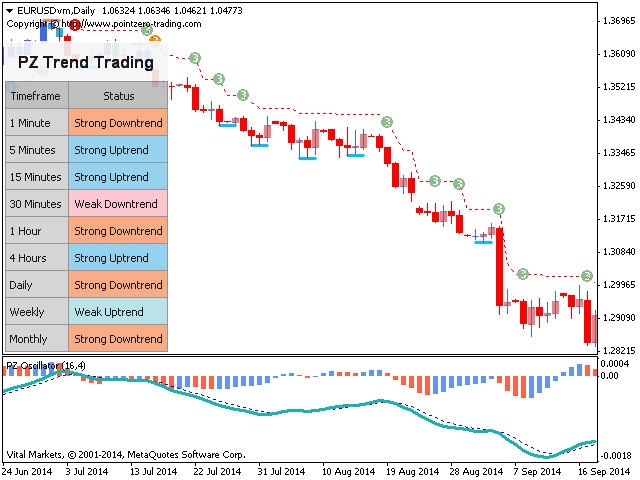
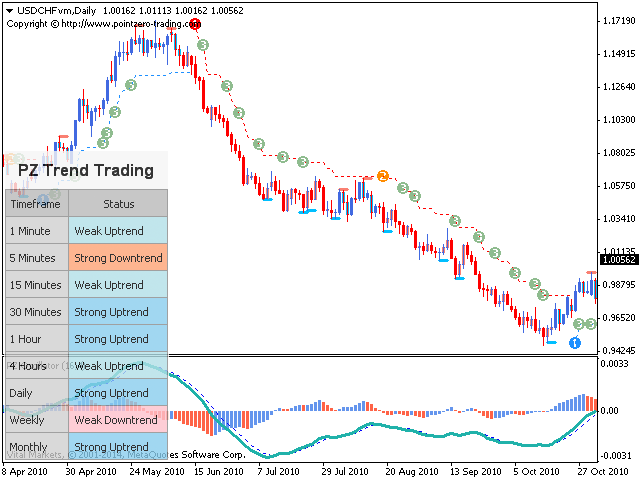
  • Implementa un tablero de múltiples marcos de tiempo
  • El indicador no se repinta
  • Implementa alertas por correo electrónico / sonido / visuales

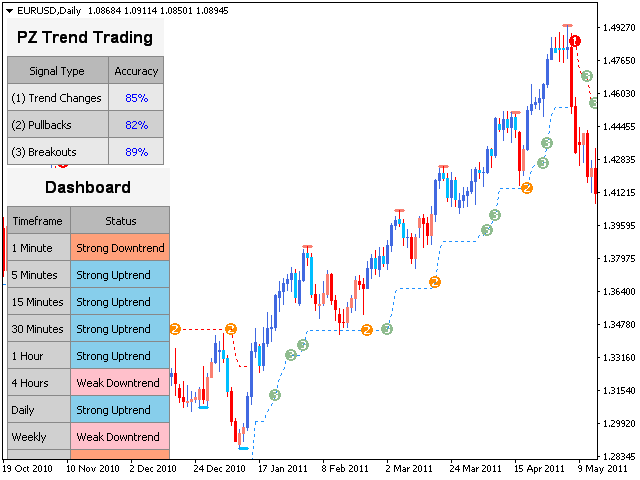
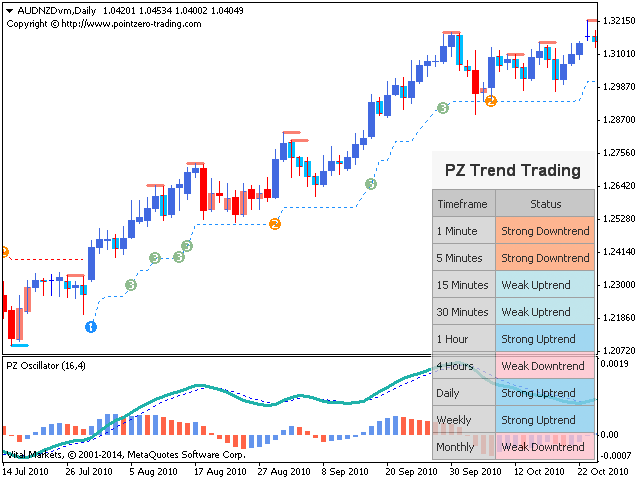
Las tendencias establecidas ofrecen docenas de oportunidades comerciales, pero la mayoría de los indicadores de tendencias las 
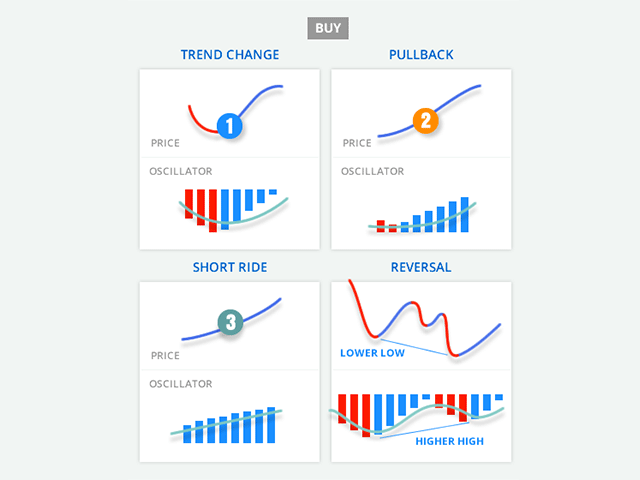
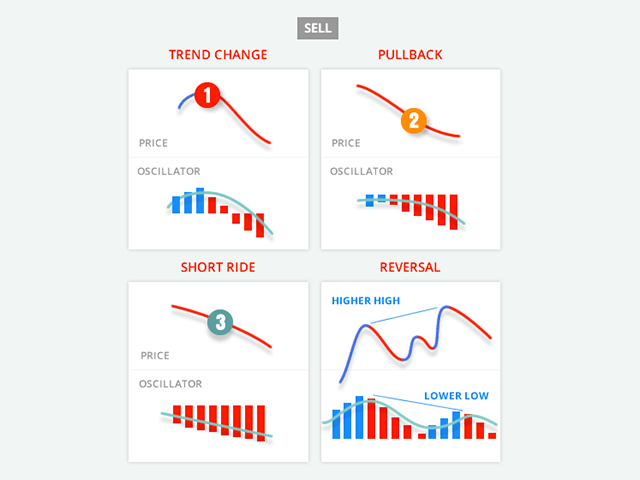
descuidan por completo. Interpretar el indicador es bastante fácil:

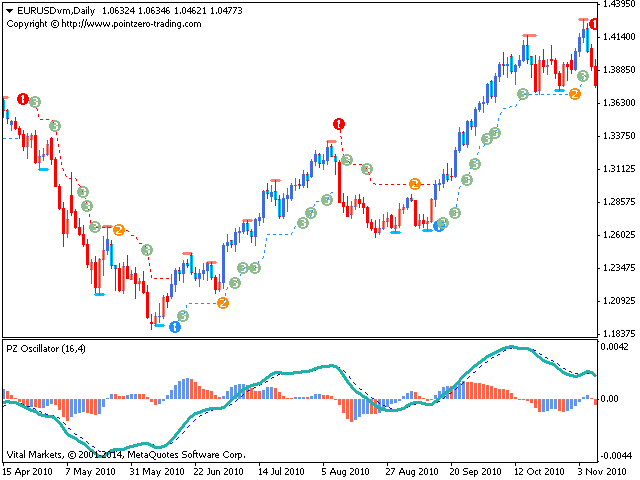
  • (1) es un cambio de tendencia
  • (2) es un retroceso en la dirección de la tendencia
  • (3) es una ruptura en la dirección de la tendencia
  • Un guión rojo es una corrección durante una tendencia bajista.
  • Un guión azul es una corrección durante una tendencia alcista
  • Las barras azules son una sub-tendencia alcista
  • Las barras rojas son una subtendencia bajista


Parámetros de entrada

    • Período indicador: este parámetro controla la sensibilidad a los cambios de tendencia. Un gran período conducirá a la captura de tendencias más largas. Un período pequeño conducirá a la captura de tendencias más cortas, pero a un reconocimiento más rápido de los cambios de tendencia.
    • Mostrar subtendencia: habilite este parámetro para ver la subtendencia reflejada en el color de las barras de precios.
    • Mostrar retrocesos: active este parámetro para ver retrocesos, que se muestran como (2) objetos en el gráfico.
    • Desglose de pantalla: habilite este parámetro para ver los desgloses en la dirección de la tendencia, que se muestran como (3) objetos.
    • Mostrar correcciones: habilite este parámetro para ver las correcciones de tendencia, que se muestran como guiones de colores.
    • Max. Barras de historial: este parámetro controla cuántas barras pasadas se examinan al cargar el indicador.
    • Mostrar el panel de control: habilite este parámetro para ver el panel de marco de tiempo múltiple en el gráfico.
    • Mostrar estadísticas: habilite este parámetro para mostrar el panel de estadísticas en el gráfico.
    • Configuración de dibujo: elija el color y el ancho de las líneas de corrección que se muestran en el gráfico.
    • Alertas: habilite las alertas de pantalla / correo electrónico / push / sonido para todas las configuraciones comerciales habilitadas anteriormente.

    Soporte y preguntas

    Utilice el servicio de asistencia para preguntas o asistencia oportuna. Escriba un correo electrónico a: help@pointzero-trading.com


    Autor

    Arturo López Pérez, inversor privado y especulador, ingeniero de software y fundador de Point Zero Trading Solutions.


    Comentarios 4
    Eric Venturi-Bloxs
    71115
    Eric Venturi-Bloxs 2022.12.30 05:54 
     

    Great indicator!

    Frank Paetsch
    7270
    Frank Paetsch 2019.11.16 04:43 
     

    very good indicator.

    I trade it with an EA .

    Very strong and profitable.

    Thank you Arturo

    Wantanakorn
    197
    Wantanakorn 2017.02.24 10:51 
     

    A very simple and easy to use.

    Productos recomendados
    Forex Gump
    Andrey Kozak
    2.83 (6)
    Forex Gump is a fully finished semi-automatic trading system. In the form of arrows, signals are displayed on the screen for opening and closing deals. All you need is to follow the instructions of the indicator. When the indicator shows a blue arrow, you need to open a buy order. When the indicator shows a red arrow, you need to open a sell order. Close orders when the indicator draws a yellow cross. In order to get the most effective result, we recommend using the timeframes H1, H4, D1. There
    147 USD
    Master Scalping M1 es un indicador innovador que utiliza un algoritmo para determinar la tendencia de forma rápida y precisa. El indicador calcula el tiempo de apertura y cierre de posiciones, los algoritmos del indicador le permiten encontrar los momentos ideales para ingresar a una operación (comprar o vender un activo), lo que aumenta el éxito de las transacciones para la mayoría de los comerciantes. Beneficios del indicador: Fácil de usar, no sobrecarga el gráfico con información innecesari
    30 USD
    Infinity Trend Pro
    Yaroslav Varankin
    1 (1)
    This is a trend indicator without redrawing Developed instead of the binary options strategy (by the color of the Martingale candlestick) Also works well in forex trading When to open trades (binary options) A signal will appear in the place with a candle signaling the current candle It is recommended to open a deal for one candle of the current timeframe M1 and M5 When a blue dot appears, open a deal up When a red dot appears, open a trade down. How to open trades on Forex. When a signal is rec
    1 000 USD
    Accuracy of correct predictions 83%! This indicator was tested on the basis of real statistics for all market indicators according to indicators for 3 months of trading. 83% of correct trade forecasts for usd / jpy on the m30 time frame were received on our statistics! if you have any questions, please contact us in private messages or in discussions under this indicator and we will figure it out and help any questions will arise personal messages or in discussions under this indicator As soon
    100 USD
    Daily Candle Predictor es un indicador que predice el precio de cierre de una vela. El indicador está destinado principalmente para su uso en gráficos D1. Este indicador es adecuado tanto para el comercio de divisas tradicional como para el comercio de opciones binarias. El indicador se puede utilizar como un sistema de negociación independiente o puede actuar como una adición a su sistema de negociación existente. Este indicador analiza la vela actual, calculando ciertos factores de fuerza dent
    65 USD
    ZhiBiCCI MT4
    Qiuyang Zheng
    5 (1)
    Los indicadores [ZhiBiCCI] son ​​adecuados para todos los ciclos de uso y también son adecuados para todas las variedades de mercado. [ZhiBiCCI] La línea verde sólida es una reversión de la divergencia alcista. La línea de puntos verde es una divergencia alcista clásica. [ZhiBiCCI] La línea continua hacia el rojo es una divergencia bajista inversa. La línea roja punteada es una divergencia bajista clásica. [ZhiBiCCI] puede configurarse en los parámetros (Alerta, Enviar correo, Enviar notif
    58 USD
    MACD Intraday Trend PRO es un indicador desarrollado a través de una adaptación del MACD original creado por Gerald Appel en la década de 1960. A lo largo de años de negociación, se observó que al cambiar los parámetros del MACD con proporciones de Fibonacci logramos una mejor presentación de la continuidad de los movimientos de la tendencia, haciendo que sea posible detectar de manera más eficiente el inicio y el final de una tendencia de precios. Debido a su eficiencia en la detección de
    77 USD
    Tunafish EA MT4
    Ismaele Daniele Lodetti
    Tunafish EA is the most efficient EA on my profile. I spent a lot of time and effort to make this software sophisticated with possibilities of high potential returns while keeping the drawdown below 25%. The algorithms of the robot provide investors of any level of training with an investment opportunity that is both safe and aggressive. Tunafish EA imitating the work of the brain, capable of learning and adapting to changing conditions and predicting situations. When applied to trading in fina
    69 USD
    El indicador construye cotizaciones actuales, que se pueden comparar con las históricas y, sobre esta base, hacer un pronóstico de movimiento de precios. El indicador tiene un campo de texto para una navegación rápida a la fecha deseada. Opciones: Símbolo - selección del símbolo que mostrará el indicador; SymbolPeriod - selección del período del cual el indicador tomará datos; IndicatorColor - color del indicador; HorisontalShift: cambio de cotizaciones dibujadas por el indicador
    55 USD
    Noize Absorption Index - is the manual trading system that measures the difference of pressure between bears forces and bulls forces. Green line - is a noize free index that showing curent situation. Zero value of index shows totally choppy/flat market.Values above zero level shows how powerfull bullish wave is and values below zero measures bearish forces.Up arrow appears on bearish market when it's ready to reverse, dn arrow appears on weak bullish market, as a result of reverse expectation. S
    199 USD
    Point61 Indicator
    Evgeniy Machok
    5 (1)
    The Point61 indicator is the result of many years of monitoring of price behavior of currency pairs and metals. It is not a secret, that in times of uncertainty, traders are looking for possible levels of support and resistance - the point, where price should stop its movement. There are 2 possible scenarios at these points: 1. Reverse (correction) to the opposite direction; 2. Breakthrough to continue movement. Very often these points are used to set stop orders - TakeProfit or
    249 USD
    Super Gator
    Agustinus Biotamalo Lumbantoruan
    This indi shows the following 1. Supertrend 2. Alligator (Not a regular alligator) 3. ZigZag 4. Moving Average 5. Trend Continuation/Mini correction Signal (plotted in X) (See screenshots in green background color 6. Early Signal Detection (See screenshots in green background color) You may treat Alligator as the lagging indicator The leading indicator is the supertrend. The zig zag is based on the leading indicator where it gets plotted when the leading indicator got broken to the opposite.
    150 USD
    The indicator detects and displays Shark harmonic pattern (see the screenshot). The pattern is plotted by the extreme values of the ZigZag indicator (included in the resources, no need to install). After detecting the pattern, the indicator notifies of that by a pop-up window, a mobile notification and an email. The indicator highlights the process of the pattern formation and not just the complete pattern. In the former case, it is displayed in the contour triangles. After the pattern is comple
    30 USD
    Cosmic Diviner X Planet
    Olena Kondratenko
    4 (2)
    This unique multi-currency strategy simultaneously determines the strength of trends and market entry points, visualizing this using histograms on the chart. The indicator is optimally adapted for trading on the timeframes М5, М15, М30, Н1. For the convenience of users, the indicator renders the entry point (in the form of an arrow), recommended take profit levels (TP1, TP2 with text labels) and the recommended Stop Loss level. The take profit levels (TP1, TP2) are automatically calculated for
    79 USD
    Introduction to Chart Pattern MT Chart Pattern MT is a chart pattern scanner to detect the triangle pattern, falling wedge pattern, rising wedge pattern, channel pattern and so on. Chart Pattern MT uses highly sophisticated chart pattern detection algorithm. However, we have designed it in the easy to use with intuitive user interface. Chart Pattern MT will show all the patterns in your chart in the most efficient format for your trading. You do not have to do tedious manual pattern detection an
    180 USD
    Chart Patterns Detect 15 patterns (Ascending Triangle, Descending Triangle, Rising Wedge, Falling Wedge, Bullish Flag, Bearish Flag, Bullish Rectangle, Bearish Rectangle Symmetrical triangle, Head and Shoulders, Inverted Head and Shoulders, Triple top, Triple Bottom, Double Top, Double Bottom) Use historical data to calculate the probability of each pattern to succeed (possibility to filter notification according to the chance of success) gives graphic indication about the invalidation level and
    58 USD
    Basado en ondas indicadoras MACD con parámetros estándar Aplica los niveles de Fibonacci a las dos últimas ondas MACD, positivas y negativas respectivamente, si en el momento en que el indicador MACD se queda sin Onda negativa - el color es verde, si en el momento en que el indicador MACD se queda sin Onda positiva - el color es rojo. El criterio de terminación de onda son dos ticks con un signo MACD diferente. Aplica líneas de tendencia en las últimas cuatro ondas MACD. Trabaja bien
    30 USD
    KT Renko Patterns MT4
    KEENBASE SOFTWARE SOLUTIONS
    2.33 (3)
    KT Renko Patterns scans the Renko chart brick by brick to find some famous chart patterns that are frequently used by traders across the various financial markets. Compared to the time-based charts, patterns based trading is easier and more evident on Renko charts due to their uncluttered appearance. KT Renko Patterns features multiple Renko patterns, and many of these patterns are extensively explained in the book titled Profitable Trading with Renko Charts by Prashant Shah. A 100% automate
    145 USD
    The indicator displays the data of the Stochastic oscillator from a higher timeframe on the chart. The main and signal lines are displayed in a separate window. The stepped response is not smoothed. The indicator is useful for practicing "manual" forex trading strategies, which use the data from several screens with different timeframes of a single symbol. The indicator uses the settings that are identical to the standard ones, and a drop-down list for selecting the timeframe. Indicator Parame
    30 USD
    SRP Pro
    Farhad Kia
    5 (1)
    Strong Retracement Points Pro edition! SRP (Strong Retracement/Reversal Points) is a powerful and unique support and resistance indicator. It displays the closest important levels which we expect the price retracement/reversal! If all level are broken from one side, it recalculates and draws new support and resistance levels, so the levels might be valid for several days depending on the market! If you are still hesitating to start using this wonderful tool, you can check this link to see how ef
    400 USD
    HMA Trend Professional MT4
    Pavel Zamoshnikov
    4.57 (7)
    Improved version of the free HMA Trend indicator (for MetaTrader 4) with statistical analysis. HMA Trend is a trend indicator based on the Hull Moving Average (HMA) with two periods. HMA with a slow period identifies the trend, while HMA with a fast period determines the short-term movements and signals in the trend direction. The main differences from the free version: Ability to predict the probability of a trend reversal using analysis of history data. Plotting statistical charts for analyz
    30 USD
    For sure, this indicator has become very popular amongst traders. Through coding this indicator will give you the most accurate levels possible for your trading analysis. We have also added in the ability for you to receive alerts when the price breaks above or below a Support or Resistance lines! HOW TO USE The red rectangles represent your resistance/supply zone. The green rectangles represent your support/demand zone.  BONUS FEATURES We coded this indicator with the ability to switch between
    197 USD
    5 signal in 1  Product     TimeFrame   Recommend   1m-5m recommend  signal   TF  5m    Banks Pro Binary Option is Indicator for binary option Can Use Manaul Trade or Robot on Platform  Mt2Trading  https://www.mt2trading.com/?ref=104    Time Trading   good work  EU session    Recommend  Curency   EUR  GBP USD        careful   AUD JPY      Recommend  Martingale 2-5 Step   Recommend  set profit  2%-5%/Day Setting Brake  News Event High volatility   recommend  15-30 min Have Problem Contract
    120 USD
    Entry Arrows Visual - is an arrow indicator designed for scalping and intraday trading. The principle of the indicator is based on the search for potential entries. Contains internal reversal filters. Built-in definition level TP and SL automates the process of selecting parameters for setting up a trading strategy. Product Features Can be used on all time frames and trading instruments. Can be used on M1, M5, M15 time frames for scalping or M30, H1, H4 for intraday trading, recommended fo
    65 USD
    Indicador de scalping de Forex que no vuelve a dibujar sus flechas. Funciona mejor en los plazos M5, M15, M30, H1. La configuración predeterminada es para el marco de tiempo M5. La siguiente imagen muestra un ejemplo de trabajo en el gráfico H1 con el valor del parámetro "período = 0,35". Puede descargar la versión demo y probarla usted mismo. Ahora usamos las señales de este indicador en casi todas nuestras estrategias de scalping. Según nuestros cálculos, la precisión de sus señales es de alr
    149 USD
    Trend Bilio - an arrow indicator without redrawing shows potential market entry points in the form of arrows of the corresponding color: upward red arrows suggest opening a buy, green down arrows - selling. The entrance is supposed to be at the next bar after the pointer. The arrow indicator Trend Bilio visually "unloads" the price chart and saves time for analysis: no signal - no deal, if an opposite signal appears, then the current deal should be closed. It is Trend Bilio that is considered
    140 USD
    Fourteen plus nine TD Sequential
    MOHAMMED IMAD HUSSEIN BASSEE
    Fourteen plus nine What is it for? Applying Tom DeMark’s TD Sequential serves the purpose of identifying a price point where an uptrend or a downtrend exhausts itself and reverses. . What are the main components of TD Sequential? TD Sequential has two parts – TD Setup and TD Countdown. The first phase of TD Sequential starts with a TD Setup and is completed with a 9 count. When the 9 count is completed, it is at that point, a price pause, price pullback, or reversal is likely. It is also at tha
    250 USD
    This is not Th3Eng PipFinite indicator It is Th3Eng PipFinite PRO ==> based on another logic and algorithms (Th3Eng PipFinite Original is here ) Attention: New update arrived for Th3Eng PipFinite PRO EA. So please contact us to get the new one. The Th3Eng PipFinite Pro indicator is based on an analysis of the right trend direction with perfect custom algorithms. It show the true direction and the best point of the trend. With Stop Loss point and Three Take Profit points. Also it show the righ
    150 USD
    The Th3Eng PipFinite indicator is based on a very excellent analysis of the right trend direction with perfect custom algorithms. It show the true direction and the best point to start trading. With StopLoss point and Three Take Profit points. Also it show the right pivot of the price and small points to order to replace the dynamic support and resistance channel, Which surrounds the price. And Finally it draws a very helpful Box on the left side on the chart includes (take profits and Stop loss
    89 USD
    RTrends
    Nikolay Likhovid
    The RTrends indicator does two things: first, it automatically draws the layout of the price chart by plotting trend lines and, secondly, it produces bearish and bullish signals. The layout reflects the fractal nature of the market. Trends from different time horizons are applied simultaneously on the chart. Thus, from a single chart a trader can see trend lines of higher timeframes. The lines, depending on the horizon, differ in color and width: the older the horizon, the thicker the line is. T
    60 USD
    Los compradores de este producto también adquieren
    ¡Actualmente 20% OFF ! ¡La mejor solución para cualquier novato o trader experto! Este software funciona con 28 pares de divisas. Se basa en 2 de nuestros principales indicadores (Advanced Currency Strength 28 y Advanced Currency Impulse). Proporciona una gran visión general de todo el mercado de divisas. Muestra los valores de Advanced Currency Strength, la velocidad de movimiento de las divisas y las señales para 28 pares de divisas en todos los (9) marcos temporales. Imagine cómo mejorar
    199 USD
    Ultimate Sniper Dashboard
    Hispraise Chinedum Abraham
    4.82 (22)
    ¡Descuento de 299 $! ¡Los precios pueden aumentar en el futuro! ¡Lea la descripción a continuación! Mejor Sistema de Entrada para Ultimate Sniper Dashboard: ULTIMATE DYNAMIC LEVELS. (Por favor, compruebe mis productos) El Ultimate Sniper Dashboard SÓLO funciona en mercados en vivo debido a los límites de prueba multidivisa de MT4. ¡Presentamos el Ultimate Sniper Dashboard! Nuestro mejor que contiene tanto HA-Sniper, MA-Sniper. y muchos modos especiales. ¡El Ultimate Sniper Dashboard es
    299 USD
    Ultimate Dynamic Levels
    Hispraise Chinedum Abraham
    4.88 (8)
    ¡Actualmente en descuento por vacaciones a 399 dólares! Los precios pueden aumentar en el futuro. ¡Lea la descripción a continuación!   ¡Presentamos Ultimate Dynamic Levels - el MEJOR indicador de entrada para el tablero de Ultimate Sniper! ¡¡¡Entradas oportunas de muy bajo riesgo y altas RR!!! Encuentre el Tablero de Francotirador Definitivo AQUÍ. La habilidad más importante para los operadores principiantes y profesionales es saber exactamente dónde y cuándo es más probable que un mercado
    199 USD
    Moonwalker
    Cengiz Erkoyuncu
    5 (6)
    El Indicador Moonwalker MT4 es una herramienta poderosa que puede revolucionar su estrategia de trading de tendencias en gráficos Renko. Sus algoritmos avanzados proporcionan una confiabilidad sin igual al rastrear las tendencias del mercado, mientras filtran las fluctuaciones repentinas y el ruido del mercado. Esto le permite operar con facilidad y confianza, sin el estrés de monitorear constantemente los mercados. A diferencia de otros indicadores, Moonwalker no repinta ni retrocede, lo que si
    250 USD
    A. ¿Qué es A2SR ?   * Es un indicador técnico líder (sin repintado, sin retraso). -- Guía : -- en https://www.mql5.com/en/blogs/post/734748/page4#comment_16532516 -- y https://www.mql5.com/en/users/yohana/blog A2SR tiene una técnica especial para determinar los niveles de Soporte (demanda) y Resistencia (oferta). A diferencia de la forma ordinaria que vimos en la red, A2SR tiene un concepto original para determinar los niveles reales de SR. La técnica original no se tomó de Internet y tampoco
    386 USD
    NAM Order Blocks
    NAM TECH GROUP, CORP.
    5 (1)
    Indicador de detección de Order Blocks multitimeframe para MT4. Características - Panel de control totalmente personalizable, proporciona una interacción completa. - Oculta y muestra el panel de control donde quieras. - Detecta OB en múltiples marcos de tiempo. - Permite seleccionar la cantidad de OB para mostrar. - Interfaz de usuario de diferentes OBs. - Diferentes filtros de OBs (regulares, rejection y sin capitalizar). - Alerta de proximidad de OBs. - Líneas ADR High y Low. - Servicio de not
    200 USD
    PZ Harmonacci Patterns
    PZ TRADING SLU
    3.43 (7)
    Este es posiblemente el indicador de reconocimiento automático de formación de precios más completo que puede encontrar para la plataforma MetaTrader. Detecta 19 patrones diferentes, toma las proyecciones de Fibonacci tan en serio como usted, muestra la zona de reversión potencial (PRZ) y encuentra niveles adecuados de stop-loss y take-profit. [ Guía de instalación | Guía de actualización | Solución de problemas | FAQ | Todos los productos ] Detecta 19 formaciones de precios armónicos difer
    249 USD
    Supply and Demand Dashboard PRO
    Bernhard Schweigert
    4.8 (20)
    ¡Actualmente 20% OFF ! Este tablero de instrumentos es una pieza muy poderosa de software de trabajo en múltiples símbolos y hasta 9 marcos de tiempo. Se basa en nuestro indicador principal (Mejores críticas: Advanced Supply Demand ).  El tablero de instrumentos da una gran visión general. Se muestra:  Valores filtrados de Oferta y Demanda, incluyendo la calificación de fuerza de la zona, Pips distancias a / y dentro de las zonas, Destaca las zonas anidadas, Da 4 tipos de alertas para los s
    199 USD
    Please send me Direct message on MQL5 CHAT after purchasing the Indicator for Training and Installation Support There are some additional files that is important to use with the Indicator . So be sure to contact me after purchasing the Indicator So that I can add you for training and support . If you find any difficulty with installation then send me Direct message here So that I can connect with you via Anydesk or Teamview for the product installation. " Smart Order Block Indicator " to find
    249 USD
    Quantum Currency Array Indicator
    QUANTUM TRADING SOFTWARE LIMITED
    This indicator has been developed to identify and display these trends quickly and easily, allowing you to see instantly, those currency pairs which are trending, and those which are not – and in all timeframes, with just one click. The 28 currency pairs are displayed as a fan as they sweep from strong to weak and back again, and this is why we call it the ‘currency array’. All 28 pairs are arrayed before you, giving an instant visual description of those pairs that are trending strongly, those
    197 USD
    Cycle Sniper
    Elmira Memish
    4.5 (32)
    NEW YEAR SALE PRICE FOR LIMITED TIME!!! Please contact us after your purchase and we will send you the complimentary indicators to complete the system. Cycle Sniper is not a holy grail but when you use it in a system which is explained in the videos, you will feel the difference. If you are not willing to focus on the charts designed with Cycle Sniper and other free tools we provide, we recommend not buying this indicator. We recommend watching the videos about the indiactor and system before
    200 USD
    Introduction to Fractal Pattern Scanner Fractal Indicator refers to the technical indicator that makes use of the fractal geometry found in the financial market. Fractal Pattern Scanner is the advanced Fractal Indicator that brings the latest trading technology after the extensive research and development work in the fractal geometry in the financial market. The most important feature in Fractal Pattern Scanner is the ability to measure the turning point probability as well as the trend probabi
    185 USD
    Blitz Scalper
    Cengiz Erkoyuncu
    Blitz Scalper es un indicador de scalping basado en acción de precio diseñado para ayudar a los traders a identificar rápidamente oportunidades de trading rentables como ENTRADA - SALIDA en el mercado Forex. Este indicador funciona en múltiples marcos de tiempo y está optimizado para trabajar con los pares de divisas principales. El indicador Blitz Scalper se basa en una combinación de estrategias de trading poderosas, incluyendo acción de precio, soporte y resistencia, y análisis de tendencias
    250 USD
    THEQ Volumen
    Luis Alberto Vazquez Carpio
    1 (1)
    THEQ Volumen muestra un oscilador de volumen preciso. Se puede usar para operar siguiendo tendencias o posibles cambios de tendencia. THEQ Volumen incluye también THEQ Volumen Arrows, un indicador con señales y alertas, y THEQ Volumen EA, un robot para operar en real/demo, hacer backtestings y poder optimizar o crear tu propia estrategia. El indicador adicional y Robot EA se envían por separado tras realizar el pago. THEQ Volumen no repinta, no tiene lag y las señales nunca desaparecen cuando la
    495 USD
    XQ Indicator MT4
    Marzena Maria Szmit
    The signal conditions are a combination of three indicators, and XQ Forex Indicators only display  medium and long-term trends . The indicator's efficacy has been improved with the addition of a filter that blocks out false signals. The XQ Forex Indicator can be used on  FX pairs, CFDs, and Cryptocurrencies . There are two type of signals:  Buy or Sell and Big Long or Big Short It is possible to enable sending emails when a major trend-change signal is detected, as well as to display the alerts
    189 USD
    Naked Forex Big Shadow Indicator Big Shadow Indicator is a pattern recognition indicator for Forex, Stocks, Indices, Futures, Commodities and Cryptos. When you have a Big Shadow on your chart then this is a strong signal meaning that you might be ahead of a reversal. You can take other elements (momentum, trend, volatility, price action, fundamentals) to build a complete strategy and confirm your entries. Beware that you might not make money just following the arrows generated by the pattern r
    177 USD
    El Indicador Nihilist 5.0 incluye la Mejor Estrategias de Trading Forexalien y Nihilist Easy Trend. El indicador se compone de un Dashboard MTF en donde se puede analizar las distintas posibilidades de entradas de cada estrategia con un simple vistazo. Dispone de un sistema de alertas con distintos tipos de filtros configurables y por cada TF que desee seleccionar los avisos en su plataforma Metatrader 4 y Smartphone. El indicador tiene la opción de seleccionar los TP y SL por ATR o fijos y lo
    299 USD
    DESCRIPTION The CHAOS INDICATOR has been developed to be used for the TRADING STRATEGY OF CHAOS, as described in the book. The book is in italian language only and can be obtained only on my website indicated below. DATAS COLLECTED AND SHOWN ON GRAPHS The CHAOS INDICATOR apply easily to any graph and any asset, and it is a TRADING FACILITATOR, as it identify immediately the following items on any graph: - The GP (= RIGHT PRICE) i.e. the price to which the asset should be attracted within 24
    380 USD
    Hello, I am Ayman from Egypt, I want to present an interesting indicator to you. It depends on Ichimoku Kinko Hyo, but there is a secret that i use in it. By using my indicator, you will be able to know a lot of important information in the market such as: Live Signal : https://www.mql5.com/en/signals/821024 Features You can avoid entry during market turbulence You can enter orders on the general trend only You will know if the trend is strong or weak If you entered an any orders by the help o
    300 USD
    Introduction to EFW Analytics EFW Analytics was designed to accomplish the statement "We trade because there are regularities in the financial market". EFW Analytics is a set of tools designed to maximize your trading performance by capturing the repeating fractal geometry, known as the fifth regularity in the financial market. The functionality of EFW Analytics consists of three parts. Firstly, Equilibrium Fractal Wave Index is an exploratory tool to support your trading logic to choose which r
    200 USD
    Volume by Price MT4
    Brian Collard
    5 (14)
    The Volume by Price Indicator for MetaTrader 4 features Volume Profile and Market Profile TPO (Time Price Opportunity). Get valuable insights out of currencies, equities and commodities data. Gain an edge trading financial markets. Volume and TPO histogram bar, line and metric charts. TPO letter and block marker charts including split structures. Positioning and styling options to suit the user's needs and context. Volume Profile and Market Profile TPO Point of Control (VPOC and TPOC), Imbalanc
    179.95 USD
    Agreement: Before Buy/Rent, make sure you have read this product description, slide images and video in more details  ️ Indicator USER MANUAL, Trade setups, solving issues, etc please visit   https://www.mql5.com/en/blogs/post/750802 Exclusive All In One   --- ( My Own Strategy )   Approach to trading based on: Smart Money Concept | SMC Elliott Wave Pattern | SMR Smart Money Reversal Harmonic Patterns | HP Fibonacci Pivot Points | FPP Quarters Points |  RN Round Numbers Average Daily
    189 USD
    Gartley Hunter Multi MT4
    Siarhei Vashchylka
    5 (2)
    The Gartley Hunter Multi indicator is designed to search for Gartley patterns on a very large number of currency pairs (maximum 60) and on all standard time frames (m1, m5, m15, m30, H1, H4, D1, Wk, Mn) at the same time. The search is carried out automatically. After finding the pattern, the indicator will send an Alert or notification to the mobile phone. List of patterns At the moment, there are patterns in the indicator: Alternate bat Bat Butterfly Crab Cypher Deep crab Gartley Indicator cont
    199 USD
    Robot Choppiness
    Diego Mauricio Padilla Mendez
    5 (1)
    El robot Choppines, se lo carga como indicador en la carpeta de indicadores del MT4 Se recomienda utilizar una temporalidad de velas de 5 minutos, el tiempo de expiración del robot recomendado es de 5 minutos. El robot puede configurarse para enviar señales a las plataformas MT2, MX2, PRICEPRO. Para realizar el envio de señales se debe utilizar el programa conector de la plataforma que queremos trabajar. Para instalar en el conector realice el siguiente procedimiento (se adjunta una imagen don
    599 USD
    Order Block Indicator MT4
    Diego Arribas Lopez
    5 (2)
    [ Versión MT 5 ] Order Block Indicator MT5 Order Block Indicator MT4 es actualmente el indicador más preciso y personalizable del mercado. Ha sido desarrollado para facilitar el análisis de operativas basadas en Bloques de Órdenes y Zonas de Oferta y Demanda. Estas zonas son posibles puntos de reversión de un movimiento. Order Block Indicator MT4 resalta los bloques de órdenes activos de hasta 4TFs simultáneamente. A su vez, Order Block Indicator MT4 provee de un sistema de alerta visual que
    224 USD
    Order Blocks ICT MT4
    Diego Arribas Lopez
    5 (1)
    MT5 Version   Kill Zones   SMT Divergences Order Blocks ICT The Order Blocks ICT indicator is a powerful tool for traders looking to gain an edge in the market. This indicator is based on the order flow and volume analysis, which allows traders to see the buying and selling pressure behind the price action. This information can be extremely valuable in identifying key levels of support and resistance, as well as potential turning points in the market. The Order Blocks ICT indicator is easy
    177 USD
    Congestioni
    Stefano Frisetti
    5 (1)
    This indicator is very usefull to TRADE Trading Ranges and helps identify the following TREND. Every Trader knows that any market stay 80% of the time in trading ranges and only 20% of the time in TREND; this indicator has been built to help traders trade trading ranges. Now instead of waiting for the next TREND, You can SWING TRADE on trading ranges with this simple yet very effective indicator. TRADING with CONGESTIONI INDICATOR: The CONGESTIONI Indicator identify a new trading range and a
    200 USD
    Welcome to the world of SMC (Smart Money Concepts) Trading, where we empower traders with the tools and knowledge to make smarter trading decisions. Our latest addition to our suite of trading tools is the SMC Trading Pro indicator, version 1.0. Key Features: Major Market Structure Identification with BODY break. Order Block must be in Major Swing ( not Small Swing ). Order Block with Fair Value Gap Detection. Order Block in Discount | Premium zone. Filter for only Bullish, Bearish or All Order
    199 USD
    ¡Este indicador es un indicador de análisis automático de ondas perfecto para el comercio práctico! La definición estandarizada de la banda ya no es una ola de personas diferentes, y se elimina el dibujo de interferencia provocada por el hombre, que juega un papel clave en el análisis riguroso del enfoque. =>Increase the choice of international style mode, (red fall green rise style)             ¡Descuento de compra actual!   Contenido del índice: 1.         Onda básica:   Primero, enco
    188 USD
    Naked Forex Kangaroo Tail Indicator for MT4 Kangaroo Tail Indicator is a pattern recognition indicator for Forex, Stocks, Indices, Futures, Commodities and Cryptos. The Kangaroo Tail is a multi-bar pattern. The Kangaroo Tail pattern is very effective and is very simple to trade. The strategy that comes with the Kangaroo Tail is based on price action. The indicator does what it was designed for: displaying Kangaroo Tail patterns.   Don't expect to follow the up and down arrows and make mo
    177 USD
    Otros productos de este autor
    PZ Harmonacci Patterns
    PZ TRADING SLU
    3.43 (7)
    Este es posiblemente el indicador de reconocimiento automático de formación de precios más completo que puede encontrar para la plataforma MetaTrader. Detecta 19 patrones diferentes, toma las proyecciones de Fibonacci tan en serio como usted, muestra la zona de reversión potencial (PRZ) y encuentra niveles adecuados de stop-loss y take-profit. [ Guía de instalación | Guía de actualización | Solución de problemas | FAQ | Todos los productos ] Detecta 19 formaciones de precios armónicos difer
    249 USD
    PZ Swing Trading MT5
    PZ TRADING SLU
    5 (4)
    Swing Trading es el primer indicador diseñado para detectar oscilaciones en la dirección de la tendencia y posibles oscilaciones de reversión. Utiliza el enfoque de intercambio de línea de base, ampliamente descrito en la literatura comercial. El indicador estudia varios vectores de precios y tiempos para rastrear la dirección de la tendencia agregada y detecta situaciones en las que el mercado está sobrevendido o sobrecomprado y listo para corregir. [ Guía de instalación | Guía de actualización
    175 USD
    PZ Trend Trading MT5
    PZ TRADING SLU
    3.67 (3)
    Trend Trading es un indicador diseñado para sacar el máximo provecho posible de las tendencias que tienen lugar en el mercado, mediante el cronometraje de retrocesos y rupturas. Encuentra oportunidades comerciales al analizar qué está haciendo el precio durante las tendencias establecidas. [ Guía de instalación | Guía de actualización | Solución de problemas | FAQ | Todos los productos ] Opere en los mercados financieros con confianza y eficiencia Aproveche las tendencias establecidas sin s
    175 USD
    ¿Cansado de trazar líneas de soporte y resistencia? La resistencia de soporte es un indicador de marco de tiempo múltiple que detecta y traza automáticamente los soportes y las líneas de resistencia en el gráfico con un giro muy interesante: a medida que los niveles de precios se prueban con el tiempo y aumenta su importancia, las líneas se vuelven más gruesas y oscuras. [ Guía de instalación | Guía de actualización | Solución de problemas | FAQ | Todos los productos ] Mejora tu análisis técnic
    125 USD
    Este es posiblemente el indicador de reconocimiento automático de formación de precios más completo que puede encontrar para la plataforma MetaTrader. Detecta 19 patrones diferentes, toma las proyecciones de Fibonacci tan en serio como usted, muestra la zona de reversión potencial (PRZ) y encuentra niveles adecuados de stop-loss y take-profit. [ Guía de instalación | Guía de actualización | Solución de problemas | FAQ | Todos los productos ] Detecta 19 formaciones de precios armónicos difer
    249 USD
    Esta es la última versión de mi famoso scalper, Goldfinch EA, publicado por primera vez hace casi una década. Escalifica el mercado en las expansiones repentinas de volatilidad que tienen lugar en cortos períodos de tiempo: asume e intenta capitalizar la inercia en el movimiento de los precios después de una aceleración repentina de los precios. Esta nueva versión se ha simplificado para permitir al operador utilizar la función de optimización del probador fácilmente para encontrar los mejores p
    FREE
    PZ Support Resistance
    PZ TRADING SLU
    3.33 (3)
    ¿Cansado de trazar líneas de soporte y resistencia? La resistencia de soporte es un indicador de marco de tiempo múltiple que detecta y traza automáticamente los soportes y las líneas de resistencia en el gráfico con un giro muy interesante: a medida que los niveles de precios se prueban con el tiempo y aumenta su importancia, las líneas se vuelven más gruesas y oscuras. [ Guía de instalación | Guía de actualización | Solución de problemas | FAQ | Todos los productos ] Mejora tu análisis técnic
    125 USD
    Las ondas de Wolfe son patrones comerciales naturales presentes en todos los mercados financieros y representan una lucha por un precio de equilibrio. Estos patrones pueden desarrollarse en períodos de tiempo a corto y largo plazo y son uno de los patrones de reversión predictiva más confiables que existen, normalmente preceden movimientos de precios fuertes y largos. [ Guía de instalación | Guía de actualización | Solución de problemas | FAQ | Todos los productos ] Señales comerciales claras I
    125 USD
    PZ Reversal Fractals MT5
    PZ TRADING SLU
    4.59 (29)
    This is the latest iteration of my famous indicator, Reversal Fractals, published for the first time almost a decade ago. It examines the price structure of fractals to determine possible reversal points in the market, providing timing to positional traders that already have a fundamental or technical valuation model. [ Installation Guide | Update Guide | Troubleshooting | FAQ | All Products ] Reversal fractals can start long trends The indicator is non repainting It implements alerts of all k
    FREE
    Esta es la última versión de mi famoso scalper, Goldfinch EA, publicado por primera vez hace casi una década. Escalifica el mercado en las expansiones repentinas de volatilidad que tienen lugar en cortos períodos de tiempo: asume e intenta capitalizar la inercia en el movimiento de los precios después de una aceleración repentina de los precios. Esta nueva versión se ha simplificado para permitir al operador utilizar la función de optimización del probador fácilmente para encontrar los mejores p
    FREE
    PZ Day Trading MT5
    PZ TRADING SLU
    2.6 (5)
    Este indicador detecta reversiones de precios en forma de zig-zag, utilizando solo análisis de acción de precios y un canal donchian. Ha sido diseñado específicamente para el comercio a corto plazo, sin repintar ni pintar en absoluto. Es una herramienta fantástica para comerciantes astutos con el objetivo de aumentar el tiempo de sus operaciones. [ Guía de instalación | Guía de actualización | Solución de problemas | FAQ | Todos los productos ] Increíblemente fácil de comerciar Proporciona
    175 USD
    PZ Day Trading
    PZ TRADING SLU
    3.67 (3)
    Este indicador detecta reversiones de precios en forma de zig-zag, utilizando solo análisis de acción de precios y un canal donchian. Ha sido diseñado específicamente para el comercio a corto plazo, sin repintar ni pintar en absoluto. Es una herramienta fantástica para comerciantes astutos con el objetivo de aumentar el tiempo de sus operaciones. [ Guía de instalación | Guía de actualización | Solución de problemas | FAQ | Todos los productos ] Increíblemente fácil de comerciar Proporciona
    175 USD
    Este indicador encuentra los patrones de retroceso AB = CD. El patrón de retroceso AB = CD es una estructura de precios de 4 puntos en la que el segmento de precios inicial está parcialmente retrocedido y seguido de un movimiento equidistante desde la finalización del retroceso, y es la base básica de todos los patrones armónicos. [ Guía de instalación | Guía de actualización | Solución de problemas | FAQ | Todos los productos ] Tamaños de patrones personalizables Relaciones de CA y BD pe
    75 USD
    PZ Pivot Points MT5
    PZ TRADING SLU
    4.95 (21)
    This indicator displays pivot points in the chart, including historical vales, and supports many calculation modes for Pivot Points and S/R levels. [ Installation Guide | Update Guide | Troubleshooting | FAQ | All Products ] It plots historical levels for backtesting purposes It allows you to select the reference timeframe It implements different Pivot Point calculation modes It implements different SR calculation modes It implements customizable colors and sizes Calculation Modes The indi
    FREE
    PZ Binary Options MT5
    PZ TRADING SLU
    4.18 (11)
    This indicator analyzes price action patterns and helps you to make positive equity decisions in the binary options market. [ Installation Guide | Update Guide | Troubleshooting | FAQ | All Products ] Easy to trade Trade both call and put options No crystal ball and no predictions The indicator is non-repainting The only strategy suitable for binary options is applying a mathematical approach, like professional gamblers do. It is based on the following principles: Every binary option represents
    FREE
    PZ Trendlines MT5
    PZ TRADING SLU
    4.8 (5)
    Tired of plotting trendlines? The PZ TrendLines MT5 indicator applies a mechanical approach to the construction of trend lines for you!  [ Installation Guide | Update Guide | Troubleshooting | FAQ | All Products ] It can draw up to 18 trendlines Trendlines can be optionally based on fractals Each line represents a breakout level Each trendline can be broken or rejected Configurable amount of lines Configurable colors Support I am happy to provide free products but given my limited time, they com
    FREE
    Las ondas de Wolfe son patrones comerciales naturales presentes en todos los mercados financieros y representan una lucha por un precio de equilibrio. Estos patrones pueden desarrollarse en períodos de tiempo a corto y largo plazo y son uno de los patrones de reversión predictiva más confiables que existen, normalmente preceden movimientos de precios fuertes y largos. [ Guía de instalación | Guía de actualización | Solución de problemas | FAQ | Todos los productos ] Señales comerciales claras I
    125 USD
    PZ Inside Bars MT5
    PZ TRADING SLU
    4.5 (8)
    This indicator detects inside bars of several ranges, making it very easy for price action traders to spot and act on inside bar breakouts. [ Installation Guide | Update Guide | Troubleshooting | FAQ | All Products ] Easy to use and understand Customizable color selections The indicator implements visual/mail/push/sound alerts The indicator does not repaint or backpaint An inside bar is a bar or series of bars which is/are completely contained within the range of the preceding bar. A blue box is
    FREE
    PZ Swing Trading
    PZ TRADING SLU
    5 (4)
    Swing Trading es el primer indicador diseñado para detectar oscilaciones en la dirección de la tendencia y posibles oscilaciones de reversión. Utiliza el enfoque de intercambio de línea de base, ampliamente descrito en la literatura comercial. El indicador estudia varios vectores de precios y tiempos para rastrear la dirección de la tendencia agregada y detecta situaciones en las que el mercado está sobrevendido o sobrecomprado y listo para corregir. [ Guía de instalación | Guía de actualización
    175 USD
    PZ Turtle Trading MT5
    PZ TRADING SLU
    4.43 (7)
    The Turtle Trading Indicator implements the original Dennis Richards and Bill Eckhart trading system, commonly known as The Turtle Trader. This trend following system relies on breakouts of historical highs and lows to take and close trades: it is the complete opposite to the "buy low and sell high" approach. The main rule is "Trade an N-day breakout and take profits when an M-day high or low is breached (N must me above M)".  [ Installation Guide | Update Guide | Troubleshooting | FAQ | All Pr
    FREE
    Este indicador reconoce más de 30 patrones de velas japonesas y los resalta maravillosamente en el gráfico. Es simplemente uno de esos indicadores sin los que los operadores de acciones de precios no pueden vivir. Mejora tu análisis técnico de la noche a la mañana Detecta patrones de velas japonesas fácilmente Comercio de patrones de inversión confiables y universales Salte a las tendencias establecidas de forma segura utilizando patrones de continuación El indicador no se repinta e implementa
    99 USD
    PZ Pivot Points
    PZ TRADING SLU
    4.62 (13)
    This indicator displays pivot points in the chart, including historical vales, and supports many calculation modes for Pivot Points and S/R levels.  [ Installation Guide | Update Guide | Troubleshooting | FAQ | All Products ] It plots historical levels for backtesting purposes It allows you to select the reference timeframe It implements different Pivot Point calculation modes It implements different SR calculation modes It implements customizable colors and sizes Calculation Modes The indi
    FREE
    PZ Trendlines
    PZ TRADING SLU
    4.6 (10)
    Tired of plotting trendlines? The PZ TrendLines indicator applies a mechanical approach to the construction of trend lines for you!  [ Installation Guide | Update Guide | Troubleshooting | FAQ | All Products ] It can draw up to 18 trendlines Trendlines can be optionally based on fractals Each line represents a breakout level Each trendline can be broken or rejected Configurable amount of lines Configurable colors Support I am happy to provide free products but given my limited time, they come
    FREE
    PZ Market Profile
    PZ TRADING SLU
    4.2 (10)
    The market profile indicator provides with an X-Ray vision into market activity, outlining the most important price levels, value area and control value of the daily trading session. [ Installation Guide | Update Guide | Troubleshooting | FAQ | All Products ] Easy to understand and use Understand market dynamics easily Automatic timeframe selection Identify zones of trading value and discard others It is useful in all market conditions Effective for any trading strategy It implements three color
    FREE
    PZ Lopez Flow MT5
    PZ TRADING SLU
    5 (3)
    This indicator studies price action as an aggregation of price and time vectors, and uses the average vector to determine the direction and strength of the market. This indicator highlights the short-term directionality and strength of the market, and can be used to capitalize from short-term price movements by trading breakouts or binary options.  [ Installation Guide | Update Guide | Troubleshooting | FAQ | All Products ] Find market direction easily Confirm with breakouts or other indicators
    FREE
    PZ Sandwich Bars MT5
    PZ TRADING SLU
    5 (2)
    This indicator detects Sandwich Bars of several ranges, an extremely reliable breakout pattern. A sandwich setup consists on a single bar that engulfs several past bars, breaking and rejecting the complete price range. [ Installation Guide | Update Guide | Troubleshooting | FAQ | All Products ] Easy and effective usage Customizable bar ranges Customizable color selections The indicator implements visual/mail/push/sound alerts The indicator does not repaint or backpaint The indicator could not b
    FREE
    PZ Oscillator MT5
    PZ TRADING SLU
    4 (7)
    Pz Oscillator es un sensible indicador que ofrece mucha información útil y detecta automáticamente las divergencias . Se puede utilizar esta herramienta como confirmación de la ejecución de la operación y para identificar la dirección y la fuerza de la tendencia. El indicador ha sido desarrollado como complemento a una serie de nuestras herramientas de trading. Dirección de la tendencia El oscilador dibuja dos medias móviles mostrando la dirección de la tendencia. Si la media móvil rápida está
    FREE
    PZ Three Drives
    PZ TRADING SLU
    4 (3)
    This indicator finds Three Drives patterns. The Three Drives pattern is a 6-point reversal pattern characterised by a series of higher highs or lower lows that complete at a 127% or 161.8% Fibonacci extension. It signals that the market is exhausted and a reversal can happen. [ Installation Guide | Update Guide | Troubleshooting | FAQ | All Products ] Customizable pattern sizes Customizable colors and sizes Customizable breakout periods Customizable 1-2-3 and 0-A-B ratios It implements visua
    FREE
    PZ Binary Options
    PZ TRADING SLU
    4 (2)
    This indicator analyzes price action patterns and helps you to make positive equity decisions in the binary options market. [ Installation Guide | Update Guide | Troubleshooting | FAQ | All Products ] Easy to trade Trade both call and put options No crystal ball and no predictions The indicator is non-repainting The only strategy suitable for binary options is applying a mathematical approach, like professional gamblers do. It is based on the following principles: Every binary option represents
    FREE
    PZ Turtle Trading
    PZ TRADING SLU
    3.67 (12)
    The Turtle Trading Indicator implements the original Dennis Richards and Bill Eckhart trading system, commonly known as The Turtle Trader. This trend following system relies on breakouts of historical highs and lows to take and close trades: it is the complete opposite to the "buy low and sell high" approach. The main rule is "Trade an N-day breakout and take profits when an M-day high or low is breached (N must me above M)". [ Installation Guide | Update Guide | Troubleshooting | FAQ | All Prod
    FREE
    Filtro:
    Eric Venturi-Bloxs
    71115
    Eric Venturi-Bloxs 2022.12.30 05:54 
     

    Great indicator!

    Frank Paetsch
    7270
    Frank Paetsch 2019.11.16 04:43 
     

    very good indicator.

    I trade it with an EA .

    Very strong and profitable.

    Thank you Arturo

    Wantanakorn
    197
    Wantanakorn 2017.02.24 10:51 
     

    A very simple and easy to use.

    Ian Tavener
    1323
    Ian Tavener 2015.01.23 16:18 
     

    I use this indicator in an EA I wrote, and for this purpose it is very helpful. I just use a couple basic signal confirmations and proper money management.

    However, for manual trading I don't think this indicator is necessary. The signals it provides are noticeable to the eye of most successful traders. For automated trading, I give this indicator 5 stars. For manual trading, I give it 3.

    Respuesta al comentario
    Versión 6.2 2021.04.25
    - Display improvements
    Versión 6.0 2021.04.25
    - Improved breakouts
    - Added signal buffer for iCustom (buffer 12, shift 1)
    Versión 5.0 2019.02.18
    - Bug fixes regarding backtesting
    Versión 4.5 2016.04.26
    - Improved alerts
    Versión 4.2 2016.04.04
    - Bug fix regarding chart stats
    Versión 4.0 2016.01.28
    - Added self-analysis capability to the indicator
    The indicator will evaluate all trend changes, pullbacks and breakouts and display the accuracy rate. These values are important to select a profitable period for the indicator on your current chart.
    Versión 3.0 2015.09.15
    - Исправлена ошибка в отображении коррекций. Обновите до последней версии.
    Versión 2.2 2015.07.28
    - Important bug fix in dashboard
    Versión 2.0 2015.07.23
    - Added onchart multi-timeframe dashboard
    Versión 1.5 2015.03.17
    - The indicator now evaluates two trends: main and secondary. The secondary trend is displayed using the color of the bars on the chart.
    Versión 1.2 2014.09.30
    Important bug fixes.