PZ Trend Trading
- 指标
- PZ TRADING SLU
- 版本: 6.2
- 更新: 25 四月 2021
- 激活: 20
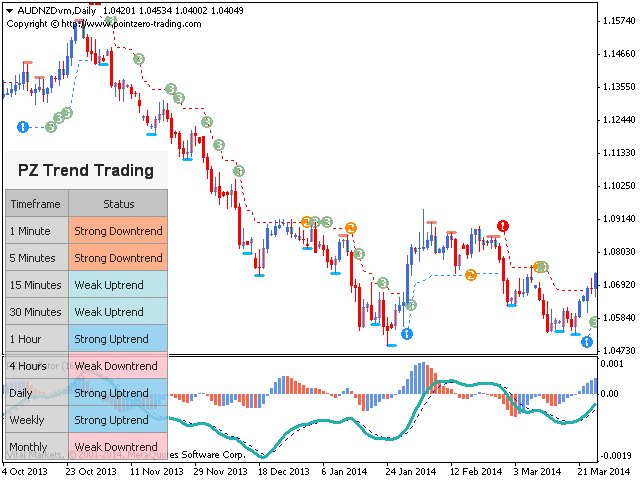
许多盈利交易者不仅知道如何识别市场趋势,而且也能把握趋势建立后的交易机会。 Pz 趋势交易 指标设计用来在趋势行情中尽可能的赚取利润。
已建立的趋势提供了一揽子交易机会,但大多数趋势交易指标完全忽视了它们,让交易者在趋势行情时完全不知道该如何做!一般趋势指标只通知有关的趋势变化,但根本不足以得到卓越的回报.
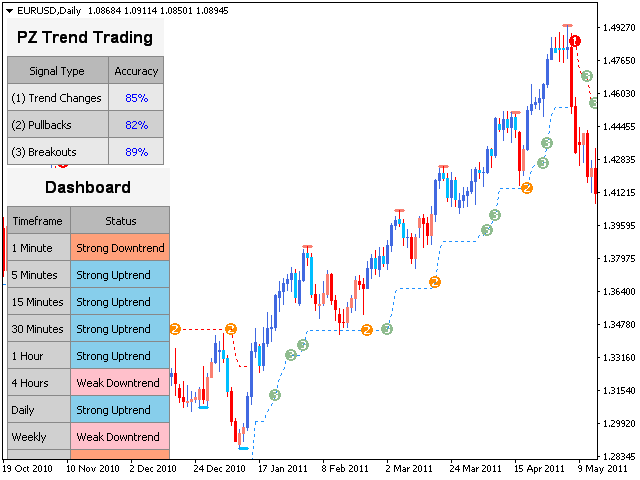
Pz 趋势交易 指标比一般趋势指标显示多达 20 倍的交易, 因为它注重所谓的市场时机。它不仅显示当前的市场趋势,也有回调,内柱线的突破和调整。它令您在趋势回调之后介入,安全的柱线内突破金字塔加仓,以及发现潜在的反转,和已知的调整。
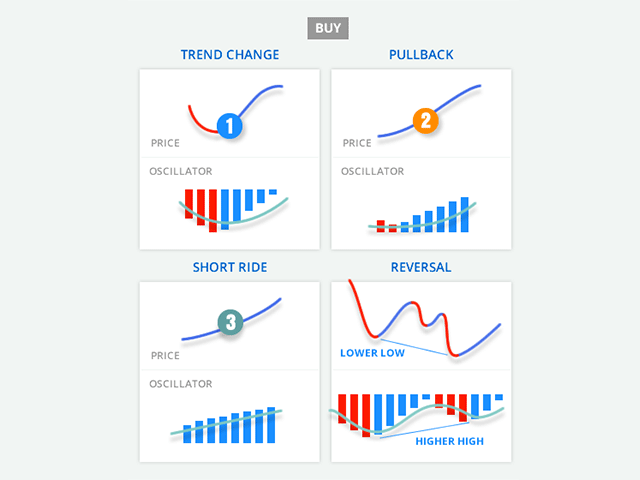
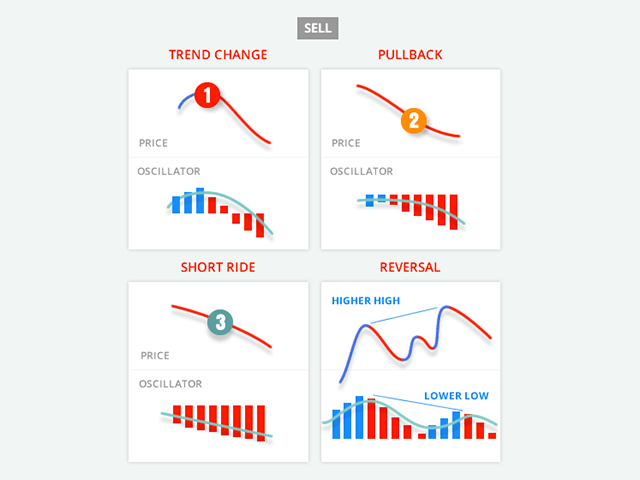
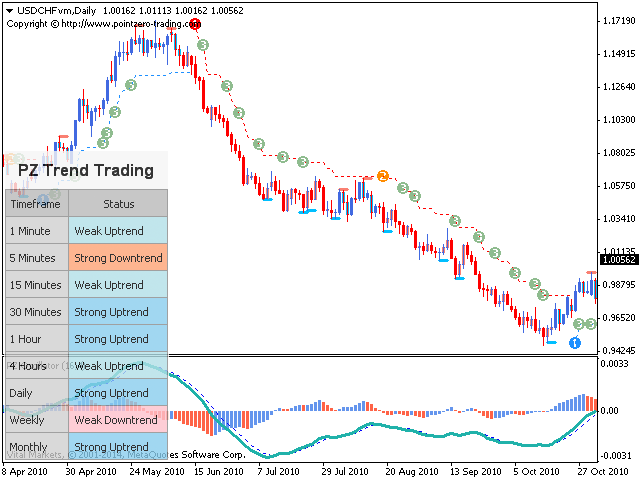
趋势改变
一个趋势改变在市场方向变化时发生。趋势变化在图表上用带数字的彩色圆圈显示。蓝色 (1) 信号为上涨开始, 而红色 (1) 信号为下跌开始。趋势变化并非评估当前价格动作的结果, 它意味着交易设置是不定时地。如果您正确使用本指标, 在趋势变化时, 您将将已经入场 (参看下面的调整)。
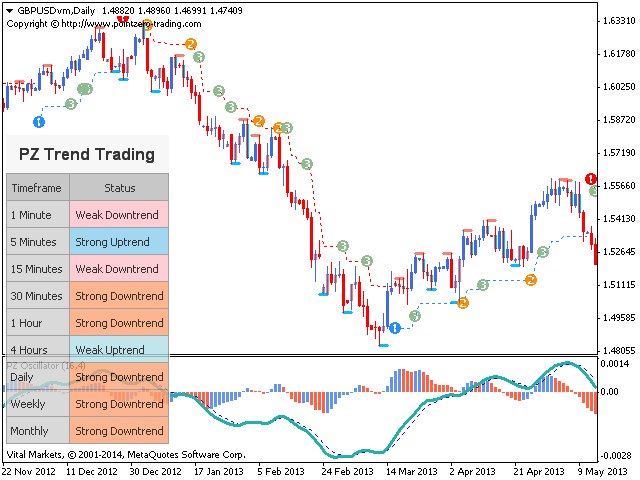
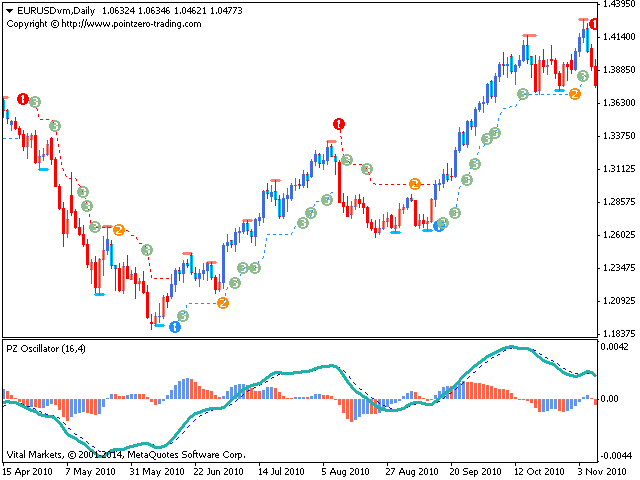
回调
但凡趋势在运动中,行情上下抖动,盈利者收割利润,且其它参与者入场。趋势回调代表好的买入机会,通常是由主力获利离场导致。如果行情在回调后回归上行, 指标将在图表上绘制蓝色 (2) 。回调是非常好的交易机会,但在单边趋势中可能不会发生。
内柱线突破
一个内柱线是一根柱线 (或一序列柱线) 完整包含在之前柱线范围内, 好似母亲柱线。突破内柱线 (或柱线组) 代表在已建立的趋势中交易会有更多利润, 因为风险回报率极高: 它是极佳风险回报交易的高概率入场点,因为所需设置的止损很小。指标将在突破内柱线时 (或柱线组) 绘制一个 (3), 它是极好切入趋势的机会,或是进行金字塔加仓.
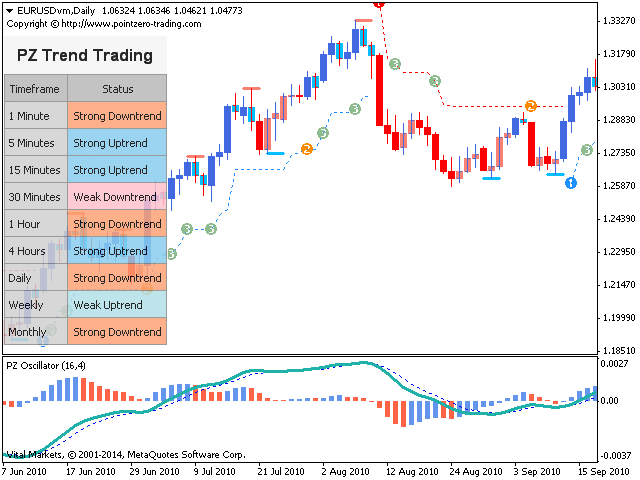
调整
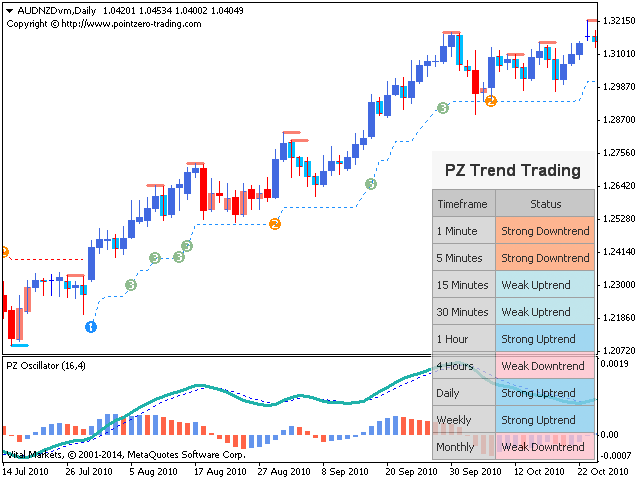
调整是趋势回归方向后,回吐足够强大触发的回调,或是价格触及趋势线后趋势改变。每次回调和趋势变化,所有情况下,之前总会有调整。指标将在检测到调整时绘制彩色点划线, 红色点划线 (---) 为上行趋势中的空头调整,而蓝色点划线 (---) 是下行趋势中的多头调整。
调整代表极棒的交易机会, 在主导趋势真正反转之前给您交易的机会。此外,风险回报率巨大,因为初始止损可以相当紧凑。然而,极端重要的是,在交易之前确保趋势较弱。您应该下列一个或多个来确认调整交易:
- 振荡器背离确认调整
- 一个双顶或双底形态出现
- 头肩形态出现
- 谐波形态出现
请记住,行情不会简单逆转:每次趋势移动直到衰竭,然后才会逆转。确认趋势衰竭的关键是行情已经逆转, 并使用调整信号,以便先于他人入场。使用 Pz 趋势交易 指标之后一会儿, 您将会很容易发现衰竭。
其它调整的用法如下:
- 在行情震荡区间交易 (通过使用调整作为交易信号)。
- 了解何时从您的交易中获得部分盈利(如果远离主趋势线)。
- 在宽幅调整且触发假趋势改变之后,重新介入行情。
对交易新手的建议
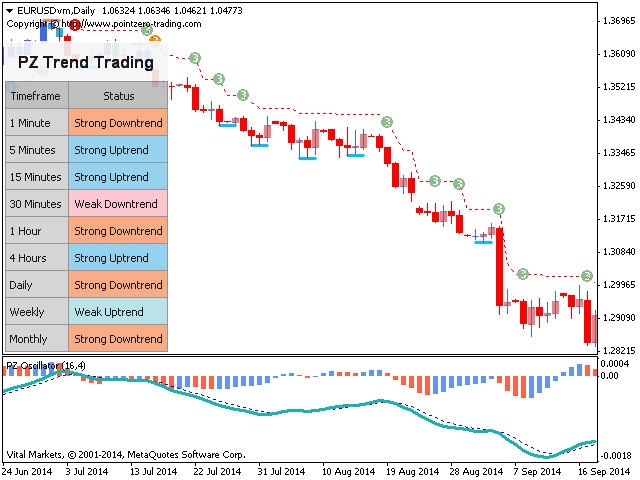
Pz 趋势交易 指标有无限可能,但新手应关注最简单的设置,即是 (2) 回调和 (3) 内柱线突破,因为它们的计算考虑到趋势方向和当前价格动作。超过 85% 的回调合突破是有利可图的, 并且有时可盈利交易会持续很久。
新手也应该避免试图在最佳位置离场, 并使用指标主线作为尾随终止来减轻仓位管理。这消除了焦虑或判断失误空间,并让利润奔跑。新手应该坚持这个仓位管理策略,直到他们可以轻松进行金字塔加仓。
新手应该按照日线和周线图表交易,以避免宽幅波动,或支付与潜在利润相比离谱的经纪佣金。行情很像是视频游戏,有不同的层次。新手不应该在 H4 图表进行交易,直到他们能在 D1 和 W1 图表上稳定盈利。
设置
当加载指标到任意图表, 您将看到一组选项作为输入参数。不要绝望,如果您认为它们太多了,因为参数按照自我解释分块。这就是每个参数块的作用。
- 指标设置
在指标设置块, 您可以设置指标周期并选择哪些交易设置必须显示。您可以显示或隐藏回调, 突破和调整。MaxHistoryBars 参数控制检查多少以往柱线以减少内存使用。
- 绘图设置
选择图表上显示的调整线的颜色和宽度。
- 提示
启用交易设置显示/邮件/推送/发声提示。
一些细节
- 指标在每根柱线检查,而非每次报价。
- 指标评估若干递归价格/时间向量。
- 指标通过一至二十根内柱线识别突破。
- 所有设置实现了可视, 发声, 邮件和推送提示。
作者
Arturo López Pérez, 私人投资者和投机者, Point Zero Trading Solutions 的创始人及软件工程师。


Great indicator!