PZ Trend Trading
- インディケータ
- PZ TRADING SLU
- バージョン: 6.2
- アップデート済み: 25 4月 2021
- アクティベーション: 20
トレンドトレーディングは、タイミングのプルバックとブレイクアウトにより、市場で起こっているトレンドから可能な限り利益を得るように設計された指標です。確立されたトレンドの中で価格が何をしているかを分析することにより、取引の機会を見つけます。
[ インストールガイド
| 更新ガイド
| トラブルシューティング
| よくある質問
| すべての製品
]
- 自信を持って効率的に金融市場を取引する
- むち打ちにならずに確立されたトレンドから利益を得る
- 収益性の高いプルバック、ブレイクアウト、早期の逆転を認識する
- この指標は、独自の品質とパフォーマンスを分析します
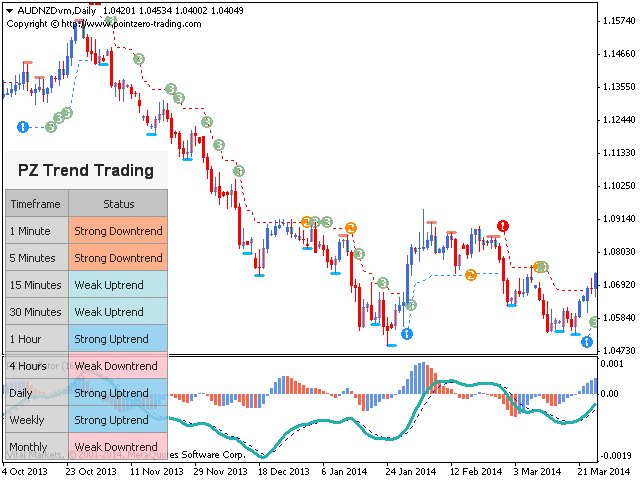
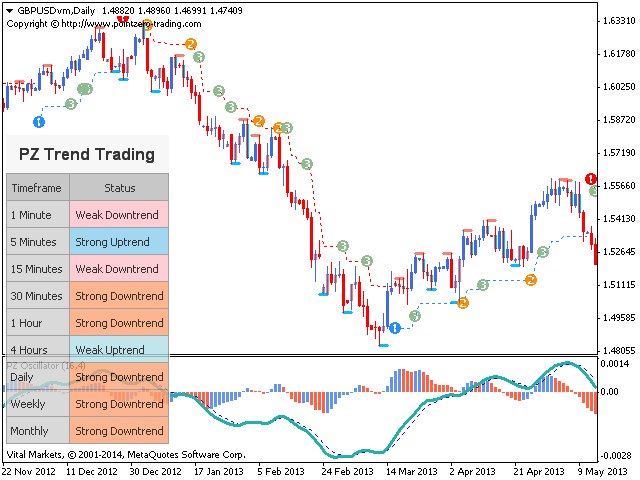
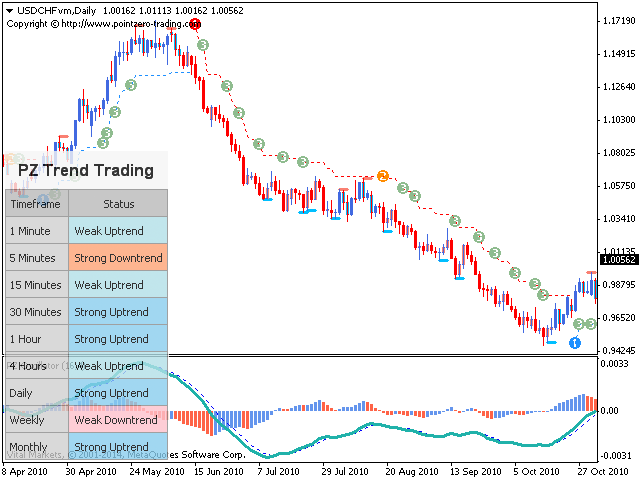
- 複数時間枠のダッシュボードを実装します
- インジケーターは再描画されていません
- 電子メール/音声/視覚アラートを実装します
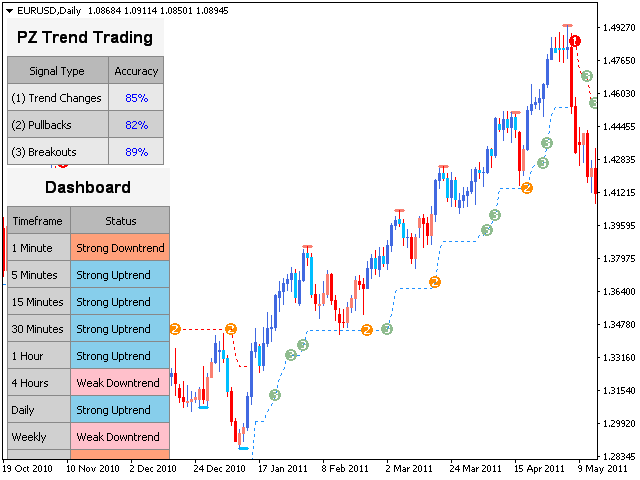
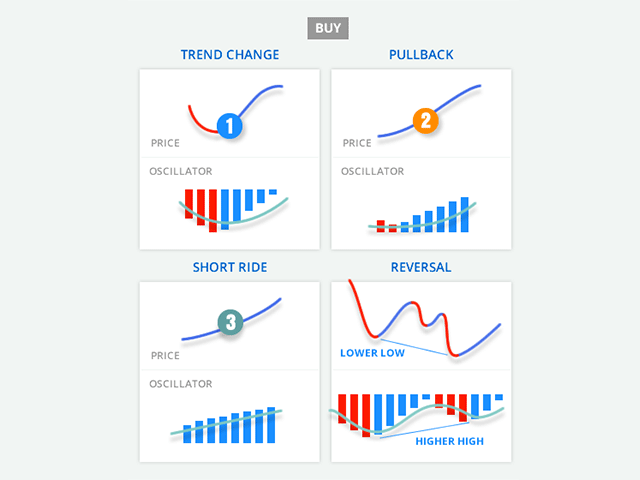
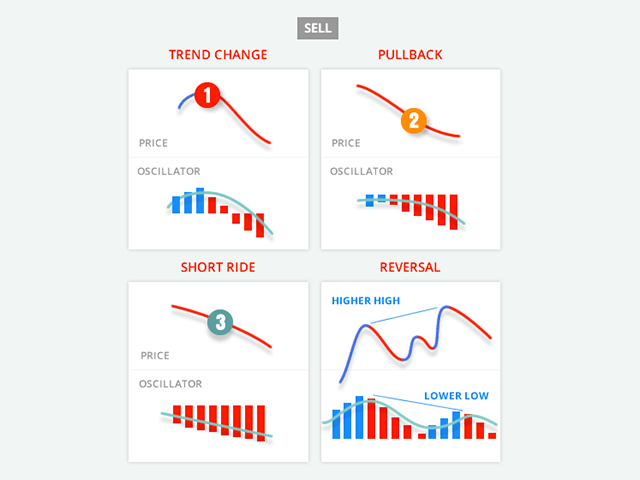
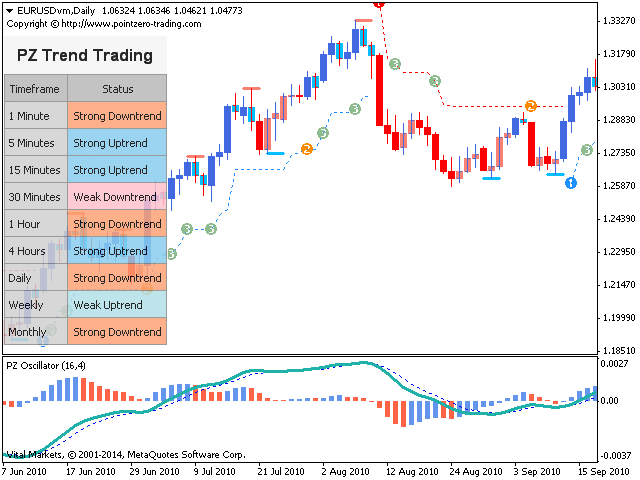
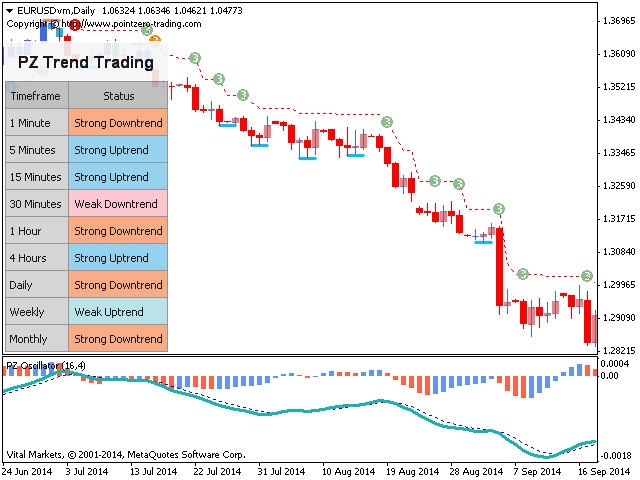
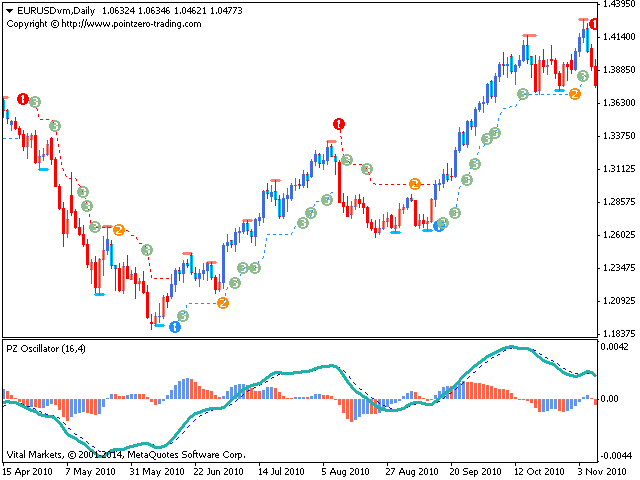
確立されたトレンドは多くの取引機会を提供しますが、ほとんどのトレンド指標はそれらを完全に無視しています。インジケーターの解釈はかなり簡単です:
- (1)トレンドの変化
- (2)トレンドの方向への後退
- (3)トレンドの方向へのブレイクアウト
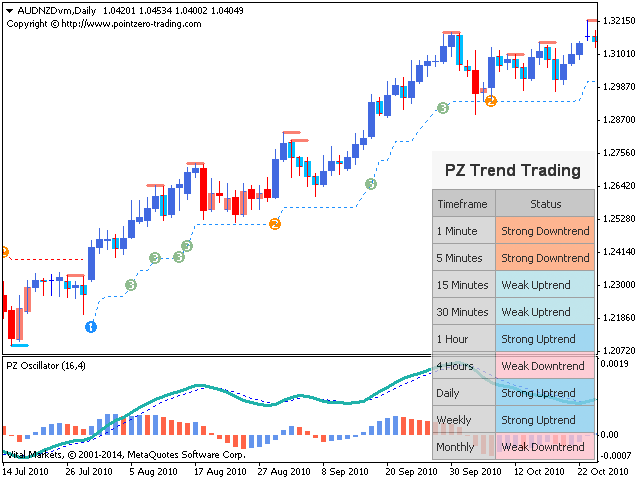
- 赤いダッシュは下降トレンド中の修正です
- 青いダッシュは上昇トレンド中の修正です
- 青いバーは強気のサブトレンドです
- レッドバーは弱気のサブトレンド
入力パラメータ
- インジケーター期間:このパラメーターは、トレンドの変化に対する感度を制御します。大きな期間は、より長いトレンドを捉えることになります。短い期間では、キャプチャされるトレンドが短くなりますが、トレンドの変化はより速く認識されます。
- サブトレンドの表示:このパラメーターを有効にすると、価格バーの色にサブトレンドが反映されます。
- プルバックの表示:このパラメーターを有効にすると、チャートに(2)オブジェクトとして表示されるプルバックが表示されます。
- ブレークアウトの表示:このパラメーターを有効にすると、トレンドの方向にブレークアウトが表示され、(3)オブジェクトとして表示されます。
- 修正の表示:このパラメーターを有効にすると、トレンドの修正が色付きのダッシュとして表示されます。
- 最大履歴バー:このパラメーターは、インジケーターの読み込み時に検査される過去のバーの数を制御します。
- ダッシュボードを表示する:このパラメーターを有効にすると、チャート上にマルチタイムフレームダッシュボードが表示されます。
- 統計の表示:このパラメーターを有効にすると、グラフに統計ダッシュボードが表示されます。
- 描画設定:チャートに表示される補正線の色と幅を選択します。
- アラート:上記で有効にしたすべての取引設定について、表示/メール/プッシュ/サウンドのアラートを有効にします。
サポートと質問
ヘルプデスクを使用して、質問やタイムリーなサポートを受けてください。 help@pointzero-trading.comにメールを書いてください。
著者
ArturoLópezPérez、個人投資家および投機家、ソフトウェアエンジニア、Point Zero Trading Solutionsの創設者。


Great indicator!