PZ Trend Trading
- 지표
- PZ TRADING SLU
- 버전: 7.0
- 업데이트됨: 19 7월 2024
- 활성화: 20
Capture every opportunity: your go-to indicator for profitable trend trading
Special Offer: Purchase now to receive free bonuses worth $109! (Read more for details)
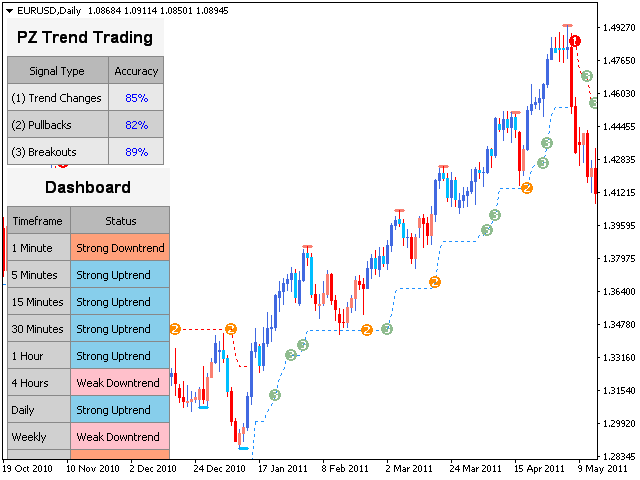
Trend Trading is an indicator designed to profit as much as possible from trends taking place in the market, by timing pullbacks and breakouts. It finds trading opportunities by analyzing what the price is doing during established trends.
[ Installation Guide | Update Guide | Troubleshooting | FAQ | All Products ]
- Trade financial markets with confidence and efficiency
- Profit from established trends without getting whipsawed
- Recognize profitable pullbacks, breakouts and early reversals
- The indicator analyzes its own quality and performance
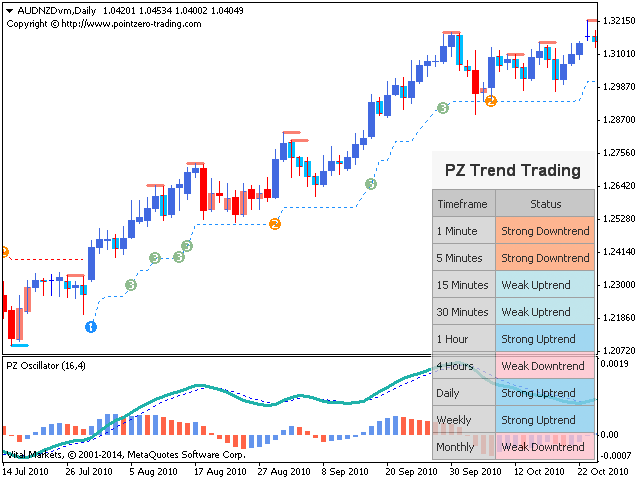
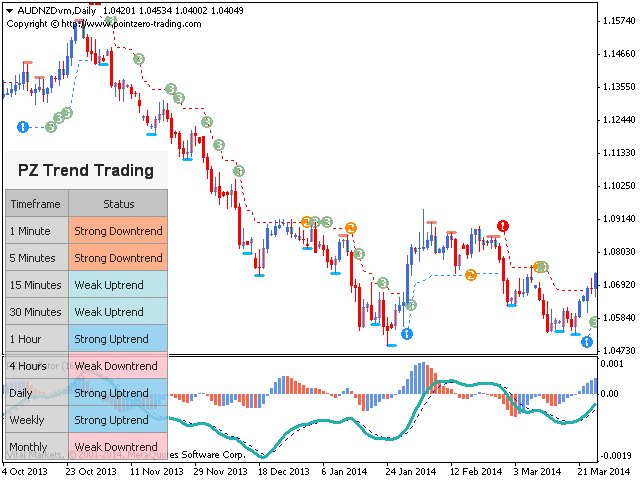
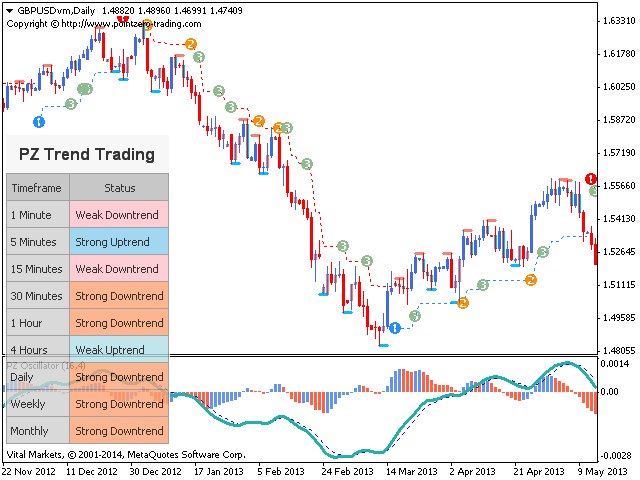
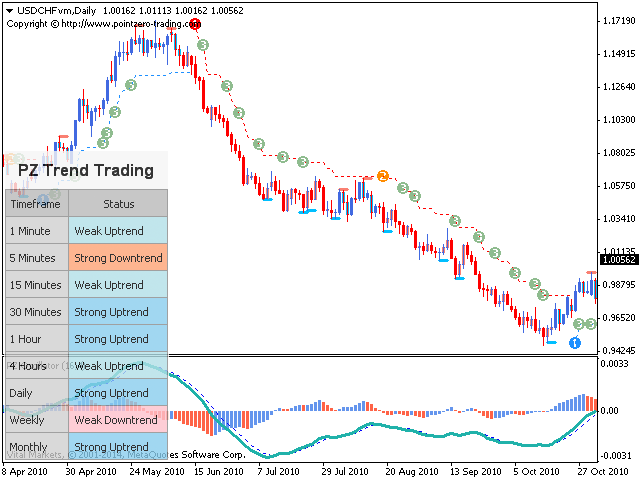
- It implements a multi-timeframe dashboard
- The indicator is non-repainting
- It implements email/sound/visual alerts
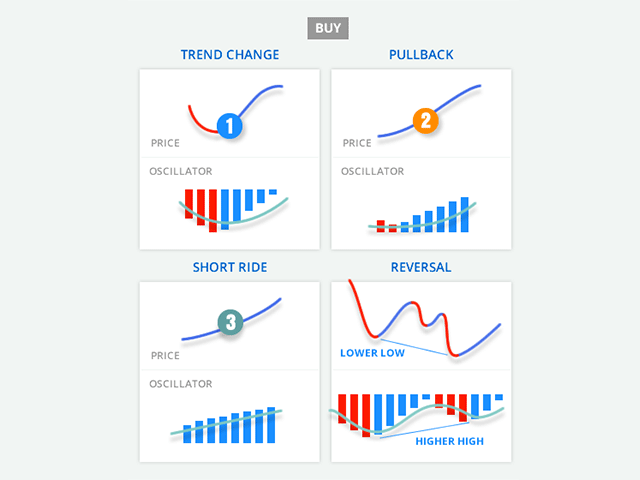
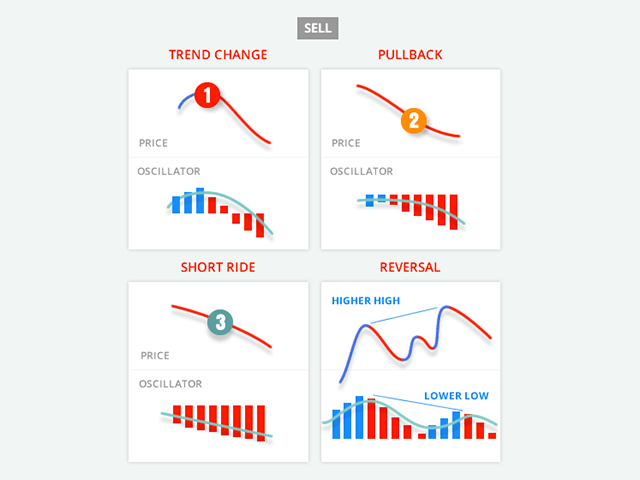
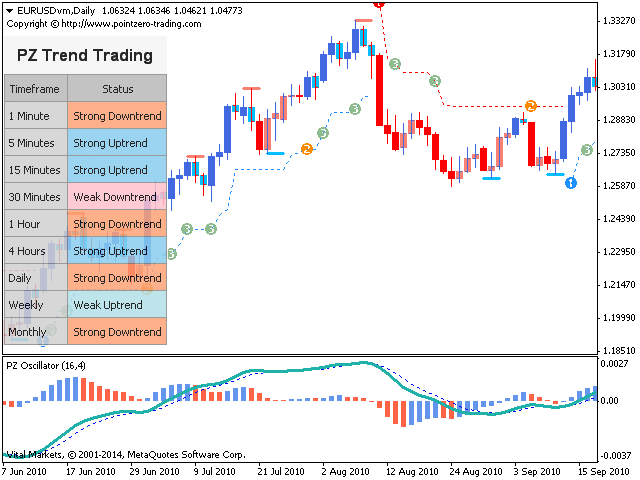
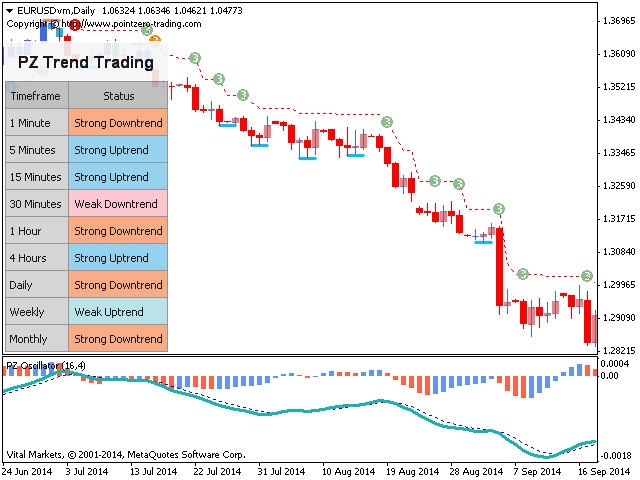
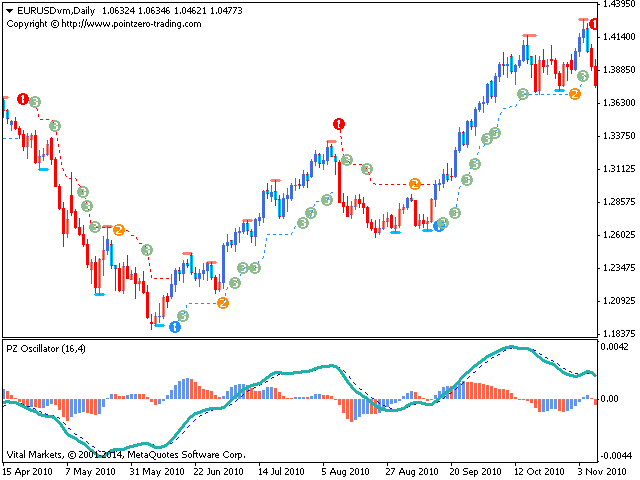
Established trends offer dozens of trading opportunities, but most trend indicators neglect them completely. Interpreting the indicator is fairly easy:
- (1) is a trend change
- (2) is a pullback in the direction of the trend
- (3) is a breakout in the direction of the trend
- A red dash is a correction during a downtrend
- A blue dash is a correction during an uptrend
- Blue Bars are a bullish sub-trend
- Red Bars are a bearish sub-trend
Input Parameters
- Indicator Period: This parameter controls the sensitivity to trend changes. A big period will lead to longer trends being captured. A small period will lead to shorter trends being capture, but a faster recognition of trend changes.
- Display Sub-Trend: Enable this parameter to see the sub-trend reflected in the color of the price bars.
- Display Pullbacks: Enable this parameter to see pullbacks, displayed as (2) objects in the chart.
- Display Breakouts: Enable this parameter to see breakouts in the direction of the trend, displayed as (3) objects.
- Display Corrections: Enable this parameter to see trend corrections, displayed as colored dashes.
- Max. History Bars: This parameter controls how many past bars are examined upon loading of the indicator.
- Display the dashboard: Enable this parameter to see the multi-timeframe dashboard on the chart.
- Display statistics: Enable this parameter to display the stats dashboard on the chart.
- Drawing Settings: Choose the color and width of the correction lines displayed on the chart.
- Alerts: Enable display/email/push/sound alerts for all the trading setups enabled above.
Buy today and unlock exclusive bonuses!
- PZ Flat Market Index Indicator (worth $30)
- PZ Lopez Pressure Indicator (worth $49)
- PZ Multi TDI Indicator (worth $30)
To claim these bonuses, simply send me a private message. I will provide the bonuses to actual buyers of the indicator. To ensure it is you, please leave a review for the product first, or alternatively, provide the mql5 operation number of your purchase. I'll get back to you with your bonuses as soon as possible.
The price of this indicator might increase next week!
We've introduced dynamic pricing for this indicator to reflect its true market value. With each sale, the price increases by $1, rewarding early buyers. If no sales occur within a week, the price resets to the original rate, with prices updated every Monday. This model lets the market decide the product's value, but there’s always a chance to grab your desired tools at a cheaper price if you prefer to wait.
Author
Arturo López Pérez, private investor and speculator, software engineer and founder of Point Zero Trading Solutions.


This is a great indicator. I love it.