Versión 4.3
2024.07.02
- Keyboard - Fix Ctrl Click issue
Versión 4.2
2024.04.09
- Keyboard - Fix Ctrl and Shift Click mappings on MT5
Versión 4.1
2024.01.11
- Solo Zones - Use "Zone Line Width 1" when setting SoloZone Line Width
- Keyboard - Fix Ctrl and Shift Click mappings on MT5
- Alerts - Add "Reverse Candle From Zone" alerts
- Alerts - Update parameter names
Versión 4.0
2022.05.12
- Overall Trend - Add "Three In A Row" option to highlight trend when all three timeframe trends align
- Hotkeys - Zone Visibility - With Trend - Hide zones with unknown trend status
- Alerts - Zone Visibility - Alow user to filter visibility independent of the display hotkey setting
Versión 3.9
2022.04.11
- New Alerts - Stop excessive alerts being generated when multiple timeframes are active
Versión 3.8
2022.02.07
- Block invalid alerts that were triggered when broker resets data feed
- Improve level tooltip texts to always include nested info
- Summary Panel - Add parameter Trend Show Consolidation Dots
- Summary Panel - Rename parameter Engulfings - Stop Loss to Engulfings - Viable Size
Versión 3.7
2021.05.05
Enhancements
- Timeframes - Add new timeframe options - Current Plus One / Two / Three
- Profiles - Add parameter "Clear Hotkeys On Terminal Close" to improve profile switching on MT5
- Offline Charts - Add support for offline charts and backtest tools with missing market data and unsynced current time
Fixes
- Summary Panel - Q Points - Improve accuracy of real time updates
- Summary Panel - Q Points - Ensure text is positioned correctly in the center of the box
- Trend Change - Incremental - Check that BarNum >= MinBarsOldZones
- Mouse Events - Keep CHART_EVENT_MOUSE_MOVE enabled if other indicators are waiting on mouse events
Versión 3.6
2021.04.20
Enhancements
- MT5 - Add support for extended timeframes
- Trend Worm - Add option to display Trend Worm and/or Consolidation Worm on the chart
(Due to a platform issue, MT5 users may need to re-attach the indicator to see the Trend Worm)
Performance
- Clear Hotkey - Improve performance of clear chart calls
- Redraw - Remove ObjectsDeleteAll calls that slow other indicators with many objects
Versión 3.5
2021.04.02
Fixes
- Summary SupDem - Apply Filters to SupDem column
- iCustom - Apply Filters to iCustom buffers
- iCustom - Improve Blahtech Expert Advisor Examples
- Alerts - Add MinBarsLevel and PriceAway filters to alerts
- Overall Move - Fix edge case where Overall Move wasn't being calculated correctly
Versión 3.4
2021.03.24
Enhancements
- Enable filters whenever an individual filter is changed in the GUI
- iCustom - Refactor EA code examples into class to support cleaner multiple instances
Fixes
- Summary SupDem - Improve highlighting of overlapped zones
- Consolidations - Fix edge case when near MaxBars
- Allow user to configure Timeframes 1-4 in any order
- Allow experts to operate on higher timeframes than the current chart period
- Change format of diff files to support iCustom development
- Only populate iCustom buffers if they are enabled and used
- Change position of Overall Move filter to the top half of the GUI
Versión 3.3
2021.03.08
Enhancements
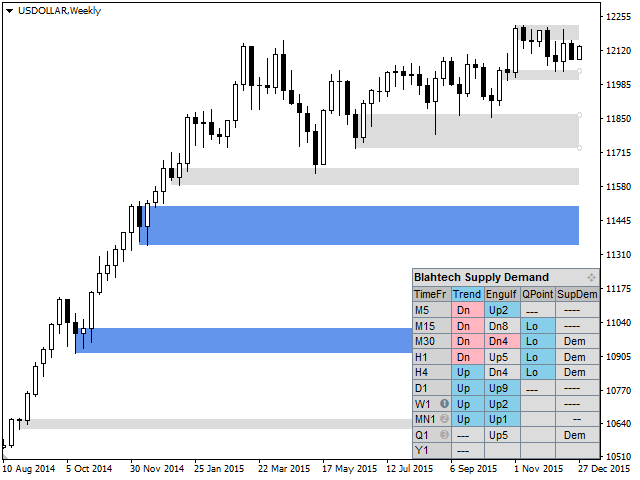
- Summary Trend - Display dot next to the trend direction when recent bars are consolidating
- Filters - Add Max Levels filter to allow the user to restrict the number of levels on the chart
- Zone Highlight - Add parameter to change highlighting mode (None/Strength/Untouched)
- Parameters - Write simple list of changed parameters to experts log when Ctrl+Q keys are pressed
- Parameters - Create detailed report of changed parameters in Files/Blahtech directory to assist users and support
Fixes
- Q Points - Add Min Risk Reward parameter
- Trend Change - Add Min Range and rename Min Risk Reward parameters
- Overall Trend Alerts - Print all three timeframe directions in alert message
- Summary SupDem - Improve highlighting accuracy with overlapped zones
- Old Zones - Enable detection of old zones with just two bars
- Consolidation - Fix edge case in consolidation zones detection
- Hotkeys - Revert regression from 3.1 release where [ and ] were swapped round
- Expert Advisor Mode - Change to a single option named "Reserved For iCustom Calls"
Versión 3.2
2021.01.20
Enhancements
- Alerts - Add parameter "Filter Nested (Levels)" to control raising alerts for nested zones only
- Alerts - Add parameter "Trigger Alerts Early" to trigger touch/break alerts N points before the level
- Hotkey Panel - Add "Alerts Nest" button to allow user to modify the nested zone filter from the GUI
- Summary - Alerts panel - Add icon next to title to show "Trigger Early Alerts" points value
- Summary - Alerts panel - Improve alerts icon tooltips
- Touches - Increase accuracy of Touches and add optional Touch/Untouch points parameters
- Info - Add parameter to control the precision of the {lots1} substitution string
- Info - Add a second user custom format string
Fixes
- Alerts - Fix edge case where duplicate alerts could be raised
- Alerts - Remove overlaps from Retouch alerts and apply filters to New alerts
- Alerts - Don't raise alerts for levels hidden from display by the "Zone Visibility" parameter
- Alerts - Improve text format, add bid price and number of touches
- Trend Change - Modify trend change parameter to OVERLAP_ALL to improve consistency of trend reversals
- Summary Panel - Improve accuracy of summary panel when price retraces from touched levels
- Summary Panel - Optimise summary panel redraw to compensate for increased accuracy
- HotKey Panel - Adjust panel Y location when position changed to Bottom left/right
Versión 3.1
2019.10.17
- Enable left mouse click actions on Hotkey panel when keys have been reserved
Versión 3.0
2019.10.09
Enhancements
- Add a third mode to the Summary panel GUI to control all alerts
- Alow user to set individual alert timeframes for Trend, Engulfings, QPoints and Levels
- Allow M30,H4,D1 as well as 1,2,3 when setting alerts timeframe parameters
- Enable Summary Timeframe Bubble Numbers by default
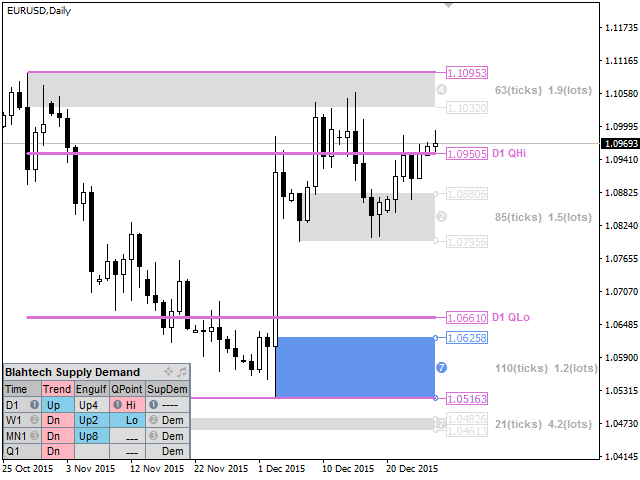
- Add bubble numbers to QPoints and SupDem columns in the Summary panel
- Add option to adjust the zone start bar of a level to the begining of a consolidation
- Add Timeframe hints to the TF section of the Hotkey panel
- Add {lots3} option to Info format
Fixes
- Change default colour of QPoint 2 from MediumOrchid to PaleVoiletRed
- Change Invert Style and colour parameters to be more intuitive
- Change text colour of oversized Q Points on the chart to Gray
- Change Summary heading from TimeF to Time
- Improve the behaviour of the Q Points hotkeys
- Modify all lines drawn by the indicator to be unselectable
- Include first bar in search for max move away of zones and Q Points
- Reset hotkey settings when indicator is removed from chart or chart is closed
- Only call TerminalInfoInteger to get ctrl status when key pressed or object clicked
Versión 2.9
2019.07.18
Fix issue when backtesting beyond Max Bars
Versión 2.8
2019.06.19
Enhancements
- Add options to draw multi timeframe Q Points on the chart
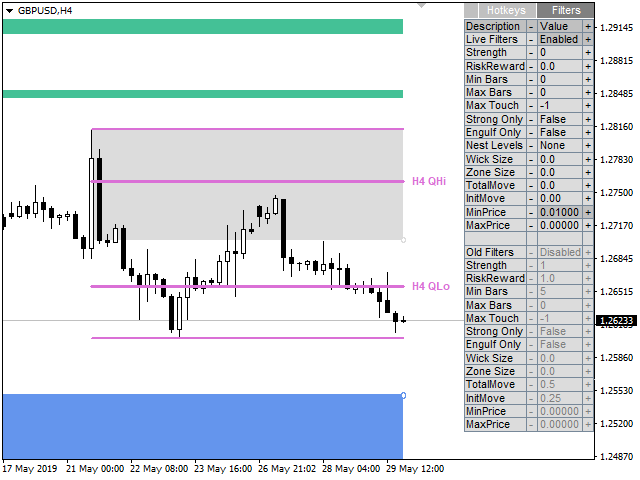
- Add GUI tab within HUD panel for control of filter parameters
- Add extra filters for Nested Levels, Zone Size and Min Price Away
- Change default values for live filters to disabled
- Add option to choose method for Zone Height calculation - Default/Whole Body/Entire Candle
- Add parameters to limit zone height "Zone Height Min" and "Zone Height Max"
- Add iCustom Buffers for QPoint 1 Top Bar and QPoint 1 Bot Bar
- Add option to display Total Move in custom format
- Left clicking any description in the Hud Panel now resets the value back to its input parameter version
Fixes
- Change defaults to display more features on chart at startup
- Check UserTickSize to stop divide by zero error
- Check for empty iCustom buffer
Versión 2.7
2018.05.30
Enhancements
- Option to disable highlighting of Strong Zones
- Option to use Current Timeframe only for Overall Trend
- Parameter to change corner anchor of Summary Display
- Added Sup/Dem button to show only supplies or demands
- Added filter for number of retouches
- Added filter for levels that were formed by engulfing pattern
- Added filter for max price away
- Added filter for age of old zones in bars
- Support alerts for trend changes
- Support alerts for overall trend changes
Versión 2.5
2017.08.29
Enhancements
- Support alerts for QPoint touches and breaks
- Support alerts for up to 3 timeframes
- Support inverted zone styles for the multi timeframe display
- Remember hotkey states when restarting terminal
- Support iCustom calls with 64+ parameters by using a set file
Changes
- Add tooltips to nested zone graphics
- Add reserved keys parameter to prevent clashes with other products
Versión 2.2
2017.04.06
Enhancements
- Support additional timeframes
- Support alerts for engulfings
- Draw zones one bar back if the conterminous line originates there
- Changed colour and font of QPoints label when range greater than 15x average size
- Separated old and active filters to simplify usage
- Added advanced iCustom buffers for timeframes two and three
- Added second demo mode to show extra timeframes
= Summary Panel
- Support clicking on timeframe values to show/hide zones
- Support clicking on QPoint values to change focus
- Disabled highlighting of QPoint value in pink/blue when range is less than 15x average range
- Modified highlighting of SupDem values to only use pink/blue
= Hotkeys
- Reversed the order of hotkey changes when "Shift" key is pressed
- Nudge both start and end of zones one bar forward when "X" key is pressed
Fixes
- Remember the QPoint timeframe set by the user when switching chart timeframes
- Fixed the average bar size to match version 1.0 values (regression bug)
- Rebuild with latest compiler for MetaTrader platform changes
- Changed all global variables to be constant expressions
Versión 2.1
2017.01.19
Fixes
- Resolved issues with iCustom calls
Performance
- Reduced overhead each tick to optimise Expert Advisor performance
- Added Expert Advisor mode to skip creation and drawing of objects
Versión 2.0
2016.12.09
New Features
- Alerts - User customisable
- Engulfing detector - Multi-timeframe
- Filters - User configurable visibility filters
- Old Zones - Choice of broken levels or trend changes
- Nested Zones - Highlight levels that are nested within higher timeframe zones
- iCustom - Add buffers for developers
Enhancements
- Info - Add bubble scores
- Scores - Normalise with-trend scores so they are always out of 8
- Timeframes - Change mappings for M1 to M1/M5/M30
- Strength Engine Mode - Allow user to relax the criteria for a strong zone
- Calc Mode - Add option to disable incremental calculations
- Demo Mode - Allow user to switch between default and demo settings
= Summary display:
- Show icons when filters are active
- Highlight "extended" trend in deeper colour
- Support clicking then dragging panel to new location
= Hotkey display:
- Add verbose display
- Allow user to change value by clicking on the rows
- Support clicking then dragging panel to new location
- Highlight values that have changed from input parameter settings
Fixes
- Summary - Do not highlight countertrend levels when all three trends align
- Scores - Change so the user enters 0-8 rather than 0.0-1.0 for the strong zone scores
- Trend - Support DBD levels changing trend
- Hotkeys - Update position when window height is changed
- Backtest - Use TimeLocal for backtest expire so it works when market is closed
- Reset - Force clear and redraw of all objects on Reset
Architecture
- Candle parser - Rewrite candle parse to enable old zones
Performance
- Implement incremental calculations to reduce CPU usage
- Only refresh each tick if next level has been touched or broken
- Only redraw Hotkey display if chart width has changed
New Hotkeys
- "9" - Demo mode
- "=" - Strength Mode
- "]" - Filters - All Zones
- "[" - Filters - Old Zones
- ";" - Old Zones
- "'" - Old Zones Style
- "#" - Nested Zones
Developers and parameters
- Developers - Twenty five iCustom buffers
- Parameters - Fifty extra parameters to control new features
- See documentation for details http://www.blahtech.co.uk/supplydemand
Versión 1.1
2016.04.12
- Bug Fix : Chart Zones - Hotkey "X" wasn't working on MN1 timeframe
- Enhancement : Chart Zones - Add new Hotkey "Z" - Zone style (Applies to solo timeframe only)
- Enhancement : Summary View - Highlight Active QPoint and differentiate between in the middle (---) and no QPoints ( )
- Enhancement : Summary View - Change overall trend to use "Two Adjacent" rather than "Best Of Three"
- Enhancement : Summary View - Improve Trend detection when we bust the top
- Enhancement : Summary View - Improve SupDem highlighting to focus on QPoints as well as Trend
- Enhancement : Summary View - Add Input parameter - Highlight SupDem in QPoint - Level Strength
- Enhancement : Summary View - Shift text right one space when in full mode
- Enhancement : Daylight Savings - UseDaylightSavings parameter - Change default to true
- Enhancement : High Res Displays - WindowsDesktopScaling - Add parameter to support desktop scaling for 4K and other high res screens
- Performance : Backtest Mode - Do not recalculate every tick when in backtest mode






Awesome, i like the idea and its running very very good