• 概要
  • レビュー (40)
  • コメント (364)
  • 最新情報

Blahtech Supply Demand

4.62

Supply Demand uses previous price action to identify potential imbalances between buyers and sellers. The key is to identify the better odds zones, not just the untouched ones.

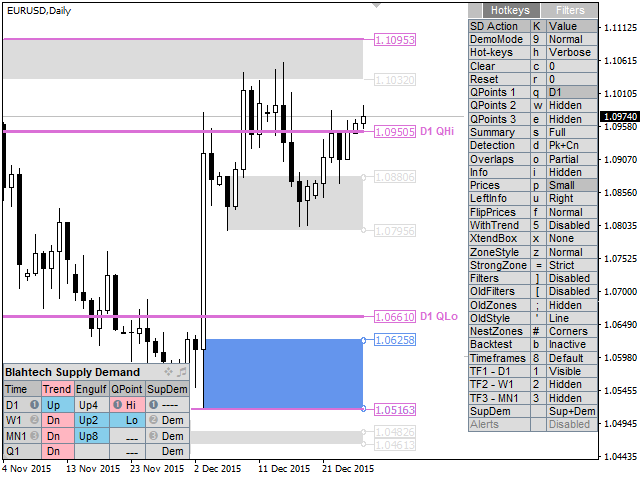
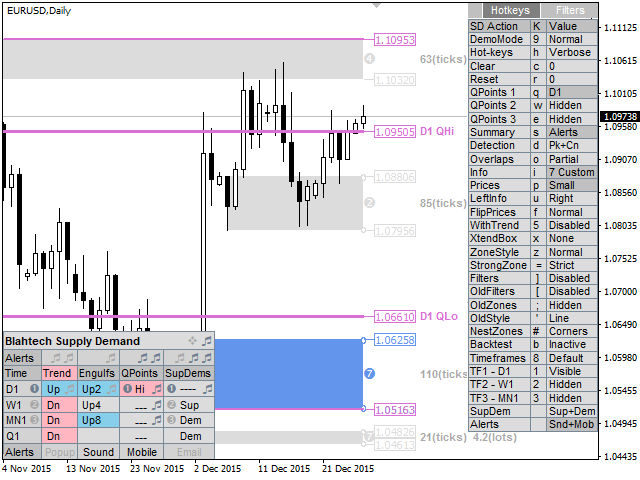
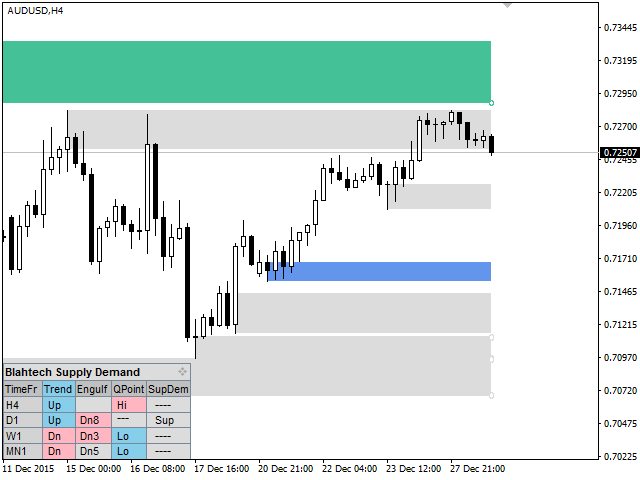
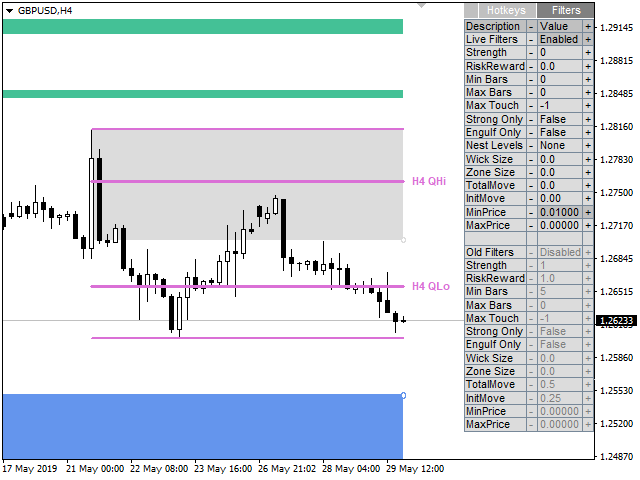
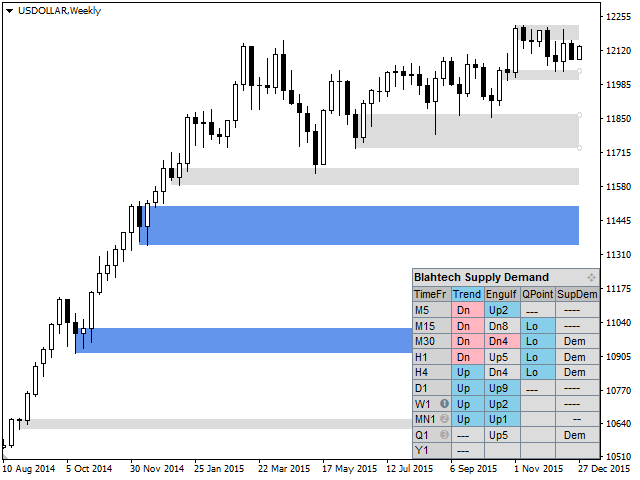
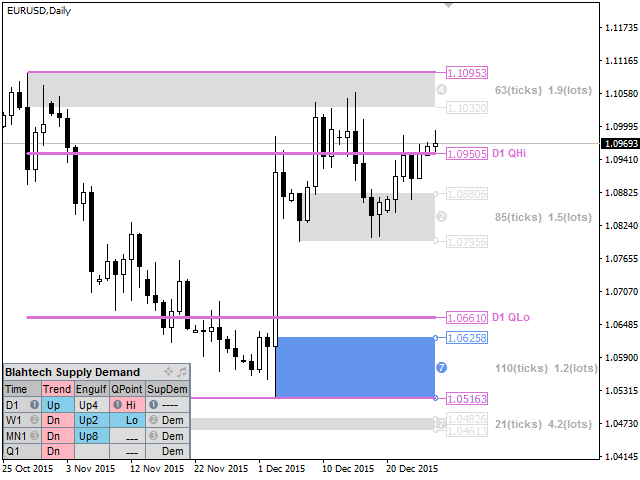
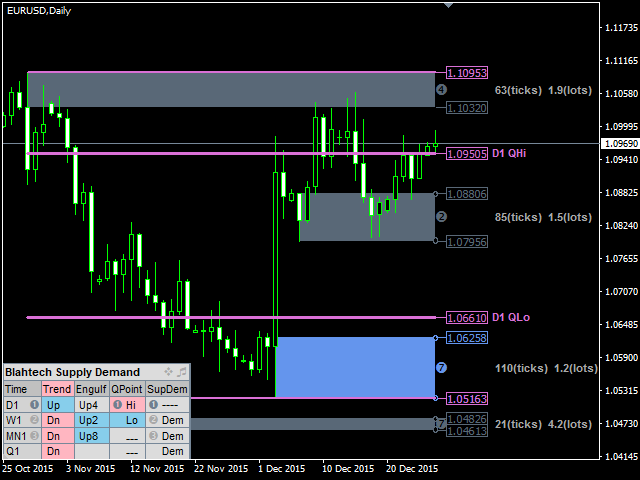
Blahtech Supply Demand indicator delivers functionality previously unavailable on any trading platform. This 4-in-1 indicator not only highlights the higher probability zones using a multi-criteria strength engine, but also combines it with multi-timeframe trend analysis, previously confirmed swings and engulfing detectors. Driven by an easy to use interface and innovative backtest mode this indicator is a must-have for all supply demand traders.

Links [ Install | Update | Documentation & Training ]


Feature Highlights

  • Multi-timeframe display
  • Backtest directly on the chart
  • Summary panel
  • Multi-timeframe trend analysis
  • Confirmed swings (High and Low QPoints)
  • Zone strength engine (seven criteria)

Feature Highlights continued...

  • Advanced level detection (peaks, consolidations, drop-base-drops)
  • Fast access hot-keys
  • Alerts
  • Engulfing detector
  • Visibility Filters
  • Old zones (broken levels or trend changes)
  • Highlight of Nested zones

Input Parameters

 - Download documentation using link above for details


    レビュー 20
    Zakarias
    48
    Zakarias 2021.11.03 13:05 
     

    Awesome, i like the idea and its running very very good

    David Cooper
    38
    David Cooper 2021.08.03 03:32 
     

    A leading indicator very well done. Remember to wait for price to come to you.

    YHW1022221880
    170
    YHW1022221880 2021.07.27 12:19 
     

    Good supply and demand indicators

    おすすめのプロダクト
    これは、キャンドルの終値を予測する指標です。 このインジケータは、主にD1チャートでの使用を目的としていますが. この指標は、従来の外国為替取引とバイナリオプション取引の両方に適しています。 インジケーターは、スタンドアロンのトレーディングシステムとして使用することも、既存のトレーディングシステムへの追加として機能させることもできます。 このインジケーターは、現在のキャンドルを分析し、キャンドル自体の内部の特定の強度係数と、前のキャンドルのパラメーターを計算します。 したがって、この指標は、市場の動きのさらなる方向性と現在のキャンドルの終値を予測します。 この方法のおかげで、この指標は、短期の日中取引だけでなく、中期および長期の取引にも適しています。 インジケーターを使用すると、市場の状況の分析中にインジケーターが生成する潜在的な信号の数を設定できます。 インジケーターの設定には、このための特別なパラメーターがあります。 また、インジケーターは、チャート上のメッセージの形式で、電子メールで、およびPUSH通知の形式で、新しい信号について通知することができます。 購入後は必ず私に書いて
    65 USD
    The Fibonacci Magic Pivot Levels is a powerful yet easy to use indicator . It continuously monitor s intra-day price action and uses complex algorithms to calculate and detect key support, resistance and pivot levels, using the D1 timeframe as a filter. The   Fibonacci Magic Pivot Levels is optimized for H4, H1, M30, M15, M5 & M1 timeframes and can be used on ALL Currencies, Indices, Commodities, and Cryptocurrency pairs . Trade with improved confidence and maximize your success rate. Benefits o
    99 USD
    Zig Zag 123 tells us when a reversal or continuation is more likely by looking at the shift in supply and demand. When this happens a signature pattern appears known as 123 (also known ABC) will often break out in direction of higher low or lower high. Stop loss and take profit levels have been added. There is a panel that shows the overall performance of your trades for if you was to use these stop loss and take profit levels.  We get alerted if a pattern 123 appears and also if the price
    30 USD
    "The trend is your friend" is one of the best known sayings in investing, because capturing large trendy price movements can be extremely profitable. However, trading with the trend is often easier said than done, because many indicators are based on price reversals not trends. These aren't very effective at identifying trendy periods, or predicting whether trends will continue. We developed the Trendiness Index to help address this problem by indicating the strength and direction of price trend
    49 USD
    The Point61 indicator is the result of many years of monitoring of price behavior of currency pairs and metals. It is not a secret, that in times of uncertainty, traders are looking for possible levels of support and resistance - the point, where price should stop its movement. There are 2 possible scenarios at these points: 1. Reverse (correction) to the opposite direction; 2. Breakthrough to continue movement. Very often these points are used to set stop orders - TakeProfit or
    249 USD
    TWO PAIRS SQUARE HEDGE METER INDICATOR Try this brilliant 2 pairs square indicator It draws a square wave of the relation between your two inputs symbols when square wave indicates -1 then it is very great opportunity to SELL pair1 and BUY Pair2 when square wave indicates +1 then it is very great opportunity to BUY pair1 and SELL Pair2 the inputs are : 2 pairs of symbols         then index value : i use 20 for M30 charts ( you can try other values : 40/50 for M15 , : 30 for M30 , : 10 for H1 ,
    10 USD
    インディケータは、フィボナッチのサポートとレジスタンスのレベルを自動的に計算してプロットします。これは、市場分析に最も効果的なツールの1つです。 計算では、選択した期間と時間枠の平均価格データが使用されます。この期間の最小値と最大値は、移動の開始と終了と見なされます。 フィボナッチレベルを使用すると、価格の動きが遅くなったり逆転したりする可能性のある潜在的な参照ポイントを確認できます。つまり、フィボナッチレベルは、さらなる動きを予測したり、ストップ注文や指値注文を行うために使用されます。 パラメーター: PartsShow-現在のバーから表示された履歴レベルの数 CalcPeriod-価格平均期間 SmoothingMethod-価格平均化方法(26オプション) TF-計算に使用される時間枠 LevelColor-レベルラインの色 ZeroLevelColor-ゼロレベルの色 ShowVerticalLine-レベル間の垂直線の表示を有効/無効にします VLineStyle-垂直線のスタイル VLineColor-垂直線の色 ShowInfo-レベルパーセンテージの値に関する情報をラベ
    30 USD
    Noize Absorption Index - is the manual trading system that measures the difference of pressure between bears forces and bulls forces. Green line - is a noize free index that showing curent situation. Zero value of index shows totally choppy/flat market.Values above zero level shows how powerfull bullish wave is and values below zero measures bearish forces.Up arrow appears on bearish market when it's ready to reverse, dn arrow appears on weak bullish market, as a result of reverse expectation. S
    199 USD
    This is a trend indicator without redrawing Developed instead of the binary options strategy (by the color of the Martingale candlestick) Also works well in forex trading When to open trades (binary options) A signal will appear in the place with a candle signaling the current candle It is recommended to open a deal for one candle of the current timeframe M1 and M5 When a blue dot appears, open a deal up When a red dot appears, open a trade down. How to open trades on Forex. When a signal is rec
    1 000 USD
    Super Gator
    Agustinus Biotamalo Lumbantoruan
    This indi shows the following 1. Supertrend 2. Alligator (Not a regular alligator) 3. ZigZag 4. Moving Average 5. Trend Continuation/Mini correction Signal (plotted in X) (See screenshots in green background color 6. Early Signal Detection (See screenshots in green background color) You may treat Alligator as the lagging indicator The leading indicator is the supertrend. The zig zag is based on the leading indicator where it gets plotted when the leading indicator got broken to the opposite.
    150 USD
    Trade with Gann on your side!! MASTER CIRCLE 360 CIRCLE CHART, originally created by Gann admitted that this is “The Mother of all charts”. It is one of the last studies that this great trader left for us. The numeric tab le is apparently quite simple like all the tables and is based on square numbers, the SQUARE OF 12 and is by evolution, one of the most important square numbers. Here we can find CYCLE, PRICE AND TIME thanks to angles and grades, to show past and future support and resistance.
    149.99 USD
    MT4インジケーター。 3つのレベルのフィボナッチサポートとレジスタンスレベルが自動的に描画されます。 彼らです: 月レベル:ミディアムオーキッド ウィークリーレベル:オレンジレッド デイラインレベル:ターコイズ 色はパラメータで調整できます。 MT5 Version: https://www.mql5.com/EN/market/product/80068 この指標は主に、より良いトレード分析のために将来のサポートとレジスタンスレベルを分析するために使用されます。 サポートレベルが何度も効果的にサポートされている場合、市場は以前の最高点を突破し、効果的なトレンドブレイクアウトは長くなります。 下降後、市場は何度も圧力レベルを超えることはできず、その後下降して以前の低価格を再び突破し、効果的なトレンドはショートポジションを突破します。 市場が過去の高値または安値の領域に達すると、チャートには2レベルのFibonacii線のみが描画され、インジケーターは市場の特定のスペースを待つ必要があるため、通常のレベルのプロンプトは表示されません。描画する前
    40 USD
    The indicator displays the data of the Stochastic oscillator from a higher timeframe on the chart. The main and signal lines are displayed in a separate window. The stepped response is not smoothed. The indicator is useful for practicing "manual" forex trading strategies, which use the data from several screens with different timeframes of a single symbol. The indicator uses the settings that are identical to the standard ones, and a drop-down list for selecting the timeframe. Indicator Parame
    30 USD
    BoxChart MT4
    Evgeny Shevtsov
    4.57 (7)
    The market is unfair if only because 10% of participants manage 90% of funds. An ordinary trader has slim changes to stand against these "vultures". This problem can be solved. You just need to be among these 10%, learn to predict their intentions and move with them. Volume is the only preemptive factor that faultlessly works on any timeframe and symbol. First, the volume appears and is accumulated, and only then the price moves. The price moves from one volume to another. Areas of volume accumu
    33 USD
    Introduction to Chart Pattern MT Chart Pattern MT is a chart pattern scanner to detect the triangle pattern, falling wedge pattern, rising wedge pattern, channel pattern and so on. Chart Pattern MT uses highly sophisticated chart pattern detection algorithm. However, we have designed it in the easy to use with intuitive user interface. Chart Pattern MT will show all the patterns in your chart in the most efficient format for your trading. You do not have to do tedious manual pattern detection an
    180 USD
    Laguerre SuperTrend Clouds adds an Adaptive Laguerre averaging algorithm and alerts to the widely popular SuperTrend indicator. As the name suggests, Laguerre SuperTrend Clouds (LSC) is a trending indicator which works best in trendy (not choppy) markets. The SuperTrend is an extremely popular indicator for intraday and daily trading, and can be used on any timeframe. Incorporating Laguerre's equation to this can facilitate more robust trend detection and smoother filters. The LSC uses the impro
    30 USD
    The Th3Eng PipFinite indicator is based on a very excellent analysis of the right trend direction with perfect custom algorithms. It show the true direction and the best point to start trading. With StopLoss point and Three Take Profit points. Also it show the right pivot of the price and small points to order to replace the dynamic support and resistance channel, Which surrounds the price. And Finally it draws a very helpful Box on the left side on the chart includes (take profits and Stop loss
    89 USD
    Accuracy of correct predictions 83%! This indicator was tested on the basis of real statistics for all market indicators according to indicators for 3 months of trading. 83% of correct trade forecasts for usd / jpy on the m30 time frame were received on our statistics! if you have any questions, please contact us in private messages or in discussions under this indicator and we will figure it out and help any questions will arise personal messages or in discussions under this indicator As soon
    100 USD
    Buy Sell Strength (BSS) (For MT4 ) is a stock technical analysis oscillator, showing bullish (buy) and bearish (sell) strength by comparing upward and downward stock momentum movements. The BSS is easy to interpret: 1. When BBS Histogram is moving Upward, it is bullish, when it is Downward, it is bearish. 2. When the Orange rectangle is changing shorter and shorter, it shows the trend will change direction. when it dispears, it shows Buy or Sell signals. 3. BSS is considered overbought whe
    30 USD
    インディケータは現在のクオートを作成し、これを過去のものと比較して、これに基づいて価格変動予測を行います。インジケータには、目的の日付にすばやく移動するためのテキスト フィールドがあります。 オプション: シンボル - インジケーターが表示するシンボルの選択; SymbolPeriod - 指標がデータを取る期間の選択; IndicatorColor - インジケータの色; HorisontalShift - 指定されたバー数だけインディケータによって描画されたクオートのシフト; Inverse - true は引用符を逆にします。false - 元のビュー。 ChartVerticalShiftStep - チャートを垂直方向にシフトします (キーボードの上下矢印)。 次は日付を入力できるテキストフィールドの設定で、「Enter」を押すとすぐにジャンプできます。
    55 USD
    This unique multi-currency strategy simultaneously determines the strength of trends and market entry points, visualizing this using histograms on the chart. The indicator is optimally adapted for trading on the timeframes М5, М15, М30, Н1. For the convenience of users, the indicator renders the entry point (in the form of an arrow), recommended take profit levels (TP1, TP2 with text labels) and the recommended Stop Loss level. The take profit levels (TP1, TP2) are automatically calculated for
    79 USD
    An indicator of pattern #31 ("Long Island") from Encyclopedia of Chart Patterns by Thomas N. Bulkowski. The second gap is in the opposite direction. Parameters: Alerts - show alert when an arrow appears   Push - send a push notification when an arrow appears (requires configuration in the terminal) GapSize - minimum gap size in points ArrowType - a symbol from 1 to 17 ArrowVShift - vertical shift of arrows in points   ShowLevels - show levels ColUp - color of an upward line ColDn - color of
    30 USD
    マーケットシェーバー   マーケットスカルパー このインジケーターはRPTradeProSolutionsシステムの一部です。 Market Scalperは、プライスアクション、ダイナミックサポート、レジスタンスを使用した毎日のトレンド指標です。 誰でも使用できるように設計されており、トレーディングの初心者でも使用できます。 決して塗り直さないでください。 表示は近いものから近いものへと示されます。 単独で使用するように設計されているため、他のインジケーターは必要ありません。 明確でシンプルな表示を提供します どのように機能しますか MarketShaverはDualTimeFramesシステムを使用しています。 主な傾向はより高いTFによって取られますが、より速いものは取引を閉じるために使用されます トレードは1つずつ示され、同時に2つのトレードが存在することはありません。 マーケットシェーバーは次のことを示しています。 いつ取引するか いつそれを止めるか、利益か損失か。 貿易報酬 適切な期間終了TFを設定するのに役立つ多くの統計 マーケットシェーバーは動作します
    240 USD
    Fibonacci retracements is a popular instrument used by technical analysts to determine support and resistance areas. In technical analysis, this tool is created by taking two extreme points (usually a peak and a minimum) on the chart and dividing the vertical distance by the key Fibonacci coefficients equal to 23.6%, 38.2%, 50%, 61.8%, and 100%. Once these levels are defined, horizontal lines are then drawn and used to determine possible support and resistance levels. When using the Auto Fibonac
    30 USD
    The indicator analyzes the change in the minimum and maximum prices of the previous bars fixing the entrance of the big players. If the change (delta) increases, a signal is displayed on the graph in the form of an arrow. At the same time, virtual trade on history is carried out. In case of a repeat of the signal, the positions are increased (refilling). Thus the lot of positions can differ. The results of virtual trading in the form of losses / losses, profitability, drawdown and transaction li
    30 USD
    The Supply and Demand Zones indicator is one of the best tools we have ever made. This great tool automatically draws supply and demand zones, the best places for opening and closing positions. It has many advanced features such as multi timeframe zones support, displaying the width of zones, alert notifications for retouched zones, and much more. Because of market fractality, this indicator can be used for any kind of trading. Whether you are a positional, swing, or intraday trader does not ma
    99 USD
    For sure, this indicator has become very popular amongst traders. Through coding this indicator will give you the most accurate levels possible for your trading analysis. We have also added in the ability for you to receive alerts when the price breaks above or below a Support or Resistance lines! HOW TO USE The red rectangles represent your resistance/supply zone. The green rectangles represent your support/demand zone.  BONUS FEATURES We coded this indicator with the ability to switch between
    197 USD
    Mean Reversion Supply Demand Indicator Mean Reversion Supply Demand is the indicator to detect the important supply demand zone in your chart. The concept of supply demand trading relies on the quantity mismatching between buying and selling volumes in the financial market. Typically, supply demand zone serves to predict the turning point. The wave pattern, for any supply demand zone to work as an successful trade, looks like the price must touch the base zone, move away and then return to zone
    80 USD
    Monster Harmonics Indicator is a harmonic pattern indicator. It recognizes Gartley, Bat, Crab, Butterfly, Cypher, White Swan, Black Swan, Shark and several other patterns. Projected patterns that are not yet completed are recognized, too. Monster even shows the PRZ (Potential Reversal Zone). Users can add their own user defined patterns to Monster. Besides the current pattern, Monster also shows all patterns in the symbols history. Monster will provide alerts for developing patterns. Introduced
    79 USD
    このプロダクトを購入した人は以下も購入しています
    今なら $147 ($602 オフ) - 無制限のアカウント - 次のアップデートで価格が上がります - 5 つ星のレビューを残すことを忘れないでください RelicusRoad ユーザー マニュアル + トレーニング ビデオ + プライベート Discord グループへのアクセス + VIP ステータス 市場の新しい見方 RelicusRoad は、外国為替、先物、暗号通貨、株式、および指数の世界で最も強力な取引インジケーターであり、トレーダーに収益を維持するために必要なすべての情報とツールを提供します。初心者から上級者まで、すべてのトレーダーが成功するためのテクニカル分析と取引計画を提供します。これは、将来の市場を予測するのに十分な情報を提供する重要な取引指標です。意味をなさないチャート上のいくつかの異なる指標ではなく、完全な解決策を信じています.これは、信号、矢印 + 価格アクション情報を表示するオールインワンのインジケーターで、他に類を見ない非常に正確です。 強力な AI に基づいて、RelicusRoad は不足している情報とツールを提供して、あなたを教育し、
    147 USD
    現在26%オフ 初心者やエキスパートトレーダーに最適なソリューション! このインジケーターは、独自の機能と新しい計算式を取り入れた、ユニークで高品質、かつ手頃な価格のトレーディングツールです。たった1枚のチャートで28の為替ペアの通貨強度を読み取ることができます。新しいトレンドやスキャルピングチャンスの引き金となるポイントを正確に特定することができるので、あなたのトレードがどのように改善されるか想像してみてください。 ユーザーマニュアルはこちら  https://www.mql5.com/en/blogs/post/697384 これが最初の1本、オリジナルだ! 価値のないクローンを買わないでください。 特別な サブウィンドウの矢印で強い通貨の勢いを表示 GAPがあなたのトレードを導く! 基準通貨や気配値が売られすぎ・買われすぎのゾーン(外相フィボナッチレベル)にあるとき、個別チャートのメインウィンドウに警告表示。 通貨がレンジの外側から反落した場合、プルバック/リバーサルのアラート。 クロスパターンの特別なアラート 複数の時間枠を選択可能で、トレンドを素早く
    148 USD
    Advanced Supply Demand
    Bernhard Schweigert
    4.93 (295)
    現在33%オフ 初心者にもエキスパートトレーダーにも最適なソリューション このインジケーターは独自の機能と新しい公式を多数内蔵しており、ユニークで高品質かつ手頃な取引ツールです。このアップデートでは、2つの時間枠ゾーンを表示できるようになります。より長いTFだけでなく、チャートTFとより長いTF(ネストゾーンを表示)の両方を表示できます。すべてのSupply Demandトレーダーの皆さんのお気に召すはずです。:) 重要情報の公開 Advanced Supply Demandの可能性を最大化するには、 https://www.mql5.com/ja/blogs/post/720245 にアクセスしてください。   エントリーまたはターゲットの正確なトリガーポイントを正確に特定できれば取引がどのように改善されるか想像してみてください。新しい基盤となるアルゴリズムに基づいて構築されているため、買い手と売り手の間の潜在的な不均衡をさらに簡単に特定できます。これは、最も強い需要と供給のゾーンと、過去のパフォーマンス(古いゾーンを表示)がグラフィカルに表現されるためです。これらの機能は、最適
    148 USD
    現在20%OFF! 初心者やエキスパートトレーダーのためのベストソリューション! このダッシュボードソフトウェアは、28の通貨ペアで動作しています。それは私達の主要な指標(高度な通貨の強さ28と高度な通貨インパルス)の2に基づいています。それは全体の外国為替市場の大きい概観を与えます。それは、すべての(9)時間枠で28の外国為替ペアのための高度な通貨の強さの値、通貨の動きの速度と信号を示しています。チャート上で1つのインディケータを使用して市場全体を観察し、トレンドやスキャルピングの機会をピンポイントで見つけることができたら、あなたのトレードがどのように改善されるか想像してみてください。 このインディケータには、強い通貨と弱い通貨の識別、潜在的な取引の識別と確認がより簡単になるような機能が搭載されています。このインディケータは、通貨の強さや弱さが増加しているか減少しているか、また、すべての時間枠でどのように機能しているかをグラフィカルに表示します。 新機能として、現在の市場環境の変化に適応するダイナミックなマーケットフィボナッチレベルが追加され、すでに当社のAdvan
    199 USD
    これはMT4のインジケーターで、再描画なしで取引に参入するための正確なシグナルを提供します。 外国為替、暗号通貨、金属、株式、インデックスなど、あらゆる金融資産に適用できます。かなり正確な見積もりを提供し、取引を開始して終了するのに最適な時期を教えてくれます。1つのシグナルを処理しただけでインジケーターの元が取れた例の 動画 (6:22)をご覧ください。Entry PointsPro インジケーターの助けを借りたほとんどのトレーダーの最初の1週間の結果が改善しています。 Telegramグループ に登録してください。Entry Points Proインジケーターのメリットは次の通りです。 再描画のないエントリーシグナル 再描画されるインジケーターでは一度表示されたシグナルが削除されて大きな金銭的損失につながることがありますが、これと異なり、表示されて確認されたシグナルは消えることがありません。 エラーなしの取引開始 インジケーターアルゴリズムによって取引を開始する(資産を売買する)理想的な瞬間を見つけることができます。それを使用するすべてのトレーダーの成功率が向上します。
    125 USD
    Ultimate Sniper Dashboard
    Hispraise Chinedum Abraham
    4.65 (23)
    299ドルで割引中! 今後値上げの可能性あり! 下の説明を読んでください! 究極のスナイパーダッシュボードのための最高のエントリーシステム。究極のダイナミックレベル。(私の製品をチェックしてください) 究極のスナイパーダッシュボードはMT4多通貨テスト制限のため、ライブマーケットでのみ作動します。 究極のスナイパーダッシュボードをご紹介します。HA-Sniper、MA-Sniper、その他多くの特別なモードが含まれる最高の製品です。究極のスナイパーダッシュボードは絶対的な獣です! 初心者やエキスパートトレーダーにとって最高のソリューションです。もう二度と動きを見逃さない! シンプルさとピップを愛するトレーダーのために、特別な製品をご用意しました。シンプルでありながら、ダッシュボードは複数のカスタムアルゴリズムに基づき28の通貨ペアを監視し、すべての作業を行います。たった一つのチャートで、プロのように市場を読み解くことができます。もし、為替ペアが動き出したときに、その方向性を正確に特定することができれば、あなたの取引はどれほど改善されることでしょう。   当社のシ
    299 USD
    このインディケータは、当社の2つの製品 Advanced Currency IMPULSE with ALERT  +   Currency Strength Exotics . のスーパーコンビネーションです。 このインジケーターは全ての時間枠で作動し、8つの主要通貨と1つのシンボルの強弱のインパルスをグラフで表示します。 このインジケータは、金、エキゾチックペア、商品、インデックス、先物など、あらゆるシンボルの通貨強度の加速度を表示することに特化されています。金、銀、原油、DAX、US30、MXN、TRY、CNHなどの通貨強度の加速度(インパルスまたは速度)を表示するために、任意のシンボルを9行目に追加できる、この種の最初のものです。 新しいアルゴリズムに基づいて構築され、潜在的な取引の特定と確認がさらに容易になりました。これは、通貨の強さや弱さが加速しているかどうかをグラフィカルに表示し、その加速の速度を測定するためです。加速すると物事は明らかに速く進みますが、これはFX市場でも同じです。つまり、反対方向に加速している通貨をペアリングすれば、潜在的に利益を生む取
    149 USD
    現在20%OFF! 初心者やエキスパートトレーダーに最適なソリューションです。 このインディケータは、エキゾチックペア・コモディティ・インデックス・先物など、あらゆるシンボルの通貨の強さを表示することに特化したインディケータです。金、銀、原油、DAX、US30、MXN、TRY、CNHなどの通貨の強さを表示するために、9行目にどのシンボルでも追加することができます。独自の機能を多数搭載し、新しい計算式を採用したため、ユニークで高品質、かつ手頃な価格のトレーディングツールとなっています。新しいトレンドやスキャルピングチャンスのトリガーポイントを正確に把握することができるため、あなたのトレードがどのように改善されるか想像してみてください。 ユーザーマニュアル:ここをクリック   https://www.mql5.com/en/blogs/post/708876 すべての時間枠に対応します。あなたはすぐにトレンドを見ることができるようになります! 新しいアルゴリズムに基づいて設計されているため、潜在的な取引の特定と確認がより簡単になります。これは、8つの主要通貨と1つのシンボ
    128 USD
    Ultimate Dynamic Levels
    Hispraise Chinedum Abraham
    4.88 (8)
    現在、ホリデーディスカウントで399ドル! 今後値上がりする可能性があります。以下の説明をお読みください。 Ultimate Dynamic Levelsの紹介 - Ultimate Sniper DashboardのBESTエントリーインジケーター! 極めてローリスクなタイムリーエントリーと高RR!!! アルティメットスナイパーダッシュボードはこちら。 初心者はもちろん、プロのトレーダーにとっても最も重要な能力は、いつどこで相場が転換するかを正確に判断し、いかに安全に参入し、利益を得て退場するかを見極めることです。 アルティメット・ダイナミック・レベルズ・インディケーターは、相場が転換する可能性が最も高い場所を簡単に教えてくれるので、極めてローリスクなトレードを自信を持って行うことができ、同時にチャートをクリーンでシンプルに保ちながら、$$$を稼ぐことができるのです! アルティメット・ダイナミック・レベルズ・インディケーターは、複数の時間枠で重要な隠れたレベルを一度に見つけるユニークで強力なアルゴリズムを持っています。また、他の典型的なSRインジケーターのように、レベ
    199 USD
    A. A2SR とは何ですか ?   * 先行テクニカル指標です (塗り直しなし、ラグなし)。 -- ガイダンス : -- https://www.mql5.com/en/blogs/post/734748/page4#comment_16532516 -- そして https://www.mql5.com/en/users/yohana/blog A2SR には、サポート (需要) とレジスタンス (供給) のレベルを決定する特別な手法があります。 ネットで見かける通常の方法とは異なり、A2SR は実際の SR レベルを決定する独自のコンセプトを持っています。 元の手法はインターネットから取得されたものではなく、インターネット上で公開されたこともありません。 A2SR は、取引スタイルに応じて SR レベルを自動選択します。 時間枠を変更しても、SR レベルはその位置にとどまります。 実際のSRは、使用する時間枠から取得されるわけではないため. A2SR には、取引のための完全な手段があります 。 実際のサポート (需要) とレジスタンス (供給) の真のコンセプト。
    386 USD
    現在20%OFF! このダッシュボードは、複数のシンボルと最大9つのタイムフレームで動作するソフトウェアの非常に強力な部分です。 このソフトは、弊社のメインインジケーター(ベストレビュー:Advanced Supply Demand)をベースにしています。    Advanced Supply Demand ダッシュボードは、素晴らしい概要を提供します。それは示しています。  ゾーン強度評価を含むフィルタリングされた需給値。 ゾーン内/ゾーンへのPips距離。 ネストされたゾーンがハイライトされます。 選択されたシンボルの4種類のアラートを全ての(9)時間枠で提供します。 それはあなたの個人的なニーズに合わせて高度に設定可能です。 あなたの利益! すべてのトレーダーにとって最も重要な質問です。 市場に参入するのに最適なレベルはどこか? 成功のチャンスとリスク/リターンを得るために、強力な供給/需要ゾーン内またはその近くで取引を開始します。 損切りの最適な位置はどこですか? 最も安全なのは、強力な供給/需要ゾーンの下/上にストップを置くことで
    199 USD
    MetaBands M4
    Vahidreza Heidar Gholami
    5 (1)
    MetaBandsは、強力でユニークなアルゴリズムを使用してチャンネルを描画し、トレンドを検出して、トレーダーに取引の入出ポイントを提供することができます。チャンネル指標に加えて、強力なトレンド指標でもあります。入力パラメータを使用して新しいチャンネルを作成するために、異なるタイプのチャンネルを統合することができます。MetaBandsは、市場のイベントについてユーザーに通知するために、すべてのタイプのアラートを使用します。 特徴 ほとんどのチャンネルアルゴリズムをサポート 強力なトレンド検出アルゴリズム 異なるタイプのチャンネルを統合する能力 マルチタイムフレームおよびマルチカレンシー(シグナルマトリックス) すべてのタイプのアラート機能(サウンド、画面フラッシャー、プッシュ通知、メール、ポップアップ、矢印) 再描画しない トレンド検出 MetaBandsは、チャネル内を振動する青いラインを使用してトレンドを検出します。ラインがチャネルの上部バンドに達すると、下降トレンドの開始を示し、下部バンドに達すると上昇トレンドの開始を示します。青いラインが中心ラインに近づくと、市場はコンソ
    129 USD
    Attention! Friends, since there have been many scammers on the Internet recently selling indicators called ForexGump, we decided to warn you that only on our page is the LICENSE AUTHOR'S VERSION of the INDICATOR sold! We do not sell this indicator on other sites at a price lower than this! All indicators are sold cheaper - fakes! And even more often sold demo versions that stop working in a week! Therefore, in order not to risk your money, buy this indicator only on this site! Forex Gump Scalpin
    147 USD
    これはほぼ間違いなく、MetaTraderプラットフォームで見つけることができる最も完全な調和価格形成自動認識インジケーターです。 19種類のパターンを検出し、フィボナッチプロジェクションをあなたと同じように真剣に受け止め、潜在的逆転ゾーン(PRZ)を表示し、適切なストップロスとテイクプロフィットレベルを見つけます。 [ インストールガイド | 更新ガイド | トラブルシューティング | よくある質問 | すべての製品 ] 19の異なる調和価格形成を検出します プライマリ、派生および補完フィボナッチ投影(PRZ)をプロットします 過去の価格行動を評価し、過去のすべてのパターンを表示します この指標は、独自の品質とパフォーマンスを分析します 適切なストップロスとテイクプロフィットのレベルを表示します ブレイクアウトを使用して適切な取引を通知します すべてのパターン比をグラフにプロットします 電子メール/音声/視覚アラートを実装します スコット・M・カーニーの本に着想を得て、この指標は最も純粋で急を要するトレーダーのニーズを満たすように設計されています。ただし、トレードを
    249 USD
    An extremely convenient indicator that truly makes the process of making money on the exchange easy. It is based on the scientifically rigorous theory of the market developed by the author, the beginning of which is presented here .               The indicator calculates the most probable price movement trajectory and displays it on the chart. Based on the predicted price movement trajectory, the indicator calculates the direction of the position and the position of the take profit
    139 USD
    MTF Supply Demand Zones
    Georgios Kalomoiropoulos
    4.81 (21)
    次世代の自動化された需要と供給のゾーン。どのチャートでも機能する新しい革新的なアルゴリズム。すべてのゾーンは、市場の価格行動に従って動的に作成されています。 2種類のアラート --> 1) 価格がゾーンに達したとき 2) 新しいゾーンが形成されたとき もう 1 つの役に立たない指標はありません。実績のある完全な取引戦略を手に入れることができます。     新機能:     価格が需給ゾーンに達したときにアラートを出す     新しい需給ゾーンが作成されたときにアラートを発します     プッシュ通知アラート     ピップ単位のゾーン幅ラベル     MTF のもう 1 つのタイムフレーム。したがって、現在より 2 時間足高いのではなく、現在より 3 時間足し上に見えるようになります。     アラート/ゾーン/MTF 機能を有効/無効にするボタン あなたが得る利点:     取引から感情を取り除きます。     取引エントリをオブジェクト化します。     確率の高いセットアップで利益
    149 USD
    発見が困難で頻度が少ないため、分岐は最も信頼できる取引シナリオの1つです。このインジケーターは、お気に入りのオシレーターを使用して、通常の隠れた分岐点を自動的に見つけてスキャンします。 [ インストールガイド | 更新ガイド | トラブルシューティング | よくある質問 | すべての製品 ] 取引が簡単 通常の隠れた発散を見つけます 多くのよく知られている発振器をサポート ブレイクアウトに基づいて取引シグナルを実装します 適切なストップロスおよび利益レベルを表示します 設定可能なオシレーターパラメーター カスタマイズ可能な色とサイズ バー単位でサイズ別に分岐をフィルタリング パフォーマンス統計を実装します 電子メール/音声/視覚アラートを実装します 幅広い市場の見通しを提供するために、異なるオシレーターを使用して、干渉なしで同じチャートにインジケーターを何度もロードできます。このインジケーターは、次のオシレーターをサポートしています。 RSI CCI MACD オスマ 確率的 勢い 素晴らしい発振器 加速器発振器 ウィリアムズパーセントレンジ 相対活力指数 特に外国為替市
    175 USD
    Trade system "PAX Multi TMA/HMA 8" it is a ready-made trading system for trading on any instrument and any timeframe. An experienced trader on one instrument can get a profit from 100% to 400% per day . Completely ready for manual trading and use in robots. Not redrawn. It is convenient to work on timeframes M30, H1, H4. Tested on metals, currency pairs, oil, international stocks, Russian stocks, cryptocurrencies, monetary and cryptocurrency indices. What the trading system cons
    144 USD
    Please send me Direct message on MQL5 CHAT after purchasing the Indicator for Training and Installation Support There are some additional files that is important to use with the Indicator . So be sure to contact me after purchasing the Indicator So that I can add you for training and support . If you find any difficulty with installation then send me Direct message here So that I can connect with you via Anydesk or Teamview for the product installation. " Smart Order Block Indicator " to find
    249 USD
    Robot Choppiness
    Diego Mauricio Padilla Mendez
    5 (1)
    Choppines ロボットは MT4 インジケーター フォルダーにインジケーターとしてロードされます 5 分のローソク足時間枠を使用することをお勧めします。推奨されるロボットの有効期限は 5 分です。 ロボットは、MT2、MX2、PRICEPRO プラットフォームに信号を送信するように構成できます。信号を送信するには、使用するプラットフォームのコネクタ プログラムを使用する必要があります。 コネクタに取り付けるには、次の手順を実行します (MT2 プラットフォーム コネクタの構成を説明する画像が添付されています)。 1.- MT4 プラットフォームに任意の通貨ペアをロードします 2.- セイルを M5 のタイミングで配置します。 3.- ファイル Robot-Choppiness.ex4 をロードするか、画面上で開いている通貨ペアにドラッグします。 4.- MT2 コネクタ (MX2、または PRICEPRO、一度に 1 つずつ) を画面にロードし、ファイル名、シグナル名、買いバッファ (2)、売りバッファ (3)​​ を設定し、ロボットの有効期限 =
    599 USD
    Of all the four principle capital markets, the world of foreign exchange trading is the most complex and most difficult to master, unless of course you have the right tools! The reason for this complexity is not hard to understand. First currencies are traded in pairs. Each position is a judgment of the forces driving two independent markets. If the GBP/USD for example is bullish, is this being driven by strength in the pound, or weakness in the US dollar. Imagine if we had to do the same thing
    197 USD
    Price Action Entry Alerts
    Stephen Sanjeeve Sahayam
    5 (2)
    このインジケーターは、売買圧力についてすべてのバーをスクリーニングし、最大量の 4 種類のローソク足パターンを特定します。次に、これらのローソク足はいくつかの線形フィルターを使用してフィルター処理され、買いまたは売りのシグナルが表示されます。シグナルは、より高い時間枠の方向と組み合わせて、取引量が多い時間帯に取引される場合に最も効果的に機能します。すべてのフィルターはカスタマイズ可能で、独立して動作します。ボタンをクリックするだけで単一方向の信号を表示できます。 シグナルはあらゆる入力方法で機能します。価格アクションまたはインジケーターとあらゆる取引スタイル。スキャルピング、日中取引、またはスイング取引。 特徴: 信号は再描画されません。 飲み込みキャンドル、拒否キャンドル、拡張範囲キャンドル、ピンバーを識別します。 有効なシグナルごとに複数のエントリー、ストップロス、複数のテイクプロフィットレベルを表示します。 大容量セッションでフィルタリングします。 サポート/レジスタンスレベルとローソク足の構造でフィルターします。 MACD ヒストグラムでフィルターします。 クリーンス
    145 USD
    Blitz Scalperは、主要な通貨ペアと共に動作するように最適化された複数のタイムフレームで動作する、価格アクションベースのスキャルピングインジケーターです。 Blitz Scalperインジケーターは、価格アクション、サポート・レジスタンス、トレンド分析などの強力なトレード戦略の組み合わせに基づいています。これらの要因を分析することで、高確率のトレード機会を特定し、正確な買い・売りシグナルを提供することができます。 Blitzインジケーターの主要な特徴の1つは、使いやすいインターフェースです。トレーダーは、チャート上の買い・売りシグナル、トレンドの方向、シグナルの強度をすばやく簡単に確認することができます。 Blitz Scalperの主な特徴のいくつかには、トレーダーが自分のトレードスタイルや好みに合わせてインジケーターを調整できるカスタマイズ可能な設定が含まれています。 Blitz Scalperは100%ノンリペイントです。 Forex市場で利益を上げるためのシンプルでパワフルなスキャルピングインジケーターを探している場合は、Blitzが最適なツールです。今すぐお試しく
    250 USD
    THEQ Volumen
    Luis Alberto Vazquez Carpio
    5 (1)
    THEQ Volumeは、正確なボリュームオシレーターを表示します。次のトレンドまたは起こりうるトレンド変化を取引するために使用できます。 THEQ Volumeには、THEQ Volume Arrows、シグナルとアラートを備えたインジケーター、および実際の/デモ、バックテストと最適化、または独自の戦略を作成するためのTHEQ VolumeEAも含まれています。 追加のインジケーターとロボットEAは、支払い後に別々に出荷されます。 THEQボリュームは再描画せず、ラグがなく、キャンドルが閉じても信号が消えることはありません。 また、準備が整い、市場に迅速に参入するための事前シグナルもあります。 マニュアルと最適な設定インジケーターとEAを使用して、必要なときにいつでもサポートとヘルプを利用できます。新しいバージョンは常に最初の支払いに含まれています。 チップ: -EURUSDペアとM5TFの過去5年間を最も正確な方法(ティック)でバックテストして、購入したものがスクリーンショットやビデオと同じであることを確認します。 -EAが履歴データを読み取らないことを確認します。 -デモアカウン
    495 USD
    The main purpose of the All-in-One Trade Indicator (AOTI) is determining the daily targets for EURUSD, EURJPY, GBPUSD, USDCHF, EURGBP, EURCAD, EURAUD, AUDJPY, GBPAUD, GBPCAD, GBPCHF, and GBPJPY. All other modules work on any instruments. The indicator includes many features: Double Channel trend direction, Price channel, MA Bands, Fibo levels, Climax Bar detection, etc. The indicator is designed to simplify the analysis of the market, and it is based on several trading strategies that I apply to
    148 USD
    Take Your Trading Experience To the Next Level ! and get the exclusive TFSR-Analyzer for free !    So you have all these outstanding features  on up to 20 symbols and all timeframes in a smart and clear Design. Correct identification of the trends  in stock investments are pivotal and TrendFollowerSR ensures this perspective while displaying the correct trend on multiply timeframes to help you go long way as much as possible. The latest technology of the Indicator enables to track whether if
    149 USD
    TPA True Price Action indicator reveals the true price action of the market makers through 100% non-repainting signals (except early signals mode) strictly at the close of a candle! TPA shows entries and re-entries, every time the bulls are definitely stronger than the bears and vice versa. Not to confuse with red/green candles. The shift of power gets confirmed at the earliest stage and is ONE exit strategy of several. There are available now two free parts of the TPA User Guide for our custo
    168 USD
    Allows multiple indicators to be combined into a single indicator, both visually and in terms of an alert. Indicators can include standard indicators, e.g. RSI, CCI, etc., and also Custom Indicators, even those purchased through Market, or where just have the ex4 file. An early alert is provided, say when 4 out 5 indicators have lined up, and a confirmed alert when all are in agreement. A‌lso features a statistics panel reporting the success of the combined indicator by examining the current cha
    149 USD
    A new generation PROgressive indicator from INFINITY. Predictor PRO uses its own entry and exit calculation strategy. Indicator without redrawing signals! This is very important for real trading. The indicator can be used for any currency pairs, metals, cryptocurrencies or indices. The best time of the H1 chart. Unlike other indicators, Predictor PRO shows shows the Buy/Sell entry point and the Close exit point. Calculating the profit of all signals in points on the panel helps to choose th
    125 USD
    MT5 Version TTM Squeeze Momentum TTM Squeeze Momentum is an enhanced indicator ideal for recognizing consolidation periods in the market and the start of the next explosive move. This improved version is a volatility indicator based on John Carter's "TTM Squeeze" in which the histogram is based on a linear regression rather than a simple momentum indicator. Red dots on the middle line indicate that the market has entered a "Squeeze" zone or consolidation period, indicated in this enhanced vers
    129 USD
    作者のその他のプロダクト
    Supply Demand uses previous price action to identify potential imbalances between buyers and sellers. The key is to identify the better odds zones, not just the untouched ones. Blahtech Supply Demand indicator delivers functionality previously unavailable on any trading platform. This 4-in-1 indicator not only highlights the higher probability zones using a multi-criteria strength engine, but also combines it with multi-timeframe trend analysis, previously confirmed swings and engulfing detecto
    99 USD
    Blahtech VWAP - Volume Weighted Average Price (VWAP) is the ratio of price to total volume. It provides an average price over a specified time interval.  Links [  Install  |  Update  |  Documentation   ] Feature Highlights Configurable VWAP Line Sessions, intervals, anchored or continuous Previous day settlement line Standard Deviation bands Alerts at bar close or real time Automatic Broker or Tick volumes Significantly reduced CPU usage Input Parameters Max Bars   - Restrict the number of
    49 USD
    Market Profile defines a number of day types that can help the trader to determine market behaviour. A key feature is the Value Area, representing the range of price action where 70% of trading took place. Understanding the Value Area can give traders valuable insight into market direction and establish the higher odds trade. It is an excellent addition to any system you may be using. Blahtech Limited presents their Market Profile indicator for the MetaTrader community. Inspired by Jim Dalton’s
    99 USD
    Blahtech VWAP
    Blahtech Limited
    5 (1)
    Blahtech VWAP - Volume Weighted Average Price (VWAP) is the ratio of price to total volume. It provides an average price over a specified time interval.  Links [  Install  |  Update  |  Documentation   ] Feature Highlights Configurable VWAP Line Sessions, intervals, anchored or continuous Previous day settlement line Standard Deviation bands Alerts at bar close or real time Automatic Broker or Tick volumes Significantly reduced CPU usage Input Parameters Max Bars   - Restrict the number of
    49 USD
    Market Profile defines a number of day types that can help the trader to determine market behaviour. A key feature is the Value Area, representing the range of price action where 70% of trading took place. Understanding the Value Area can give traders valuable insight into market direction and establish the higher odds trade. It is an excellent addition to any system you may be using. Blahtech Limited presents their Market Profile indicator for the MetaTrader community. Inspired by Jim Dalton’s
    99 USD
    Over 100,000 users on MT4 and MT5 Blahtech Candle Timer displays the remaining time before the current bar closes and a new bar forms. It can be used for time management Links [  Install  |  Update  |  Training  ] Feature Highlights The only candle timer on MT4 with no stutter and no lag S electable Location Tracks server time not local time Multiple colour Schemes Configurable Text Customisable alerts and messages Optimised to reduce CPU usage Input Parameters Text Location   - Beside / Upper
    FREE
    Over 100,000 users on MT4 and MT5 Blahtech Candle Timer displays the remaining time before the current bar closes and a new bar forms. It can be used for time management Links [  Install  |  Update  |  Training  ] Feature Highlights The only candle timer on MT5 with no stutter and no lag S electable Location Tracks server time not local time Multiple colour Schemes Configurable Text Customisable alerts and messages Optimised to reduce CPU usage Input Parameters Text Location - Beside / Upper L
    FREE
    Blahtech Daily Range indicator displays the average daily range alongside the individual session ranges. Using the daily open price as a reference the indicator shows fixed range and dynamic range targets as lines on the charts. These lines clearly show when the average range has been exhausted. Daily and session ranges can be useful for confirming entries or setting targets and is an excellent odds enhancer for many trading systems. Links [  Documentation   |   Install  |  Update  |  Training  
    34 USD
    Blahtech Moving Average indicator is a multitimeframe version of the standard Moving Average indicator. It is also enhanced with customisable alerts, period breaks and other configuration options. The 50 day and 200 day moving averages are widely followed by investors and traders, with breaks above and below the MA lines considered to be signals of interest. Links [  Install  |  Update  |   Training   |   All Products  ] Feature Highlights Up to three timeframes Configurable calculation variab
    FREE
    Blahtech Better Volume provides an enhanced version of the vertical volume bars. Each bar is compared to the previous 20 bars. Depending on its volume, range and volume density it will be assigned a state and colour. Low Volume – Minimum volume High Churn   – Significant volume with limited movement Climax Neutral –   High volume with unclear direction Climax Up   – High volume with bullish direction Climax Dn   – High volume with bearish direction Climax Churn – High volume with restricted mo
    31 USD
    Blahtech Moving Average indicator is a multitimeframe version of the standard Moving Average indicator. It is also enhanced with customisable alerts, period breaks and other configuration options. The 50 day and 200 day moving averages are widely followed by investors and traders, with breaks above and below the MA lines considered to be signals of interest. Links [  Install  |  Update  |   Training   |   All Products  ] Feature Highlights Up to three timeframes Configurable calculation variab
    FREE
    Blahtech Fisher Transform indicator is an oscillator that displays overbought and oversold locations on the chart. The Fisher Transform algorithm transforms prices with any distribution shape into a normal distribution. The end result is a curve with sharp turning points that may help to identify bullish or bearish trends. Fisher Transform values exceeding 1.66 on the daily chart are considered to be good areas for reversal trades. Links [  Install  |  Update  |  Training   |  All Products  ]
    33 USD
    Blahtech Better Volume provides an enhanced version of the vertical volume bars. Each bar is compared to the previous 20 bars. Depending on its volume, range and volume density it will be assigned a state and colour. Low Volume – Minimum volume High Churn   – Significant volume with limited movement Climax Neutral –   High volume with unclear direction Climax Up   – High volume with bullish direction Climax Dn   – High volume with bearish direction Climax Churn – High volume with restricted mo
    31 USD
    Blahtech Fisher Transform indicator is an oscillator that displays overbought and oversold locations on the chart. The Fisher Transform algorithm transforms prices with any distribution shape into a normal distribution. The end result is a curve with sharp turning points that may help to identify bullish or bearish trends. Fisher Transform values exceeding 1.66 on the daily chart are considered to be good areas for reversal trades. Links [  Install  |  Update  |  Training   |  All Products  ]
    33 USD
    フィルタ:
    Man xola Man xola
    77
    Man xola Man xola 2023.03.23 05:04 
     

    One the best

    Nerijus1982
    348
    Nerijus1982 2022.08.08 15:58 
     

    On backtesting looks good.But in real conditions levels repainting and disappears even when they’re not broken.You just can’t trust them.

    Blahtech Limited
    159756
    開発者からの返信 James Cater 2022.09.27 14:38
    To reduce clutter, narrow levels formed from just two candles don't get displayed as old zones. If you want to display these levels set the parameter "Other Parameters / Min Bars For Old Levels" => 2
    Zakarias
    48
    Zakarias 2021.11.03 13:05 
     

    Awesome, i like the idea and its running very very good

    David Cooper
    38
    David Cooper 2021.08.03 03:32 
     

    A leading indicator very well done. Remember to wait for price to come to you.

    YHW1022221880
    170
    YHW1022221880 2021.07.27 12:19 
     

    Good supply and demand indicators

    vilem.iv
    121
    vilem.iv 2021.05.11 13:07 
     

    I never thought it will be possible for retail trader equipped with MT4 platform to read orderflow in realtime - Blahtech SnD is exactly what gave mi the "to the pip" reaction levels. With Market Profile, Average daily range and Market Stalkers course as "the wrap up of the logic behind the indicator": Retail trader has truly a chance to succes. Thanks to the team.

    efecetinel
    111
    efecetinel 2021.05.05 20:16 
     

    Perfect indicator, perfect owner. Thank you James

    Nicolas Dobrovsky
    527
    Nicolas Dobrovsky 2021.03.07 10:55 
     

    The best SR indicator on the market. It is necessary to set the indicator according to the trading style. I spent a lot of time testing different variants and settings. Everyone has to find what suits them.

    Edit: Backtest mode does not work properly, sometimes repaint. You always need to use the previous candle, otherwise you will have very different results in the real account.

    Frank Paetsch
    7242
    Frank Paetsch 2021.03.03 12:47 
     

    Good! thank you

    Kavindran Elangoven
    641
    Kavindran Elangoven 2021.03.01 02:55 
     

    for a person who doesnt know how to trade, this indicator wont be helpful at all, but if you are a experience trader in the markets but sometimes are unconfident about the levels you are watching, and with the knowledge you already have about the markets to develop a bias on your trading day. this can be a game changer

    DilliBab
    19
    DilliBab 2021.02.23 15:05 
     

    Hi Friends this indicator am using last one day ,can you tell me how to use this, where we go short and long.please explain me anybody friends...+91 9952104997 my whatsapp number

    njs7891
    124
    njs7891 2021.01.04 16:30 
     

    The levels this indicator shows are very good and make it easy to see where price is likely to react from. I like the hotkey features to cycle between higher timeframe levels as you can quickly spot levels you may have missed when zoomed into a lower timeframe. The backtesting feature is also great and very useful. Good support also. Great indicator.

    Ng Choong Huan
    204
    Ng Choong Huan 2020.12.09 07:04 
     

    This is perfect indicator S/D which auto calculate a lot of data (score or those complicate manual job). Well done. Love it so much

    finisheroffaith
    24
    finisheroffaith 2020.10.27 20:43 
     

    For those who say a free Supply and Demand indicator is just as good as this one. My first response would be have you bought this one, because there is no free supply and demand indicator that even comes remotely close to this indicator that I know of. This indicator is absolutely awesome. The features are outstanding. It is not' your standard free supply and demand indicator.I fill it is money well spent. If you are not educated with the supply and demand method that may change your perception of the worth of the indicator. I say don't buy something you are not educated on.I also say don't let someone make an evaluation for you they are not educated on.

    T3chAddict
    59
    T3chAddict 2020.09.17 15:11 
     

    Fast and reliable indicator. Not 'heavy' on the system. Apart from not wasting time to plot my own SD zones the back-test mode is super handy.

    Martin Freiherr Von Mirbach Doring
    507
     

    Unfortunately not a good indicator. Too bad about the money. My free indicator, which I used for a long time, is much better and more reliable.

    hashmi007
    100
    hashmi007 2020.06.10 19:11 
     

    Excellent indicator.I use it with my Bollinger/MA crossover strategy and blahtech provides me with accurate Target zones.great tool.

    Bradley Bosworth
    335
    Bradley Bosworth 2020.01.14 06:32 
     

    Awesome Indicator, but I'm trying to install on my computer (same one I originally installed) and it claims I've used all my "activations" when I've had to reinstall mt4 multiple times. I guess that counts as an activation even though it's the same PC?

    hkarram
    288
    hkarram 2019.10.20 15:29 
     

    Excellent indicator ..... a must for any supply demand trader ...... the backtest mode is a great tool ...... thanks for the developers

    Trader mql5
    1153
    Trader mql5 2019.10.11 02:01 
     

    The free S/D indicators are good enough for amateur traders. But for fine-tuning to my professional needs this is a good start (lol - always give space for future improvements). Love it!!

    12
    レビューに返信
    バージョン 4.0 2022.05.12
    - Overall Trend - Add "Three In A Row" option to highlight trend when all three timeframe trends align
    - Hotkeys - Zone Visibility - With Trend - Hide zones with unknown trend status
    - Alerts - Zone Visibility - Alow user to filter visibility independent of the display hotkey setting
    バージョン 3.9 2022.04.11
    - New Alerts - Stop excessive alerts being generated when multiple timeframes are active
    バージョン 3.8 2022.02.07
    - Block invalid alerts that were triggered when broker resets data feed
    - Improve level tooltip texts to always include nested info
    - Summary Panel - Add parameter Trend Show Consolidation Dots
    - Summary Panel - Rename parameter Engulfings - Stop Loss to Engulfings - Viable Size
    バージョン 3.7 2021.05.05
    Enhancements
    - Timeframes - Add new timeframe options - Current Plus One / Two / Three
    - Profiles - Add parameter "Clear Hotkeys On Terminal Close" to improve profile switching on MT5
    - Offline Charts - Add support for offline charts and backtest tools with missing market data and unsynced current time

    Fixes
    - Summary Panel - Q Points - Improve accuracy of real time updates
    - Summary Panel - Q Points - Ensure text is positioned correctly in the center of the box
    - Trend Change - Incremental - Check that BarNum >= MinBarsOldZones
    - Mouse Events - Keep CHART_EVENT_MOUSE_MOVE enabled if other indicators are waiting on mouse events
    バージョン 3.6 2021.04.20
    Enhancements
    - MT5 - Add support for extended timeframes
    - Trend Worm - Add option to display Trend Worm and/or Consolidation Worm on the chart
    (Due to a platform issue, MT5 users may need to re-attach the indicator to see the Trend Worm)

    Performance
    - Clear Hotkey - Improve performance of clear chart calls
    - Redraw - Remove ObjectsDeleteAll calls that slow other indicators with many objects
    バージョン 3.5 2021.04.02
    Fixes
    - Summary SupDem - Apply Filters to SupDem column
    - iCustom - Apply Filters to iCustom buffers
    - iCustom - Improve Blahtech Expert Advisor Examples
    - Alerts - Add MinBarsLevel and PriceAway filters to alerts
    - Overall Move - Fix edge case where Overall Move wasn't being calculated correctly
    バージョン 3.4 2021.03.24
    Enhancements
    - Enable filters whenever an individual filter is changed in the GUI
    - iCustom - Refactor EA code examples into class to support cleaner multiple instances

    Fixes
    - Summary SupDem - Improve highlighting of overlapped zones
    - Consolidations - Fix edge case when near MaxBars
    - Allow user to configure Timeframes 1-4 in any order
    - Allow experts to operate on higher timeframes than the current chart period
    - Change format of diff files to support iCustom development
    - Only populate iCustom buffers if they are enabled and used
    - Change position of Overall Move filter to the top half of the GUI
    バージョン 3.3 2021.03.08
    Enhancements
    - Summary Trend - Display dot next to the trend direction when recent bars are consolidating
    - Filters - Add Max Levels filter to allow the user to restrict the number of levels on the chart
    - Zone Highlight - Add parameter to change highlighting mode (None/Strength/Untouched)
    - Parameters - Write simple list of changed parameters to experts log when Ctrl+Q keys are pressed
    - Parameters - Create detailed report of changed parameters in Files/Blahtech directory to assist users and support

    Fixes
    - Q Points - Add Min Risk Reward parameter
    - Trend Change - Add Min Range and rename Min Risk Reward parameters
    - Overall Trend Alerts - Print all three timeframe directions in alert message
    - Summary SupDem - Improve highlighting accuracy with overlapped zones
    - Old Zones - Enable detection of old zones with just two bars
    - Consolidation - Fix edge case in consolidation zones detection
    - Hotkeys - Revert regression from 3.1 release where [ and ] were swapped round
    - Expert Advisor Mode - Change to a single option named "Reserved For iCustom Calls"
    バージョン 3.2 2021.01.20
    Enhancements
    - Alerts - Add parameter "Filter Nested (Levels)" to control raising alerts for nested zones only
    - Alerts - Add parameter "Trigger Alerts Early" to trigger touch/break alerts N points before the level
    - Hotkey Panel - Add "Alerts Nest" button to allow user to modify the nested zone filter from the GUI
    - Summary - Alerts panel - Add icon next to title to show "Trigger Early Alerts" points value
    - Summary - Alerts panel - Improve alerts icon tooltips
    - Touches - Increase accuracy of Touches and add optional Touch/Untouch points parameters
    - Info - Add parameter to control the precision of the {lots1} substitution string
    - Info - Add a second user custom format string

    Fixes
    - Alerts - Fix edge case where duplicate alerts could be raised
    - Alerts - Remove overlaps from Retouch alerts and apply filters to New alerts
    - Alerts - Don't raise alerts for levels hidden from display by the "Zone Visibility" parameter
    - Alerts - Improve text format, add bid price and number of touches
    - Trend Change - Modify trend change parameter to OVERLAP_ALL to improve consistency of trend reversals
    - Summary Panel - Improve accuracy of summary panel when price retraces from touched levels
    - Summary Panel - Optimise summary panel redraw to compensate for increased accuracy
    - HotKey Panel - Adjust panel Y location when position changed to Bottom left/right
    バージョン 3.1 2019.10.17
    - Enable left mouse click actions on Hotkey panel when keys have been reserved
    バージョン 3.0 2019.10.09
    Enhancements
    - Add a third mode to the Summary panel GUI to control all alerts
    - Alow user to set individual alert timeframes for Trend, Engulfings, QPoints and Levels
    - Allow M30,H4,D1 as well as 1,2,3 when setting alerts timeframe parameters
    - Enable Summary Timeframe Bubble Numbers by default
    - Add bubble numbers to QPoints and SupDem columns in the Summary panel
    - Add option to adjust the zone start bar of a level to the begining of a consolidation
    - Add Timeframe hints to the TF section of the Hotkey panel
    - Add {lots3} option to Info format

    Fixes
    - Change default colour of QPoint 2 from MediumOrchid to PaleVoiletRed
    - Change Invert Style and colour parameters to be more intuitive
    - Change text colour of oversized Q Points on the chart to Gray
    - Change Summary heading from TimeF to Time
    - Improve the behaviour of the Q Points hotkeys
    - Modify all lines drawn by the indicator to be unselectable
    - Include first bar in search for max move away of zones and Q Points
    - Reset hotkey settings when indicator is removed from chart or chart is closed
    - Only call TerminalInfoInteger to get ctrl status when key pressed or object clicked
    バージョン 2.9 2019.07.18
    Fix issue when backtesting beyond Max Bars
    バージョン 2.8 2019.06.19
    Enhancements
    - Add options to draw multi timeframe Q Points on the chart
    - Add GUI tab within HUD panel for control of filter parameters
    - Add extra filters for Nested Levels, Zone Size and Min Price Away
    - Change default values for live filters to disabled
    - Add option to choose method for Zone Height calculation - Default/Whole Body/Entire Candle
    - Add parameters to limit zone height "Zone Height Min" and "Zone Height Max"
    - Add iCustom Buffers for QPoint 1 Top Bar and QPoint 1 Bot Bar
    - Add option to display Total Move in custom format
    - Left clicking any description in the Hud Panel now resets the value back to its input parameter version

    Fixes
    - Change defaults to display more features on chart at startup
    - Check UserTickSize to stop divide by zero error
    - Check for empty iCustom buffer
    バージョン 2.7 2018.05.30
    Enhancements
    - Option to disable highlighting of Strong Zones
    - Option to use Current Timeframe only for Overall Trend
    - Parameter to change corner anchor of Summary Display
    - Added Sup/Dem button to show only supplies or demands
    - Added filter for number of retouches
    - Added filter for levels that were formed by engulfing pattern
    - Added filter for max price away
    - Added filter for age of old zones in bars
    - Support alerts for trend changes
    - Support alerts for overall trend changes
    バージョン 2.5 2017.08.29
    Enhancements
    - Support alerts for QPoint touches and breaks
    - Support alerts for up to 3 timeframes
    - Support inverted zone styles for the multi timeframe display
    - Remember hotkey states when restarting terminal
    - Support iCustom calls with 64+ parameters by using a set file

    Changes
    - Add tooltips to nested zone graphics
    - Add reserved keys parameter to prevent clashes with other products
    バージョン 2.2 2017.04.06
    Enhancements
    - Support additional timeframes
    - Support alerts for engulfings
    - Draw zones one bar back if the conterminous line originates there
    - Changed colour and font of QPoints label when range greater than 15x average size
    - Separated old and active filters to simplify usage
    - Added advanced iCustom buffers for timeframes two and three
    - Added second demo mode to show extra timeframes
    = Summary Panel
    - Support clicking on timeframe values to show/hide zones
    - Support clicking on QPoint values to change focus
    - Disabled highlighting of QPoint value in pink/blue when range is less than 15x average range
    - Modified highlighting of SupDem values to only use pink/blue
    = Hotkeys
    - Reversed the order of hotkey changes when "Shift" key is pressed
    - Nudge both start and end of zones one bar forward when "X" key is pressed

    Fixes
    - Remember the QPoint timeframe set by the user when switching chart timeframes
    - Fixed the average bar size to match version 1.0 values (regression bug)
    - Rebuild with latest compiler for MetaTrader platform changes
    - Changed all global variables to be constant expressions
    バージョン 2.1 2017.01.19
    Fixes
    - Resolved issues with iCustom calls

    Performance
    - Reduced overhead each tick to optimise Expert Advisor performance
    - Added Expert Advisor mode to skip creation and drawing of objects
    バージョン 2.0 2016.12.09
    New Features
    - Alerts - User customisable
    - Engulfing detector - Multi-timeframe
    - Filters - User configurable visibility filters
    - Old Zones - Choice of broken levels or trend changes
    - Nested Zones - Highlight levels that are nested within higher timeframe zones
    - iCustom - Add buffers for developers

    Enhancements
    - Info - Add bubble scores
    - Scores - Normalise with-trend scores so they are always out of 8
    - Timeframes - Change mappings for M1 to M1/M5/M30
    - Strength Engine Mode - Allow user to relax the criteria for a strong zone
    - Calc Mode - Add option to disable incremental calculations
    - Demo Mode - Allow user to switch between default and demo settings
    = Summary display:
    - Show icons when filters are active
    - Highlight "extended" trend in deeper colour
    - Support clicking then dragging panel to new location
    = Hotkey display:
    - Add verbose display
    - Allow user to change value by clicking on the rows
    - Support clicking then dragging panel to new location
    - Highlight values that have changed from input parameter settings

    Fixes
    - Summary - Do not highlight countertrend levels when all three trends align
    - Scores - Change so the user enters 0-8 rather than 0.0-1.0 for the strong zone scores
    - Trend - Support DBD levels changing trend
    - Hotkeys - Update position when window height is changed
    - Backtest - Use TimeLocal for backtest expire so it works when market is closed
    - Reset - Force clear and redraw of all objects on Reset

    Architecture
    - Candle parser - Rewrite candle parse to enable old zones

    Performance
    - Implement incremental calculations to reduce CPU usage
    - Only refresh each tick if next level has been touched or broken
    - Only redraw Hotkey display if chart width has changed

    New Hotkeys
    - "9" - Demo mode
    - "=" - Strength Mode
    - "]" - Filters - All Zones
    - "[" - Filters - Old Zones
    - ";" - Old Zones
    - "'" - Old Zones Style
    - "#" - Nested Zones

    Developers and parameters
    - Developers - Twenty five iCustom buffers
    - Parameters - Fifty extra parameters to control new features
    - See documentation for details http://www.blahtech.co.uk/supplydemand
    バージョン 1.1 2016.04.12
    - Bug Fix : Chart Zones - Hotkey "X" wasn't working on MN1 timeframe
    - Enhancement : Chart Zones - Add new Hotkey "Z" - Zone style (Applies to solo timeframe only)
    - Enhancement : Summary View - Highlight Active QPoint and differentiate between in the middle (---) and no QPoints ( )
    - Enhancement : Summary View - Change overall trend to use "Two Adjacent" rather than "Best Of Three"
    - Enhancement : Summary View - Improve Trend detection when we bust the top
    - Enhancement : Summary View - Improve SupDem highlighting to focus on QPoints as well as Trend
    - Enhancement : Summary View - Add Input parameter - Highlight SupDem in QPoint - Level Strength
    - Enhancement : Summary View - Shift text right one space when in full mode
    - Enhancement : Daylight Savings - UseDaylightSavings parameter - Change default to true
    - Enhancement : High Res Displays - WindowsDesktopScaling - Add parameter to support desktop scaling for 4K and other high res screens
    - Performance : Backtest Mode - Do not recalculate every tick when in backtest mode