Nikolai Semko / Profile
- Information
|
11+ years
experience
|
12
products
|
181
demo versions
|
|
1
jobs
|
0
signals
|
0
subscribers
|
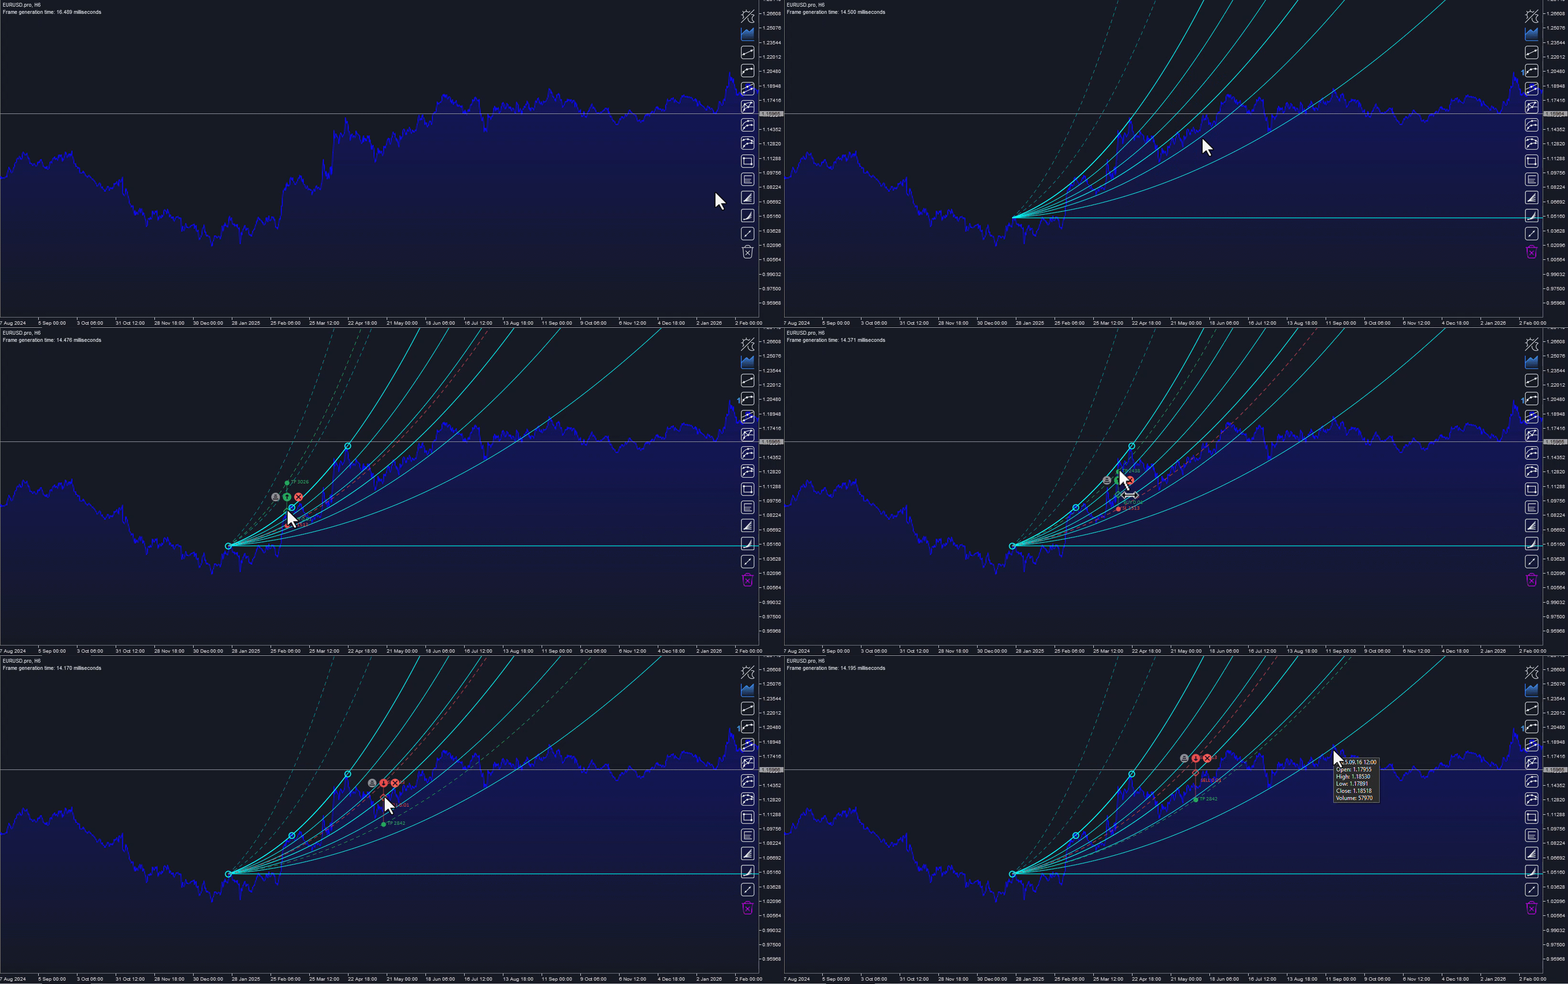
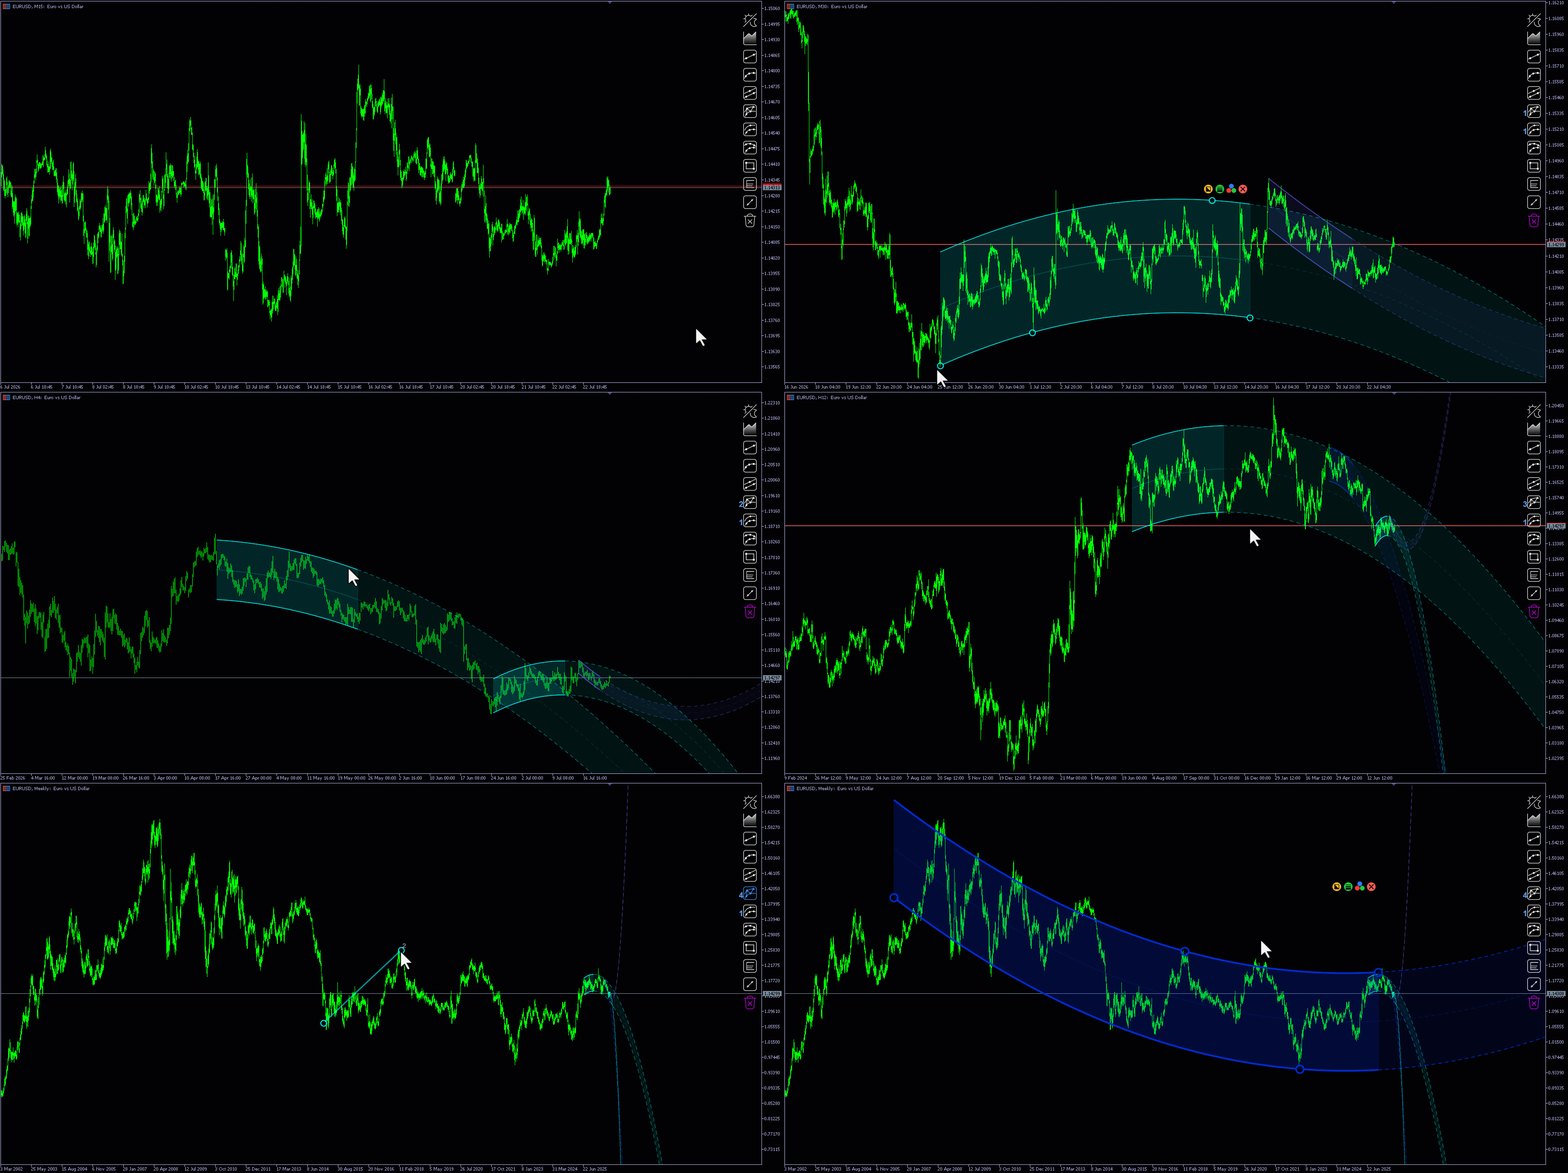
Channel Studio — you draw it, the EA trades it Two tools in one: a full vector markup editor right on the chart, and a semi-automatic Expert Advisor that trades what you have drawn. You are not fitting parameters and not trusting a black box. You mark up the chart the way you already do by eye, and the EA takes over execution only: it waits for the touch, opens the trade, trails the stop along your curve and reverses by a rule described in advance. All graphics are drawn on a canvas rather than
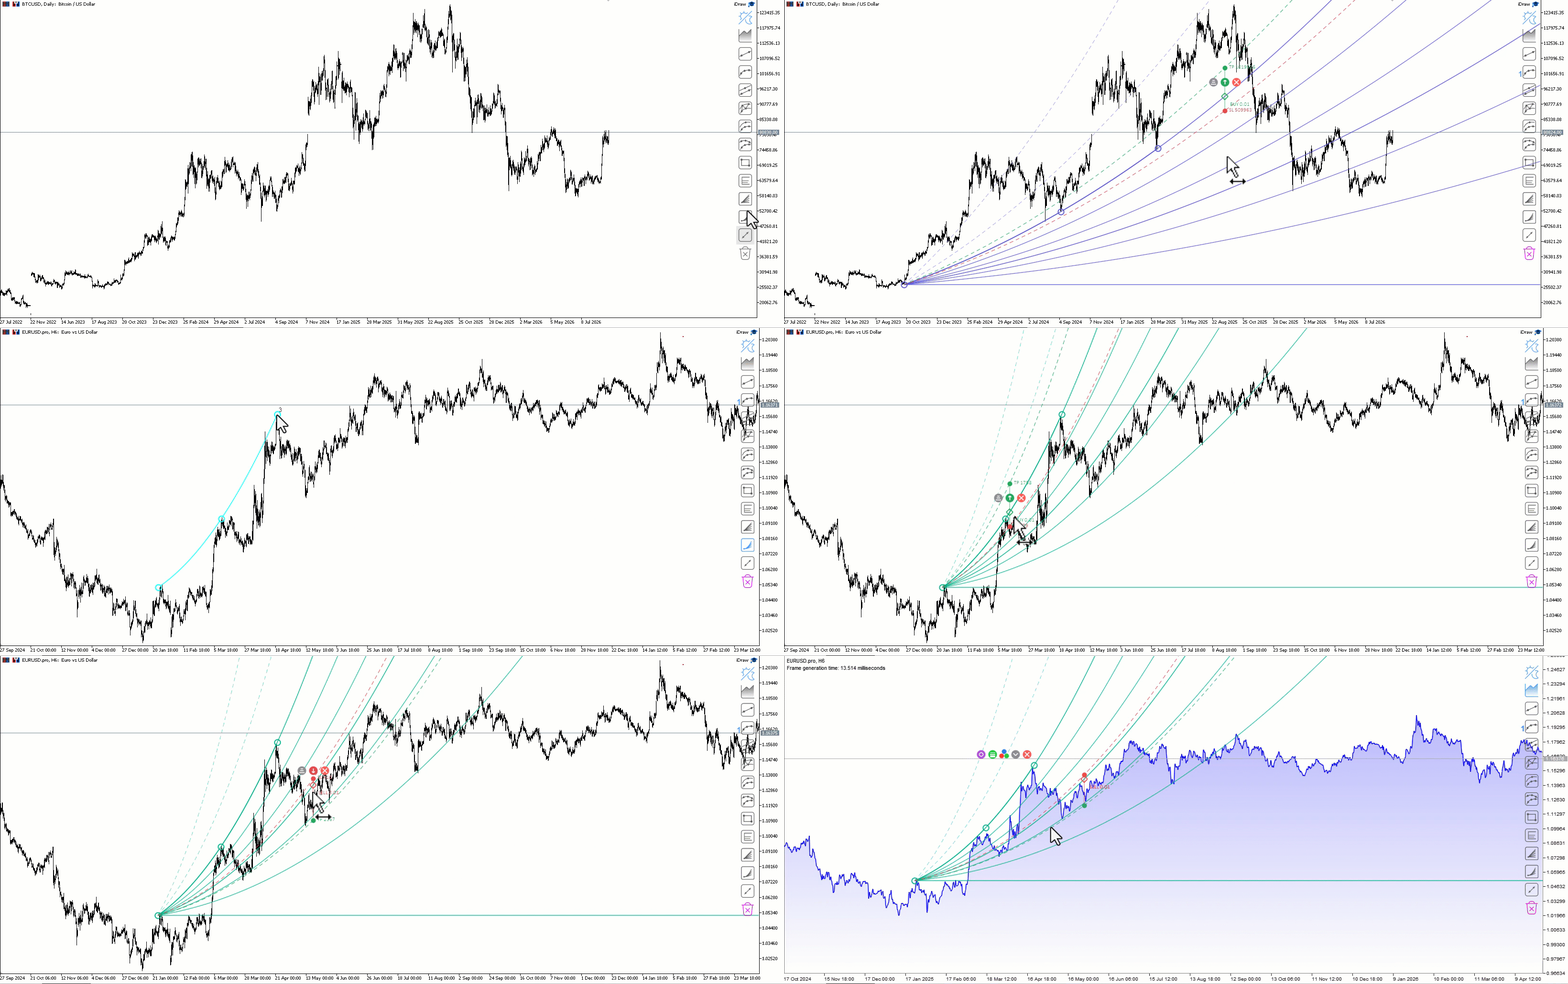
Drawing Studio — a simple tool for drawing vector elements right on your chart, helping you see what the eye alone can't. Trend lines, channels, parabolas, Fibonacci levels and a ruler — everything is drawn on a high-performance canvas with true anti-aliasing, not as standard terminal objects. The result is speed, cleanliness and beauty: thin, smooth lines instead of jagged "staircase" edges, and a chart that never gets cluttered with dozens of objects. Drawing tools Trend line Parabola Linear
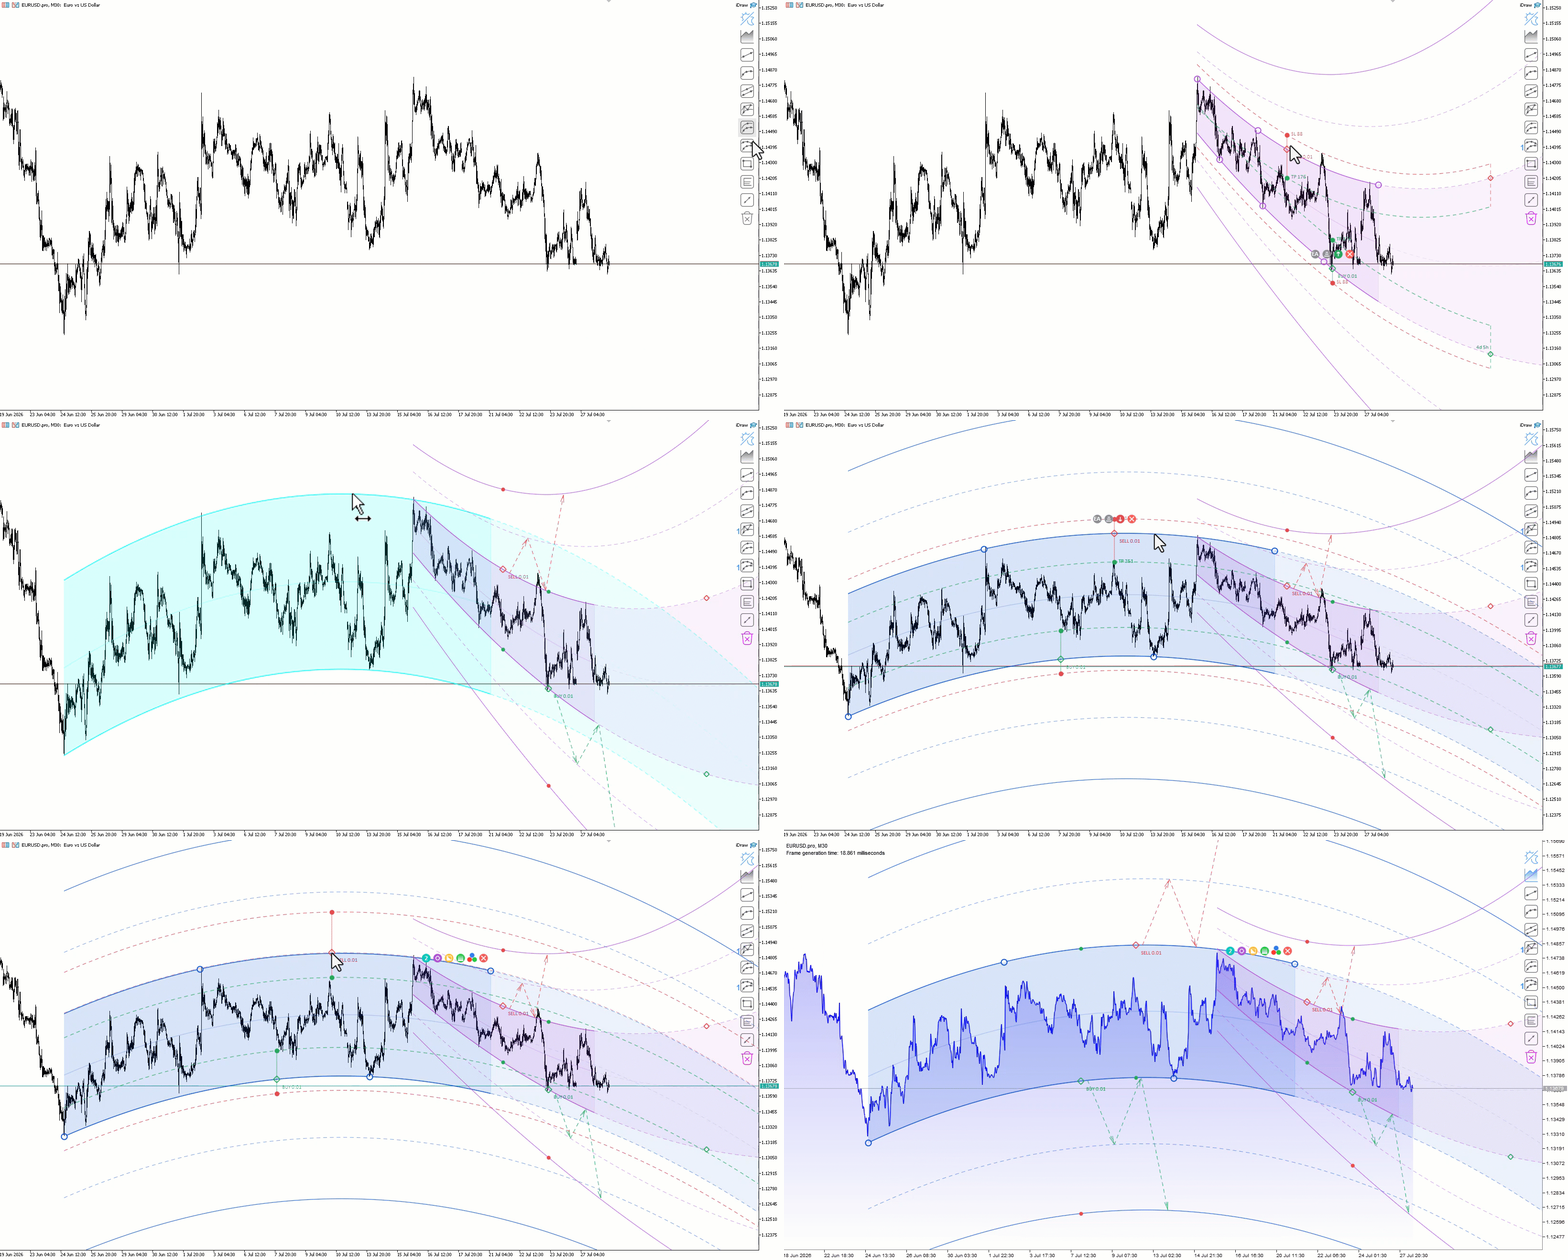
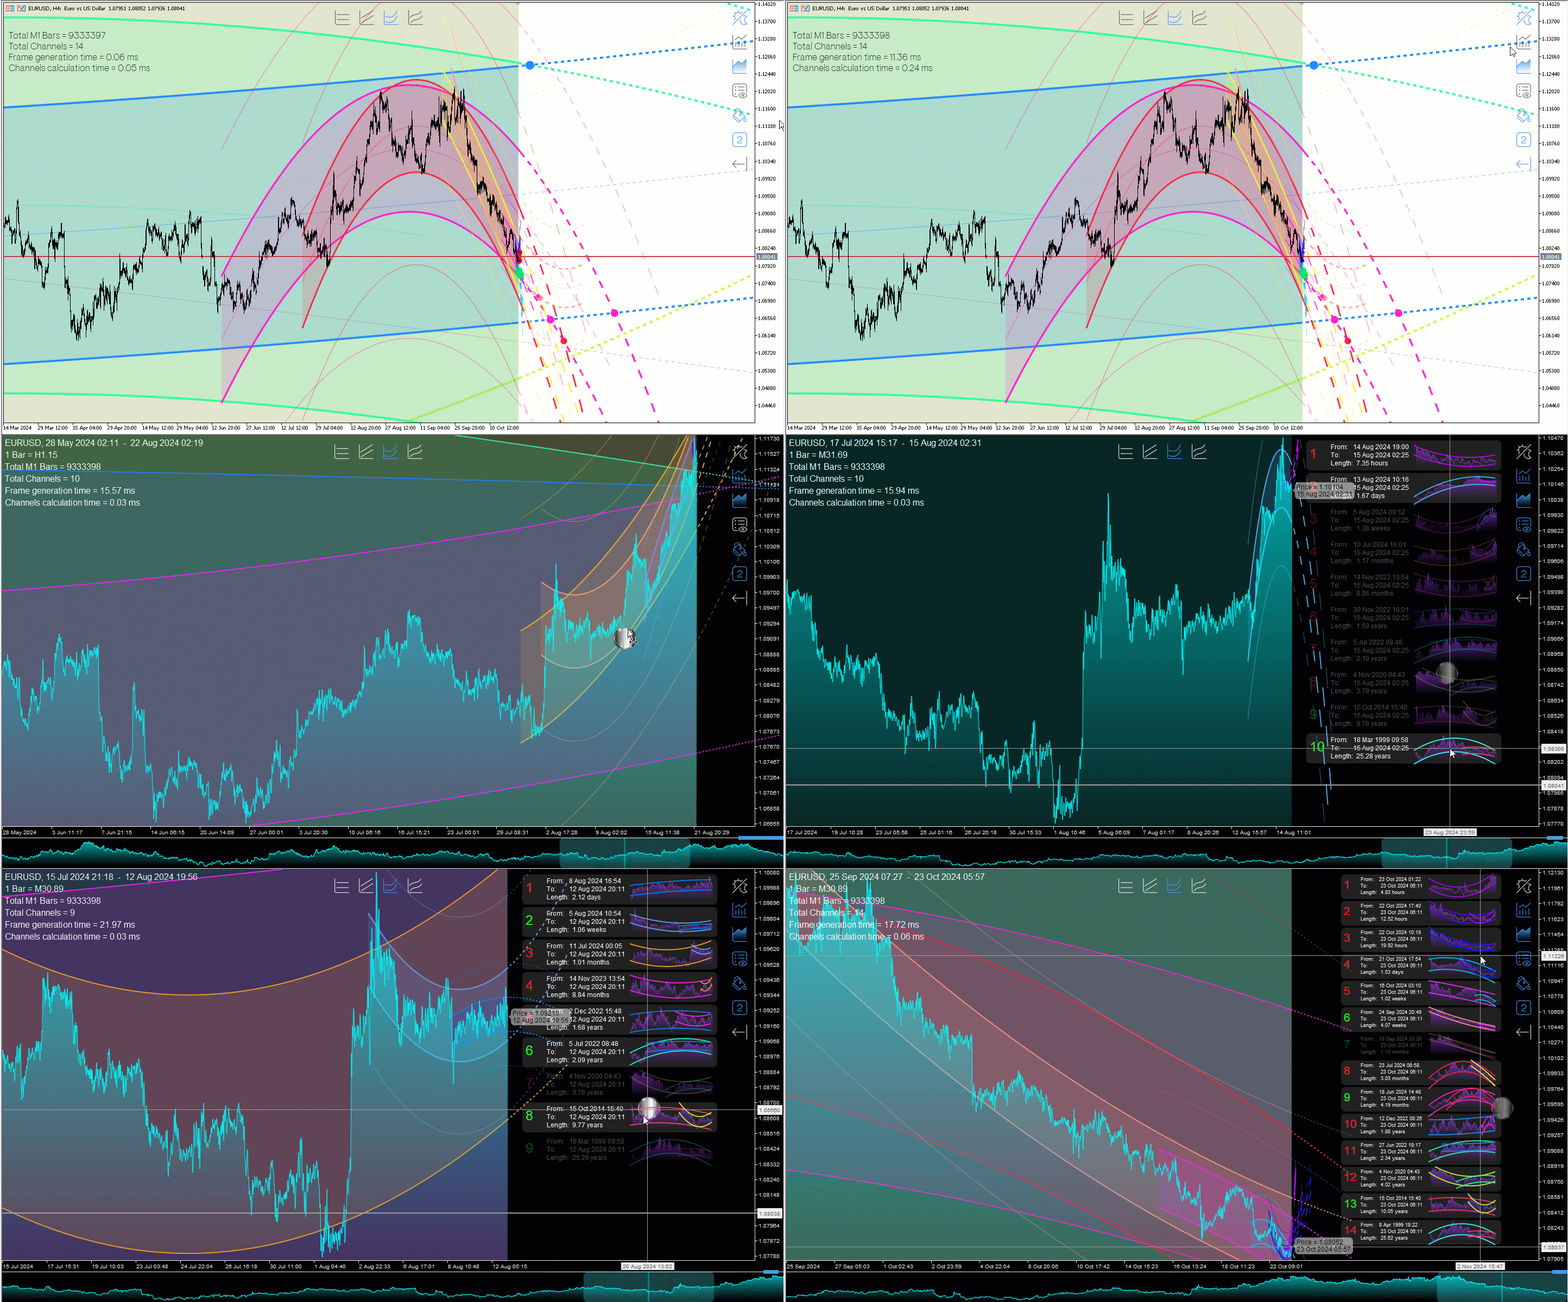
Ultra-fast recognition of parabolic channels (as well as linear, horizontal and wavy channels) throughout the depth of history, creating a hierarchy of channels. Required setting: Max bars in chart: Unlimited This indicator is designed primarily for algorithmic trading, but can also be used for manual trading. This indicator will have a very active evolution in the near future and detailed descriptions on how to apply to create robots
https://www.mql5.com/en/market/product/68039
Тем более это почти одно и тоже на рабочем участке наблюдения.
Вот пример:
http://yotx.ru/#!1/3_h/ubO/s7@0YM4X9t/2j/YP9g309Kre3/E0nkjZ0z6Bbk7HTnDLy3vrO7ebZ/sE@iYTd2ThmPp1uMx63Li939rf0DyNYZeG99Z/9gn0TDbmzBEIzHA8bjwe7@1j4C
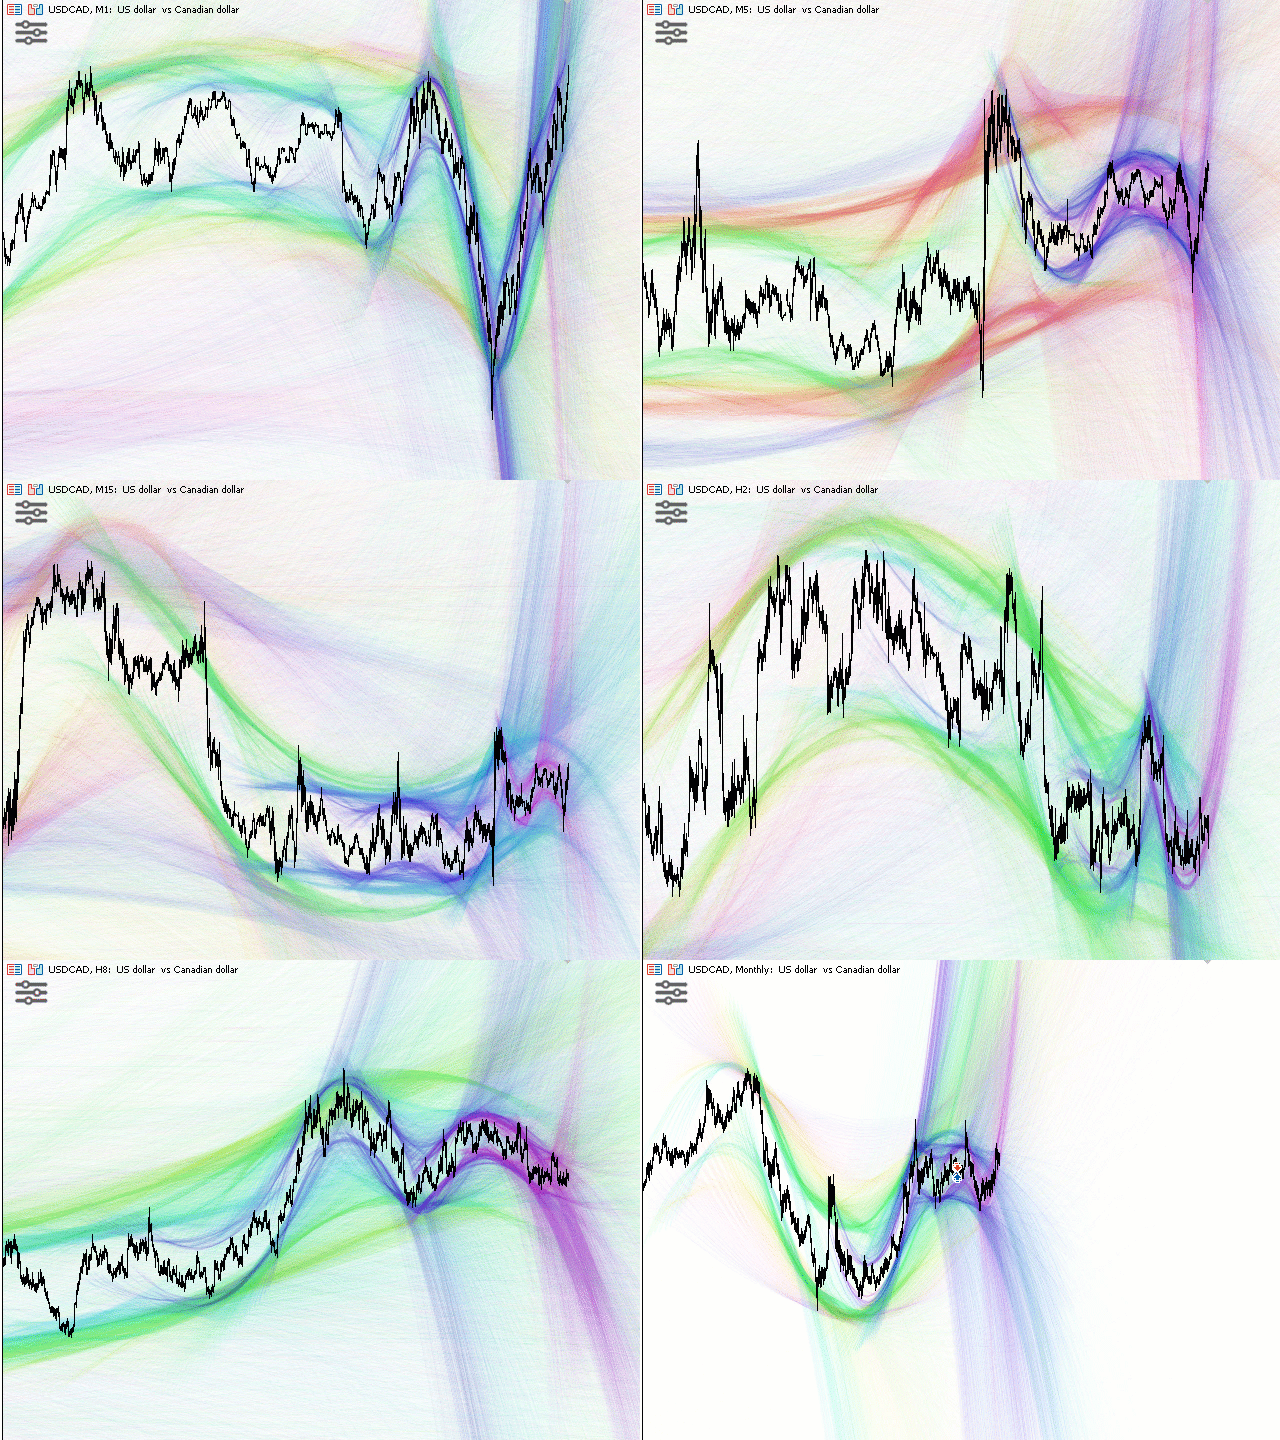
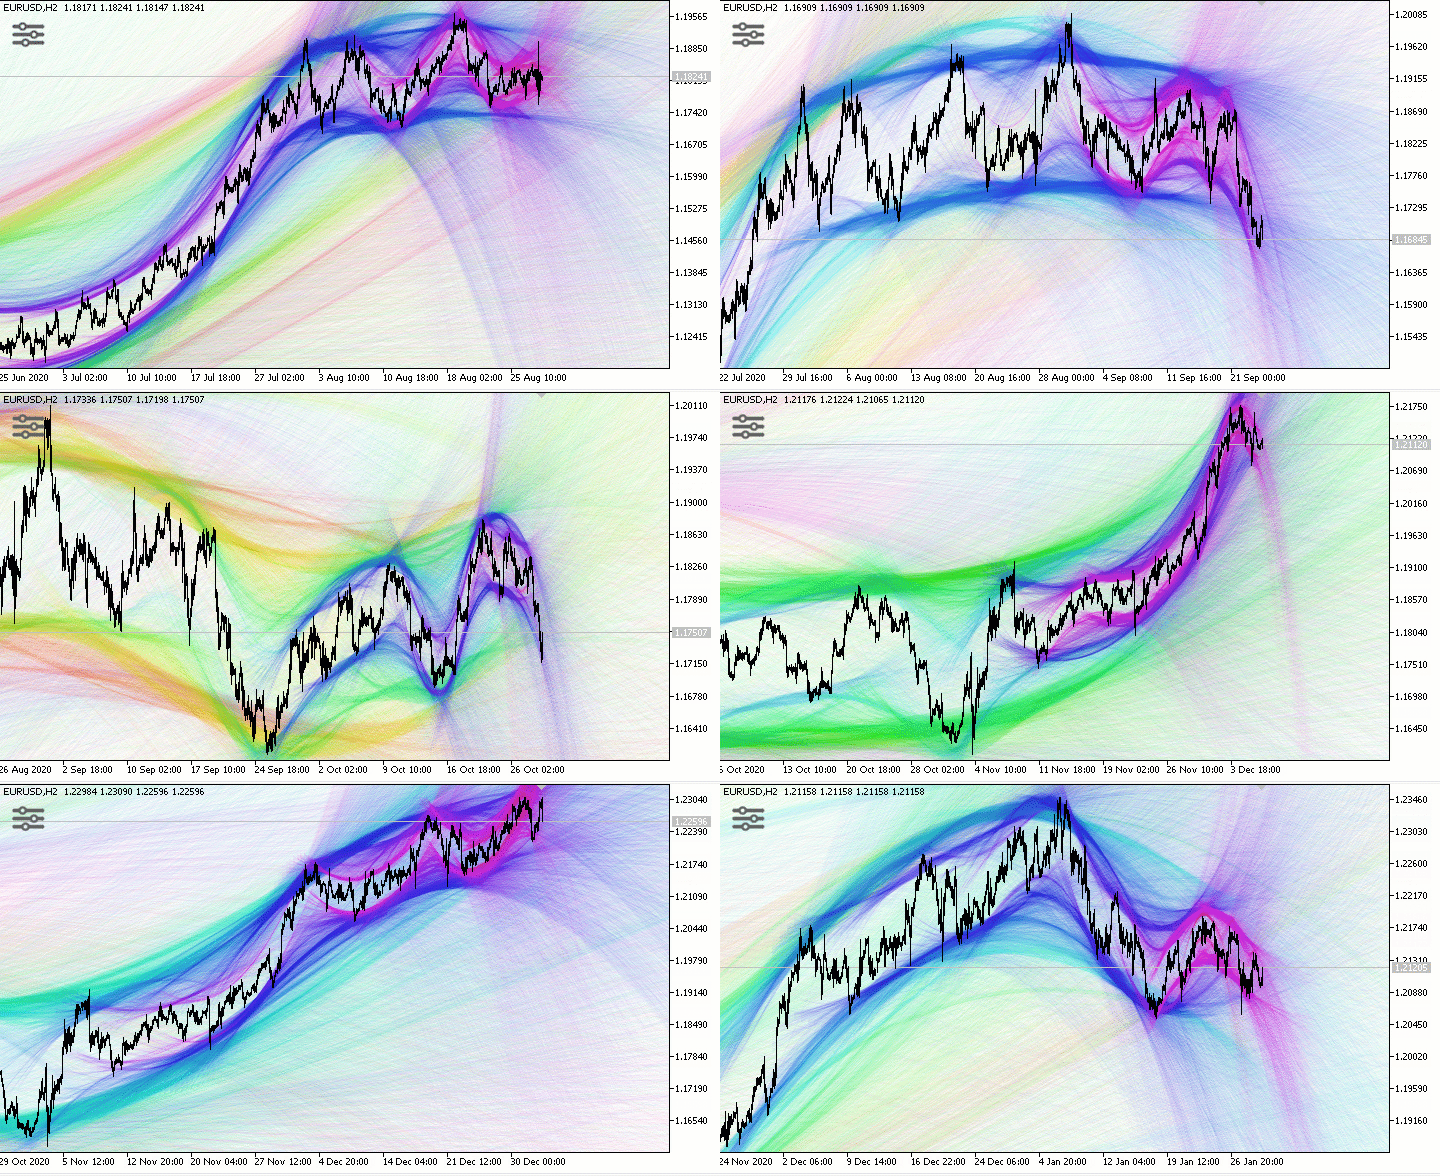
This indicator allows the trader to see what is difficult to see and recognize with the eyes. The indicator naturally recognizes and visualizes all processes in the behaviour of a trading instrument, which will be an excellent assistant for a trader who likes to make decisions on his own. This indicator draws a set of approximating channels in all sections of history with different periods. Formed channels form naturally and form their own hierarchy of channels by seniority (length and width)
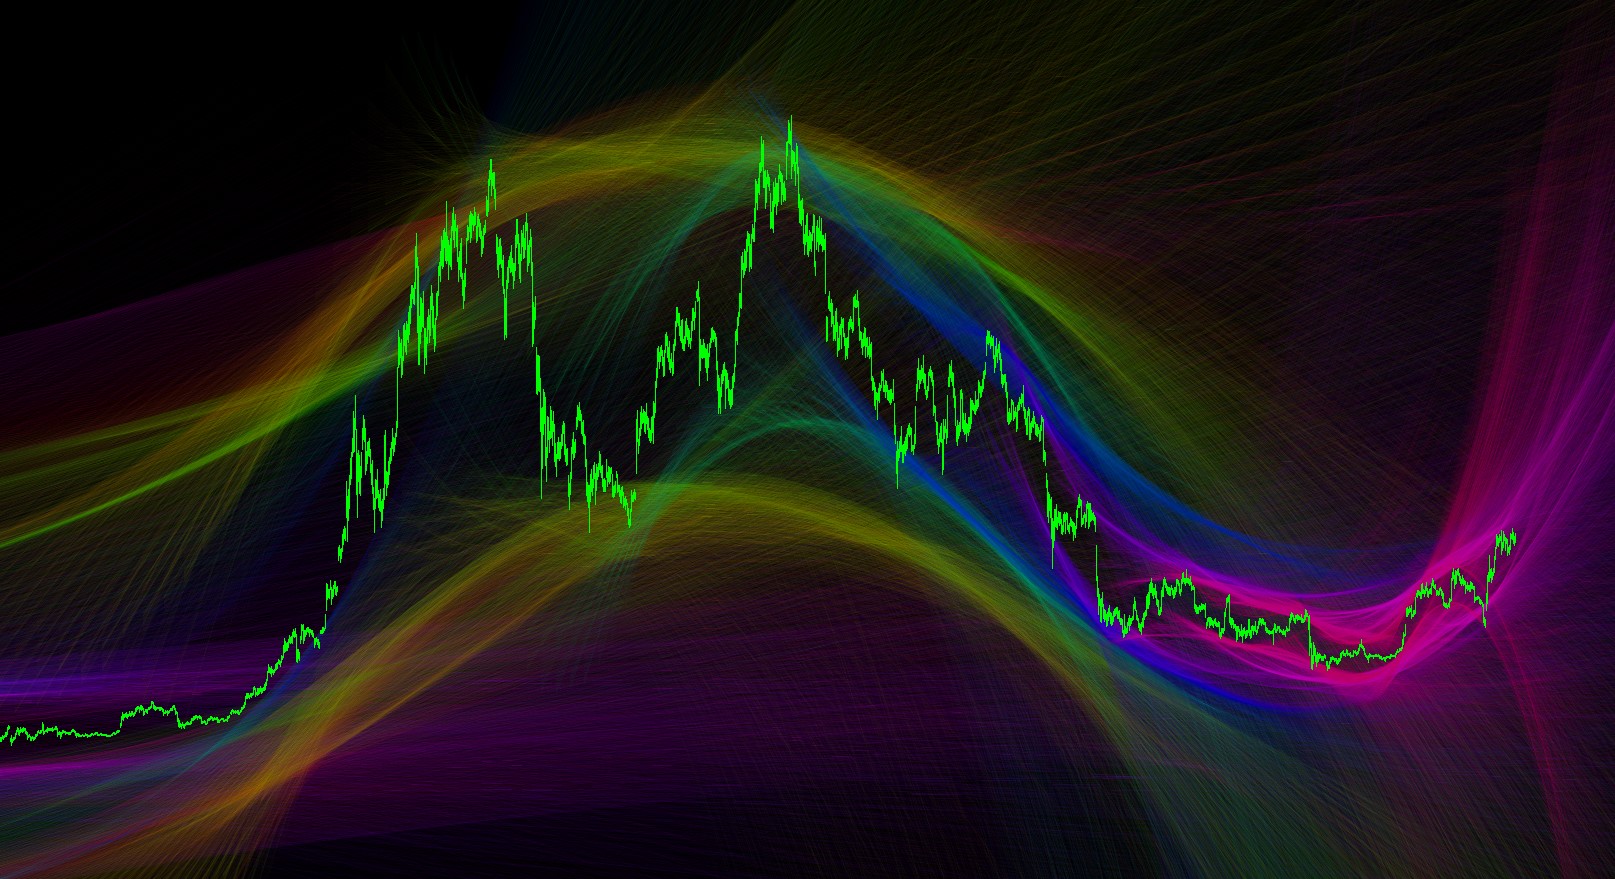
This indicator recognizes all support and resistance levels. A number of unique high-performance techniques have been applied, which made the existence of this indicator possible. All formed channels are naturally visible: horizontal linear linear parabolic cubic (Polynomial 3 degrees - Wave) This is due to a bundle of approximating channels. The formed channels form "standing waves" in a hierarchical sequence. Thus, all support and resistance levels are visible. All parameter management is
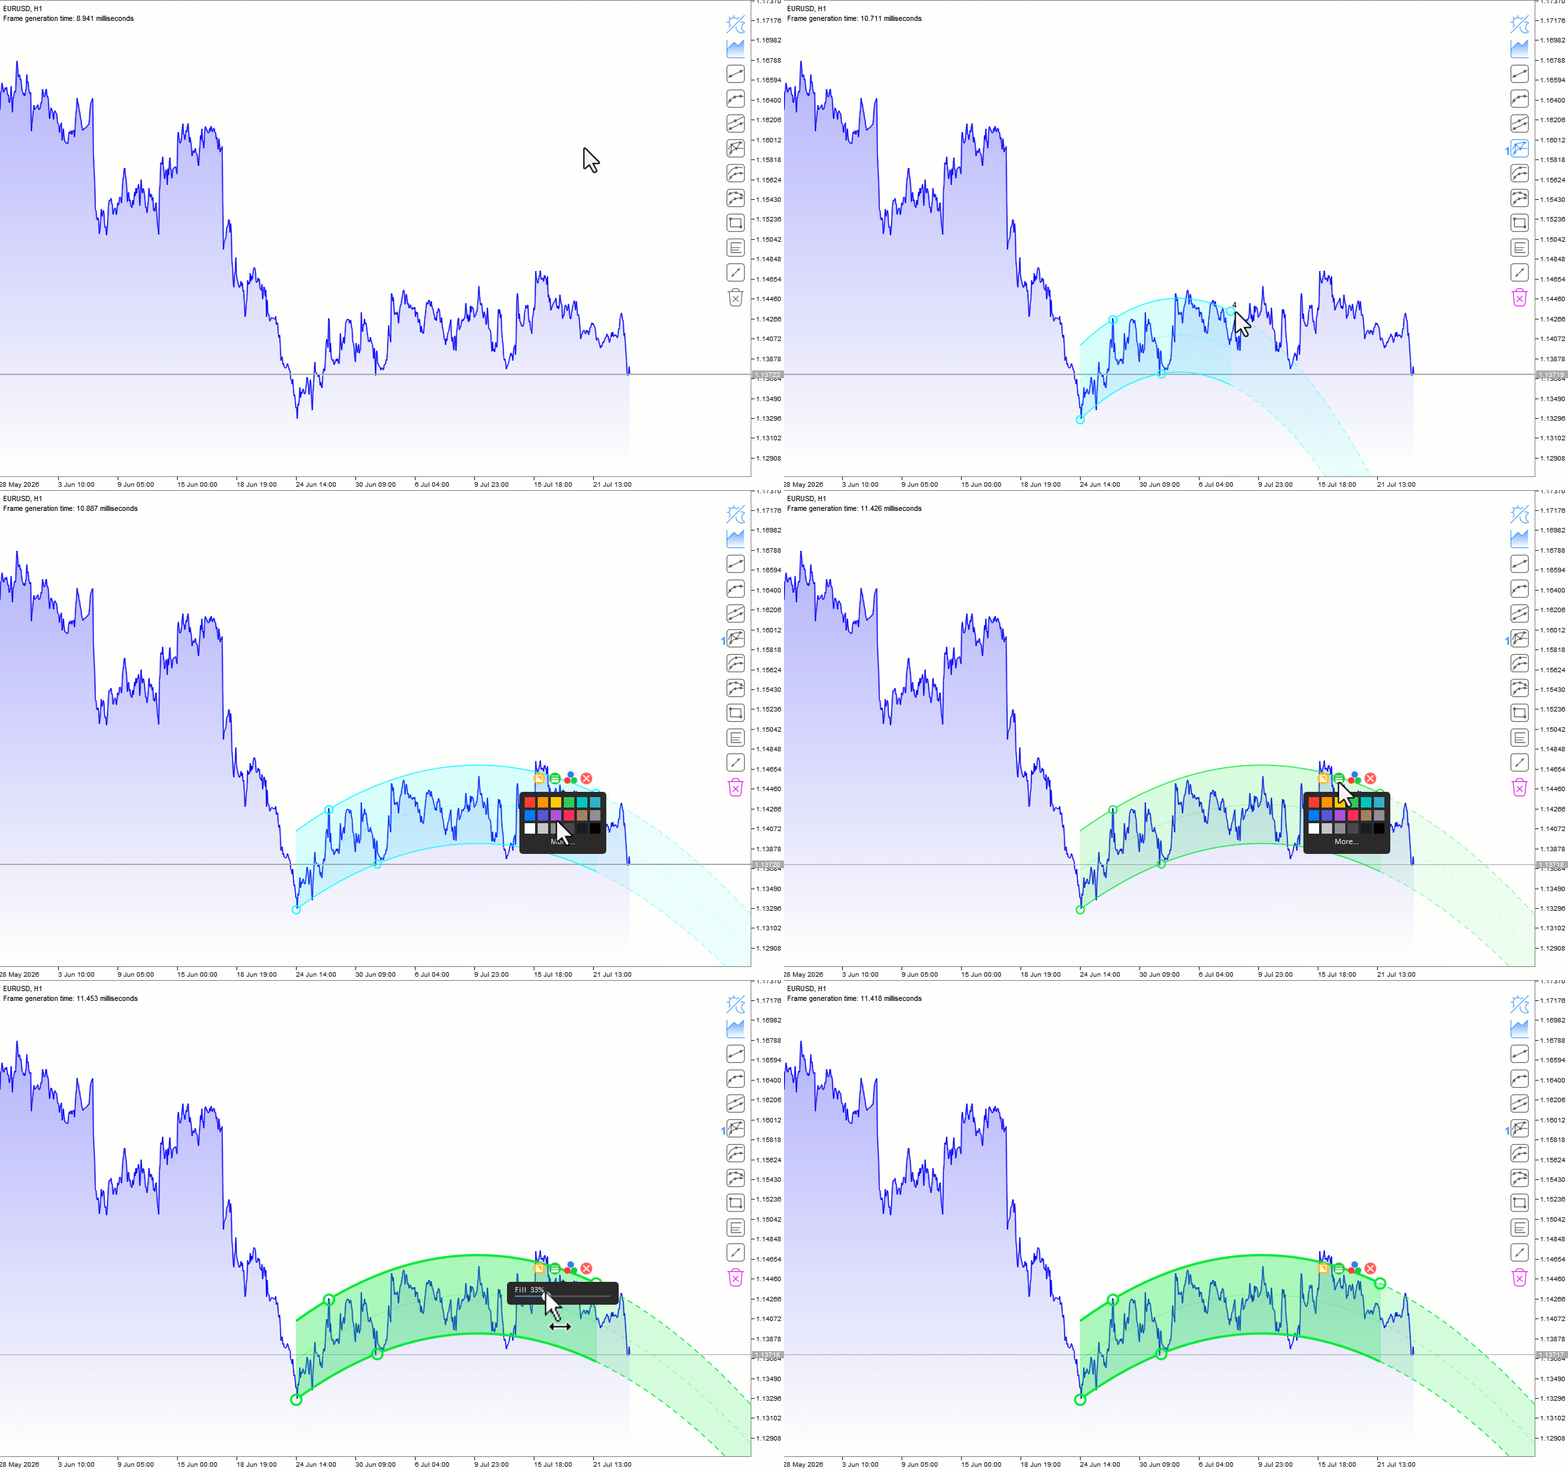
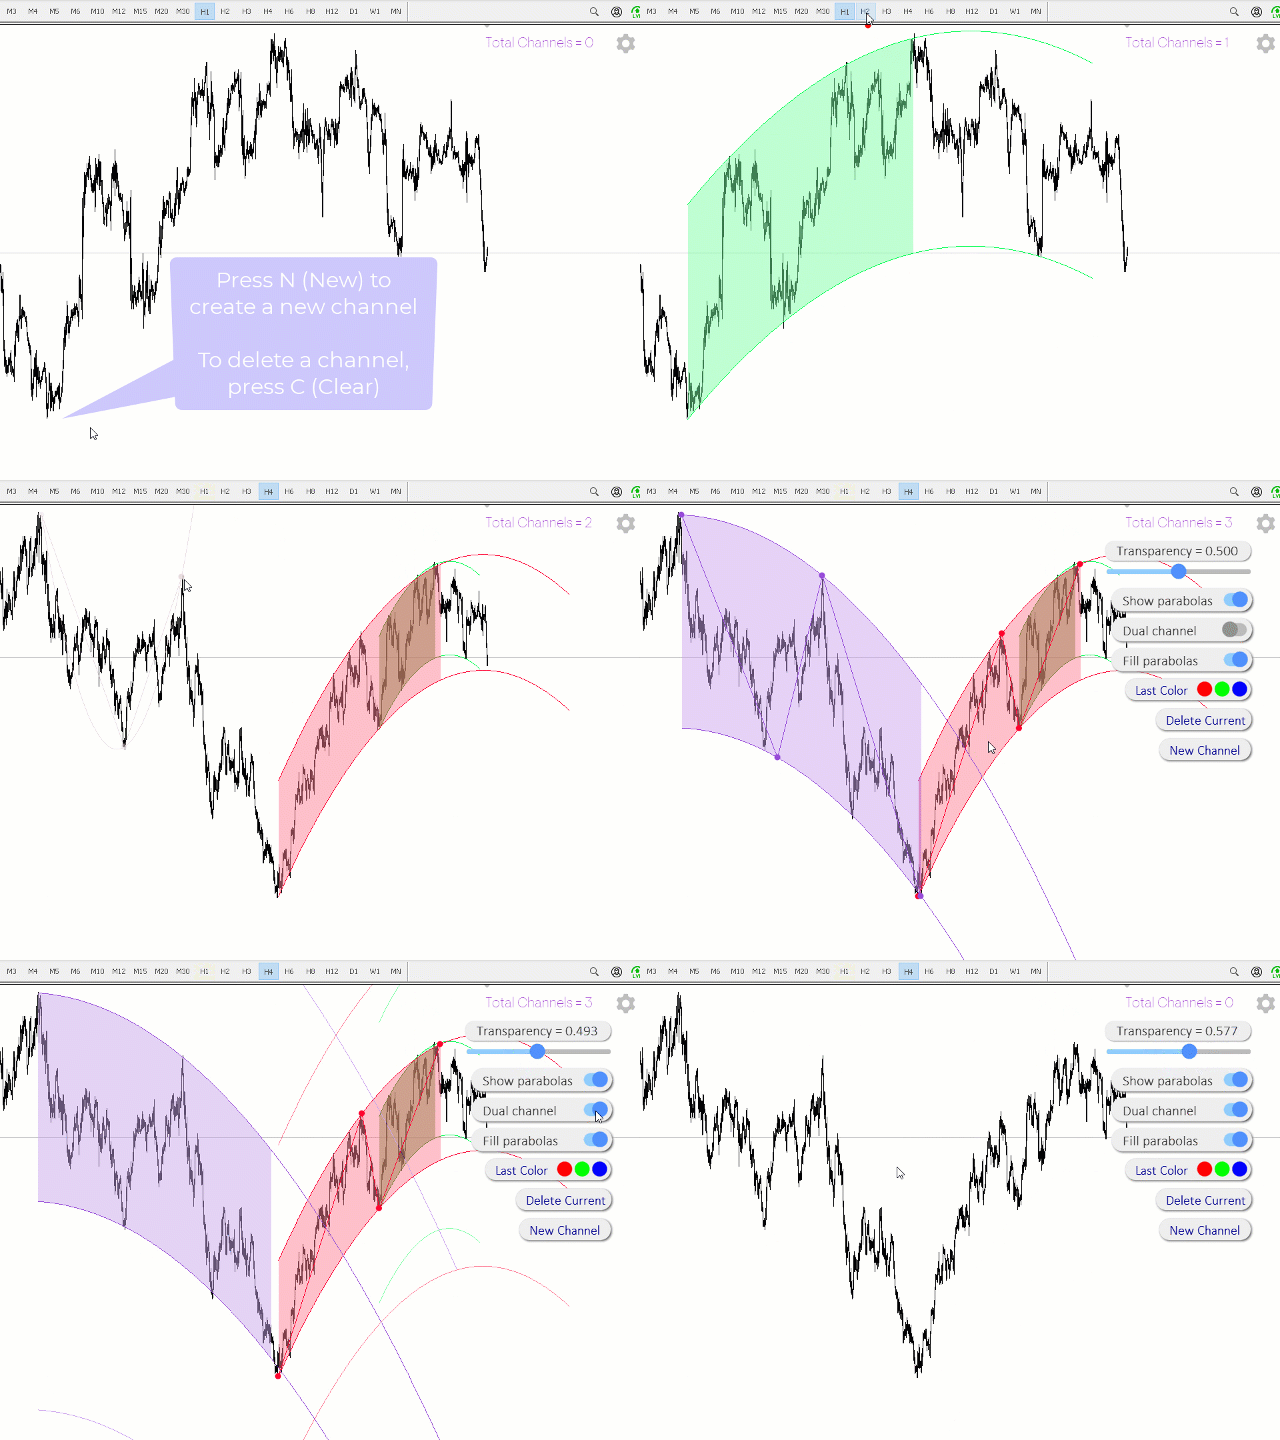
Convenient drawing of parabolic channels by four points (two lower and two upper extremums). Additional control keys: N (New) - Start drawing a new channel. C (Clear) - Deletes the current channel. By default, the current channel is the last channel. But you can click on the line of any channel to make it current. Click on the gear in the upper right corner to set some parameters for all channels or the current channel. All work is visible from the animated Gif. Do not forget to express your
This indicator significantly expands the capabilities of the usual ZigZag due to the addition of parabolic channels at the earliest stage of their inception. Download the demo version and test it in the tester. All graphics in the tester are working. But the ZigZag algorithm is special here, because it is implemented on a unique author's ultrafast loop-less algorithm for calculating parabolic regression and calculating its standard deviation. The features of this ZigZag are: Fast calculation
This indicator significantly expands the capabilities of the usual ZigZag due to the addition of parabolic channels at the earliest stage of their origin. Download the demo version and test it in the tester. All graphics in the tester are working. But the ZigZag algorithm is special here, because it is implemented on a unique author's ultrafast loop-less algorithm for calculating parabolic regression and calculating its standard deviation. The features of this ZigZag are: Fast calculation
#include //https://www.mql5.com/ru/code/22164