|
8+ years
experience
|
32
products
|
146
demo versions
|
|
0
jobs
|
0
signals
|
0
subscribers
|
👑 Theoretical physicist, programmer, trader with 15 years of experience.
----------------------------------------------------------------------------------------
💰 Presented products:
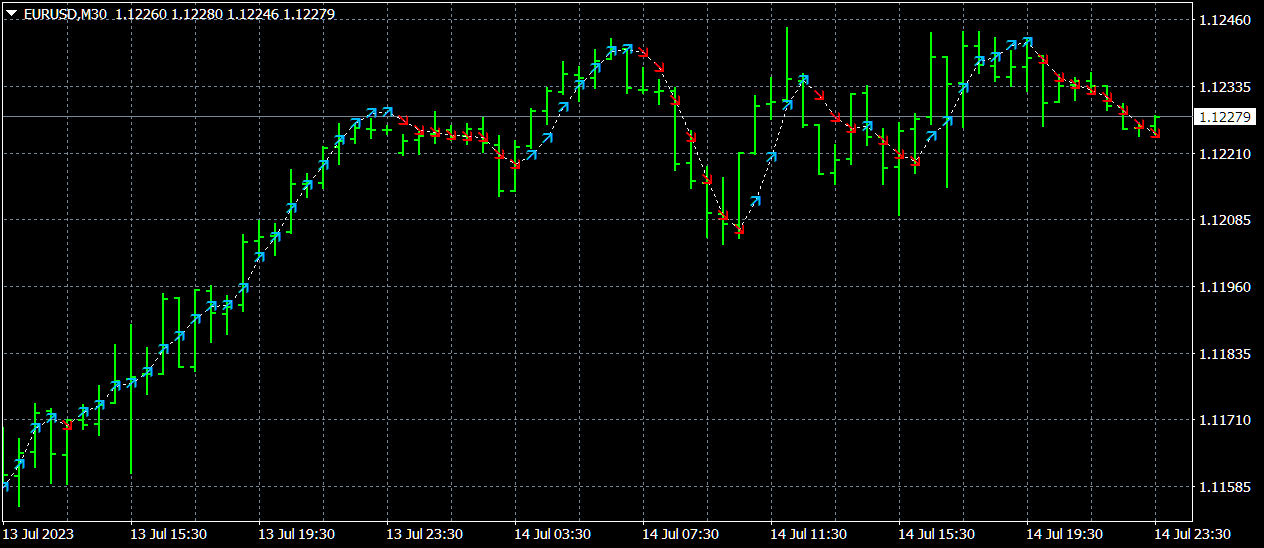
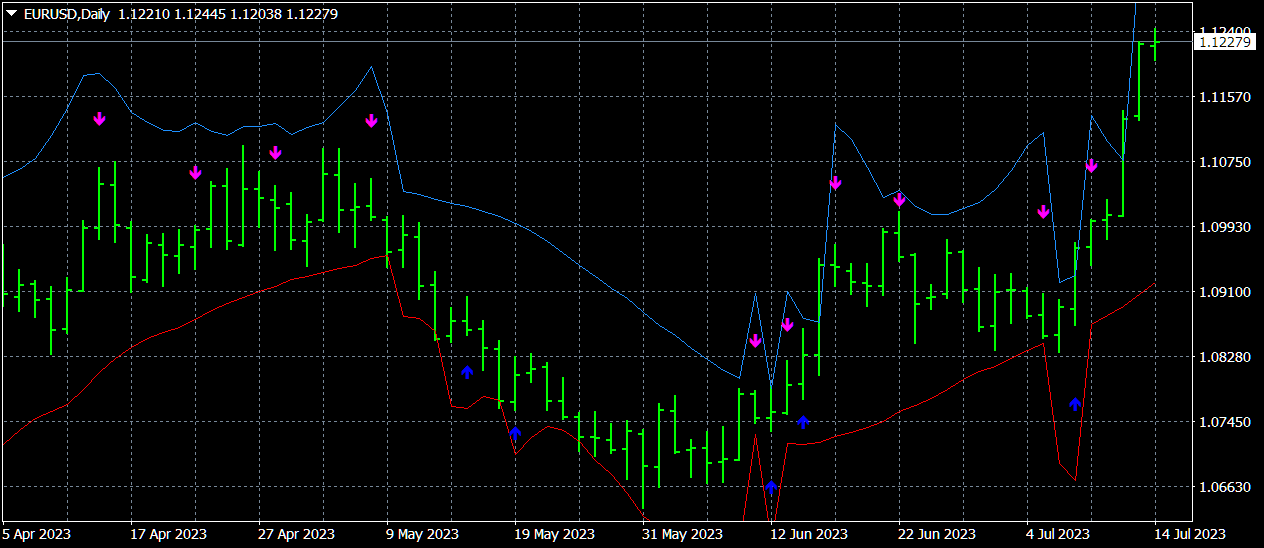
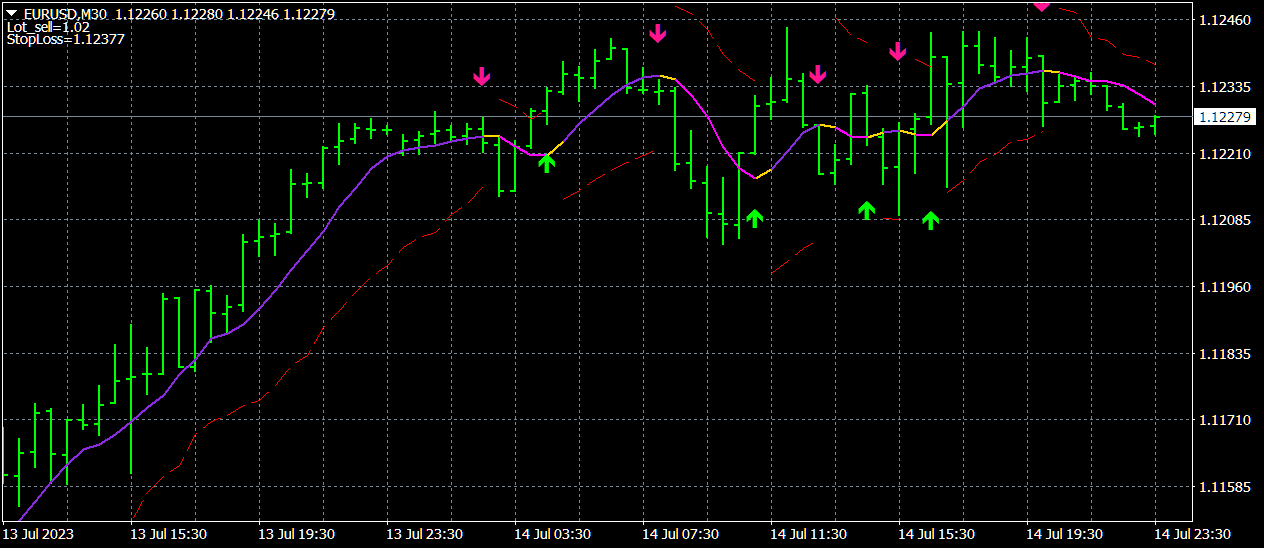
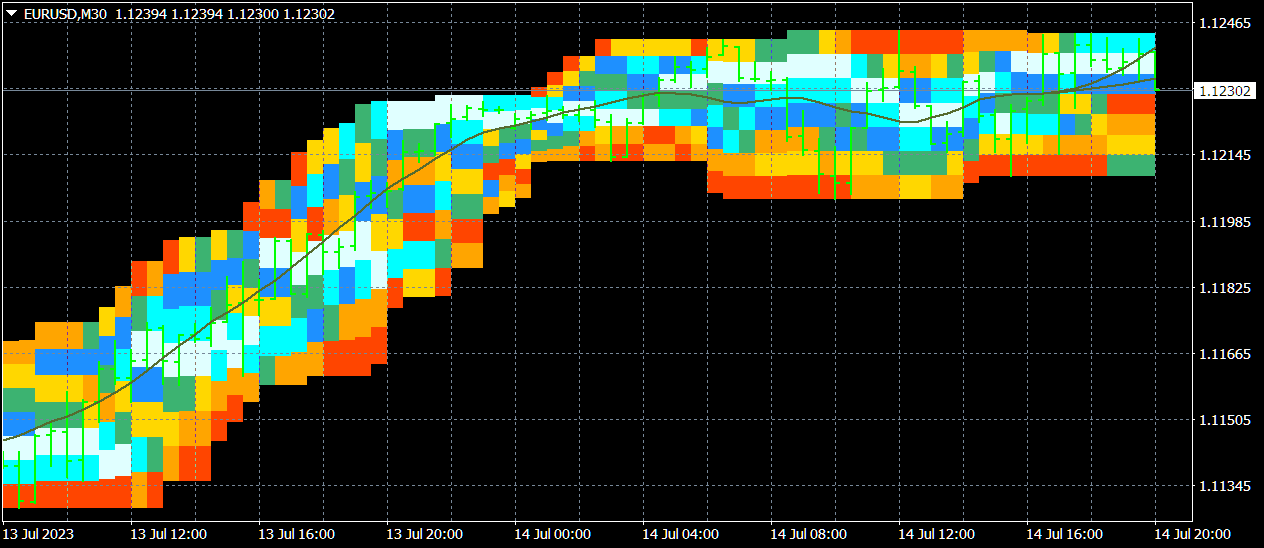
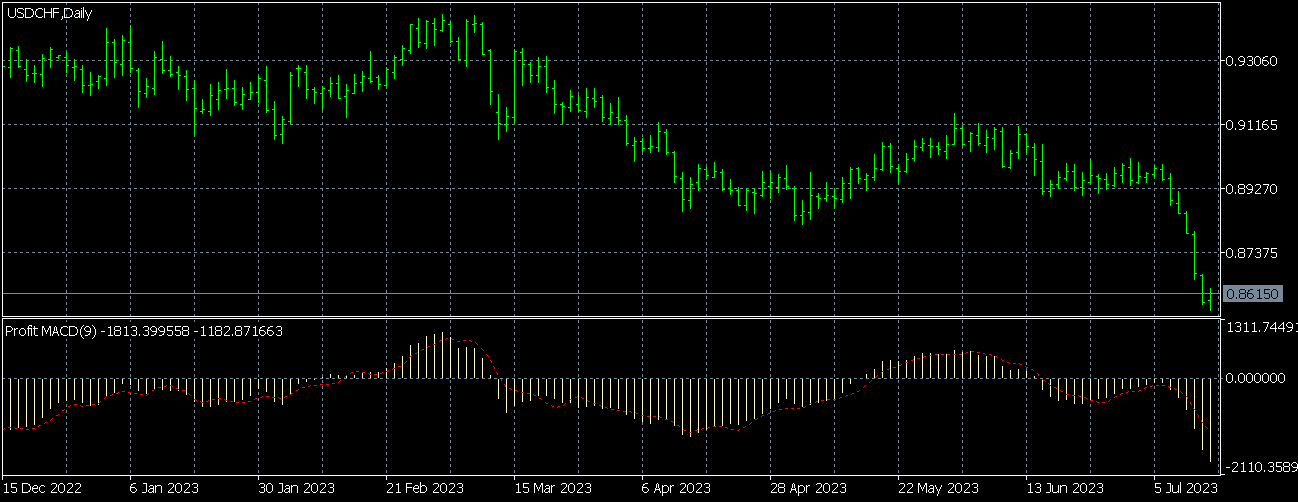
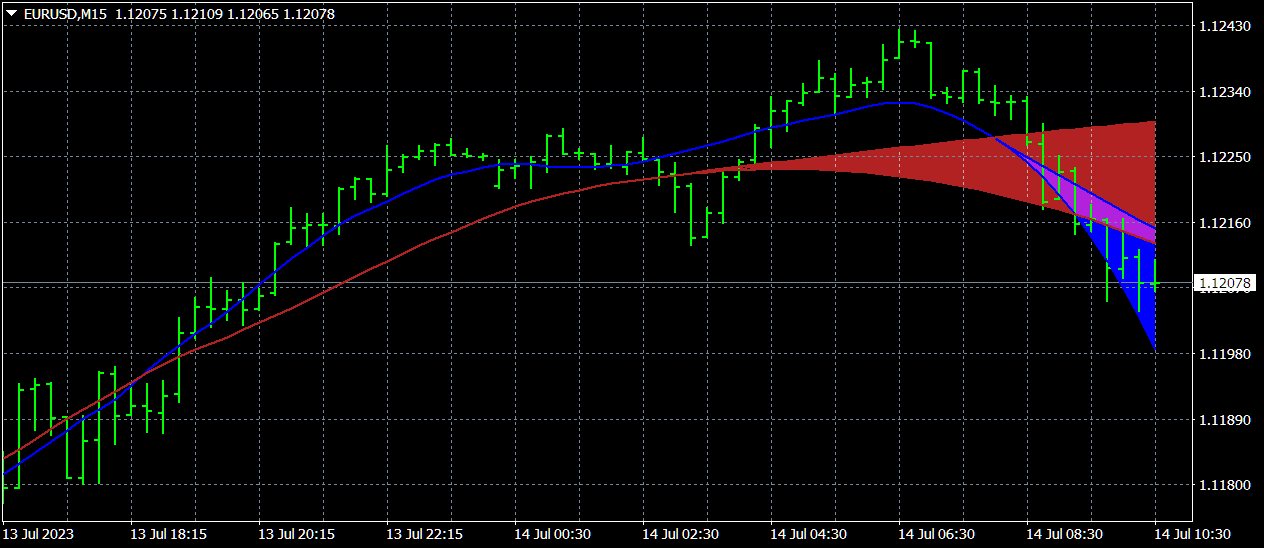
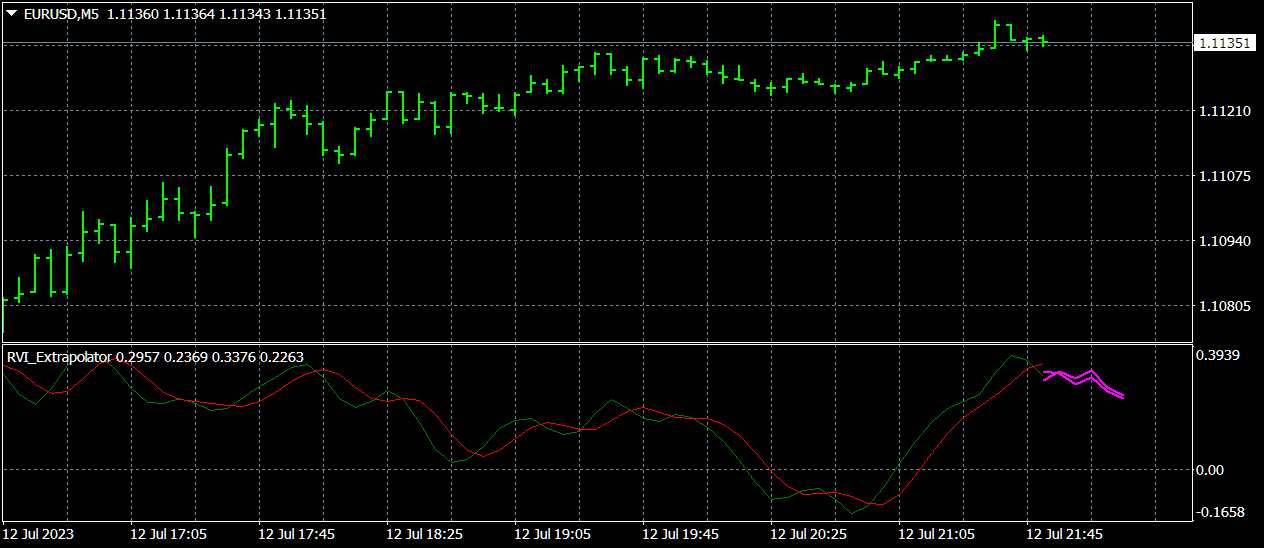
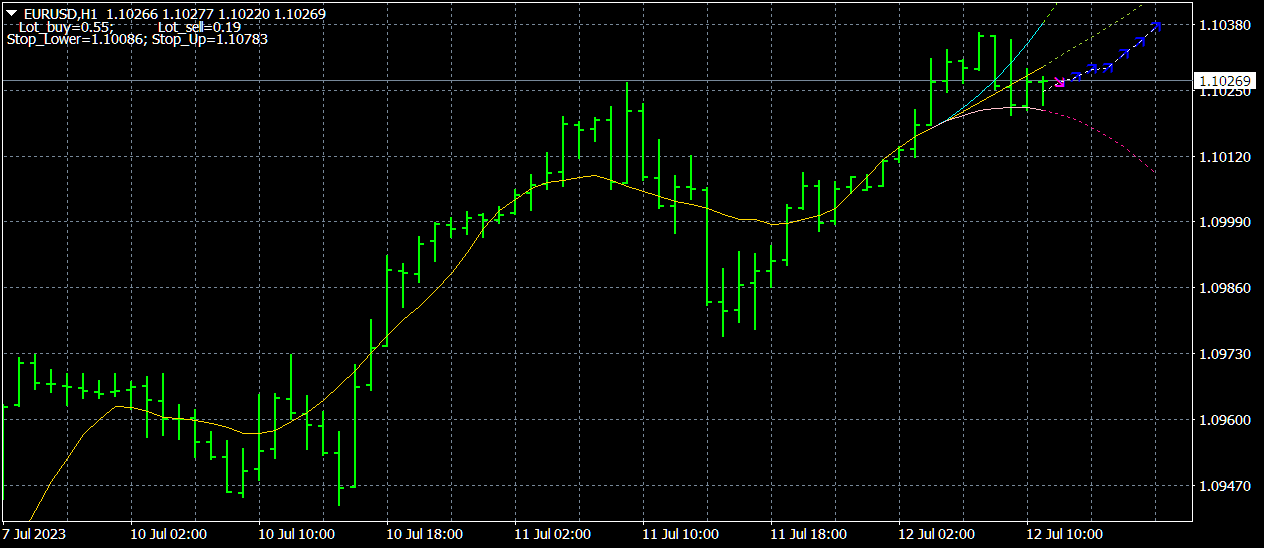
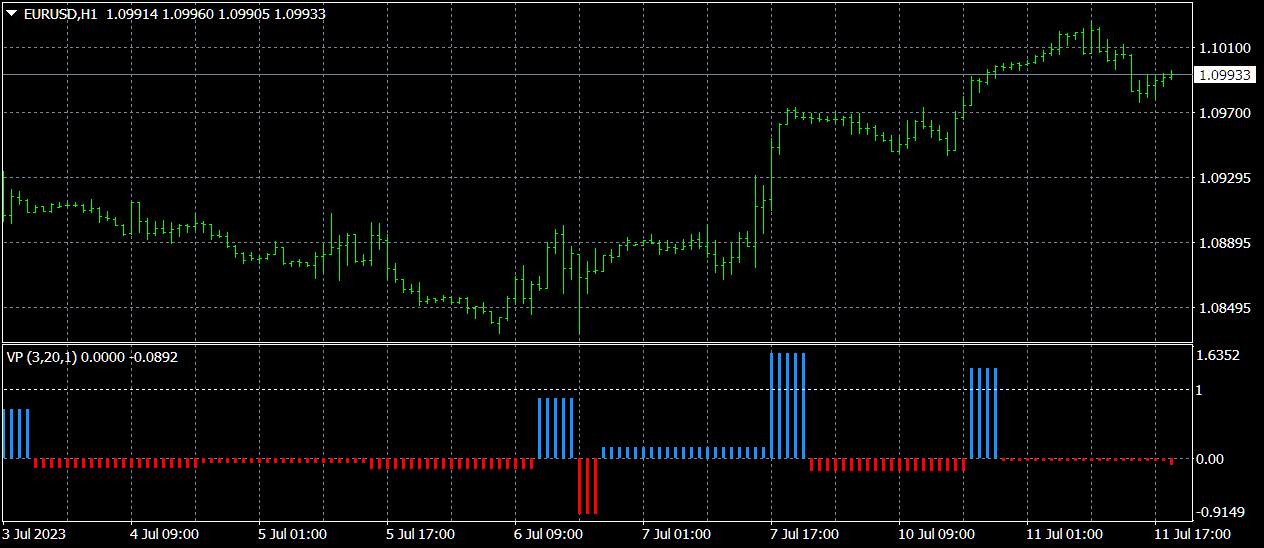
1) 🏆 Indicators with optimal filtering of market noises (for choosing points of opening and closing positions).
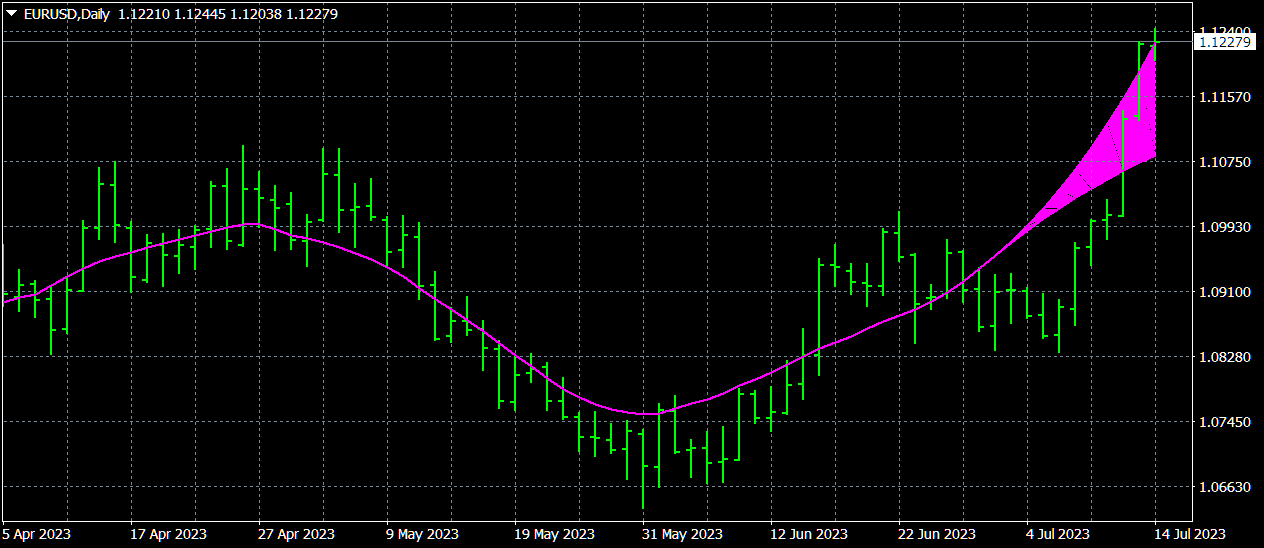
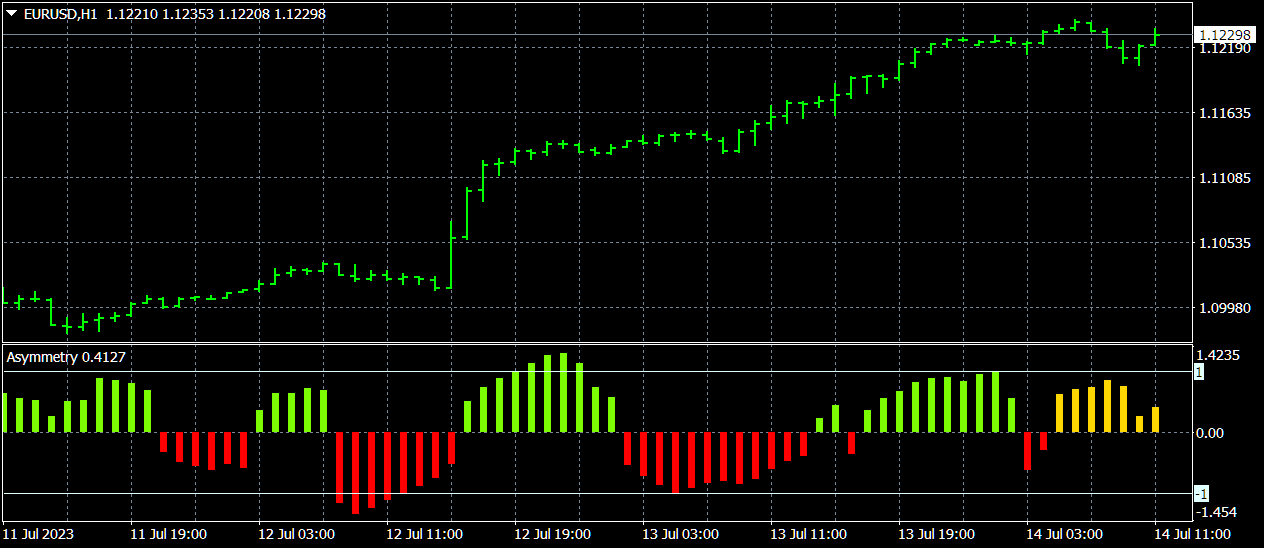
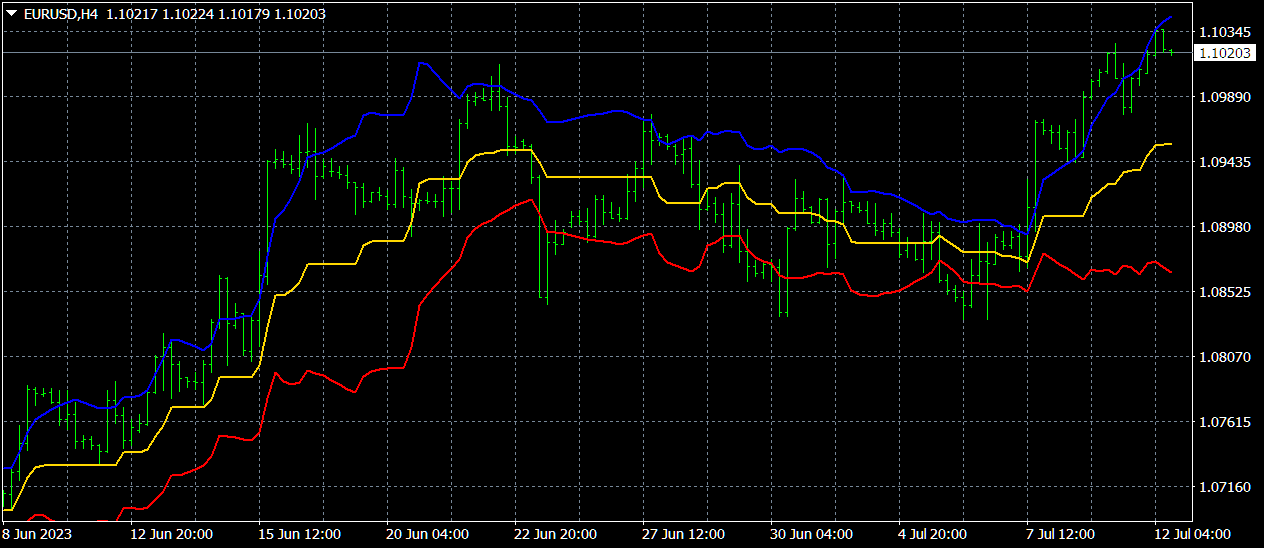
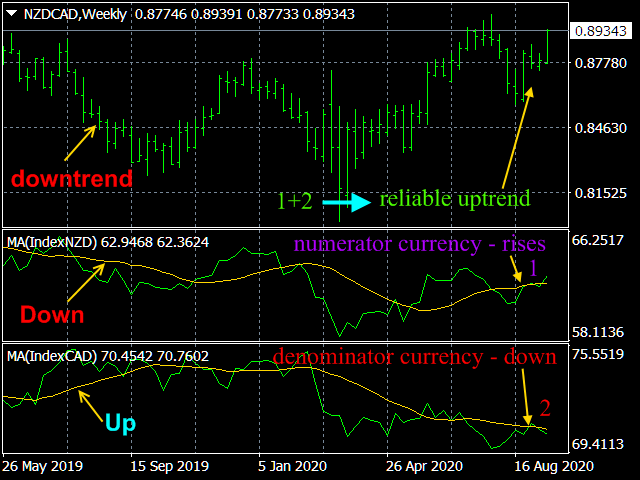
2) 🏆 Statistical indicators (to determine the global trend).
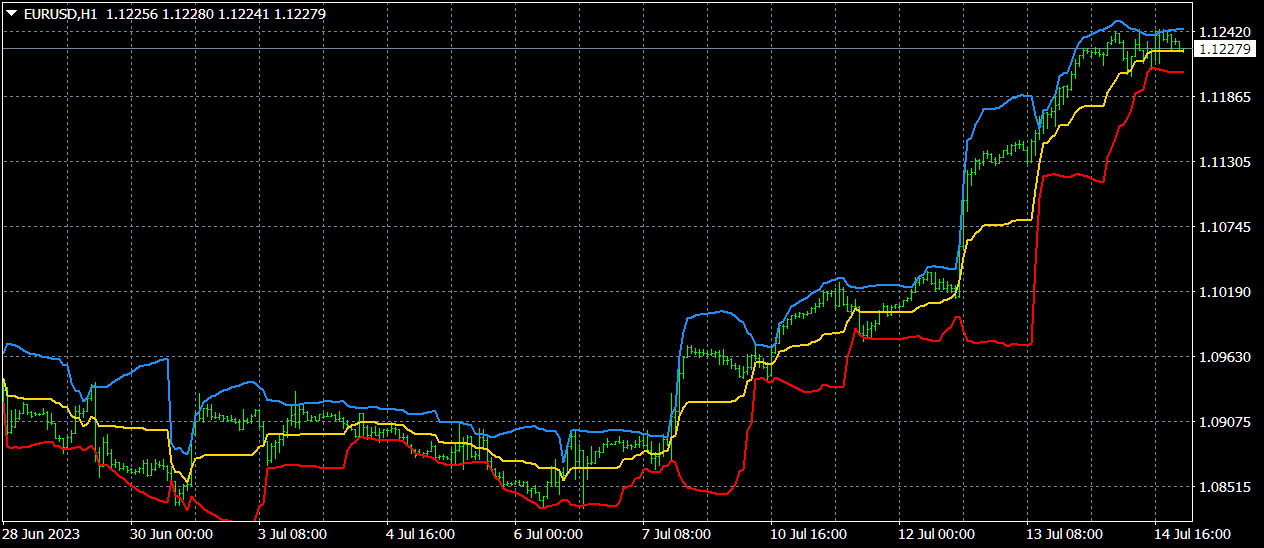
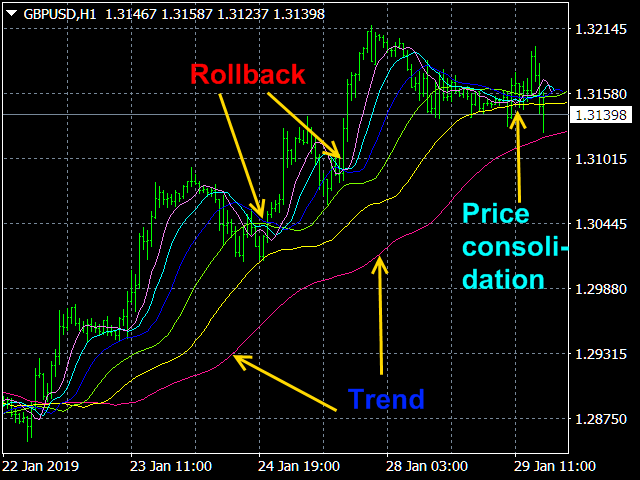
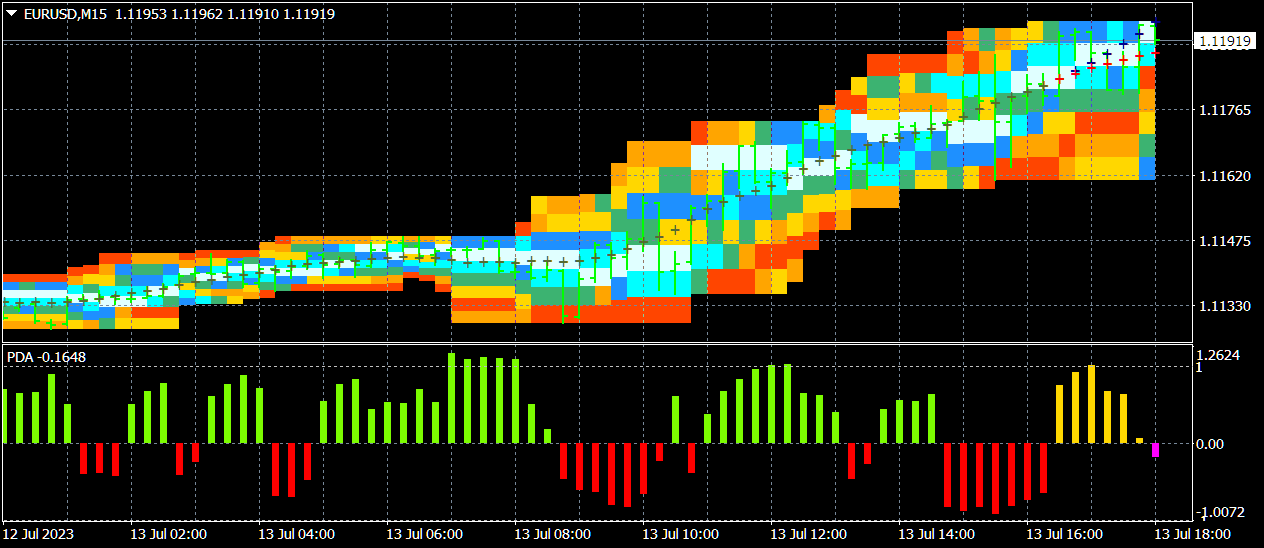
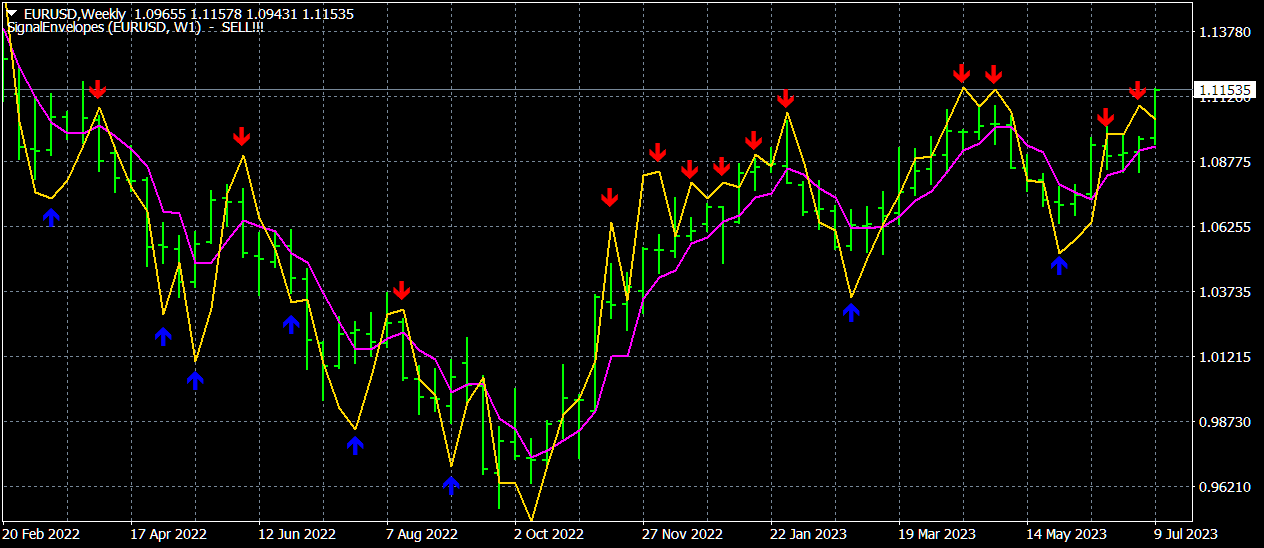
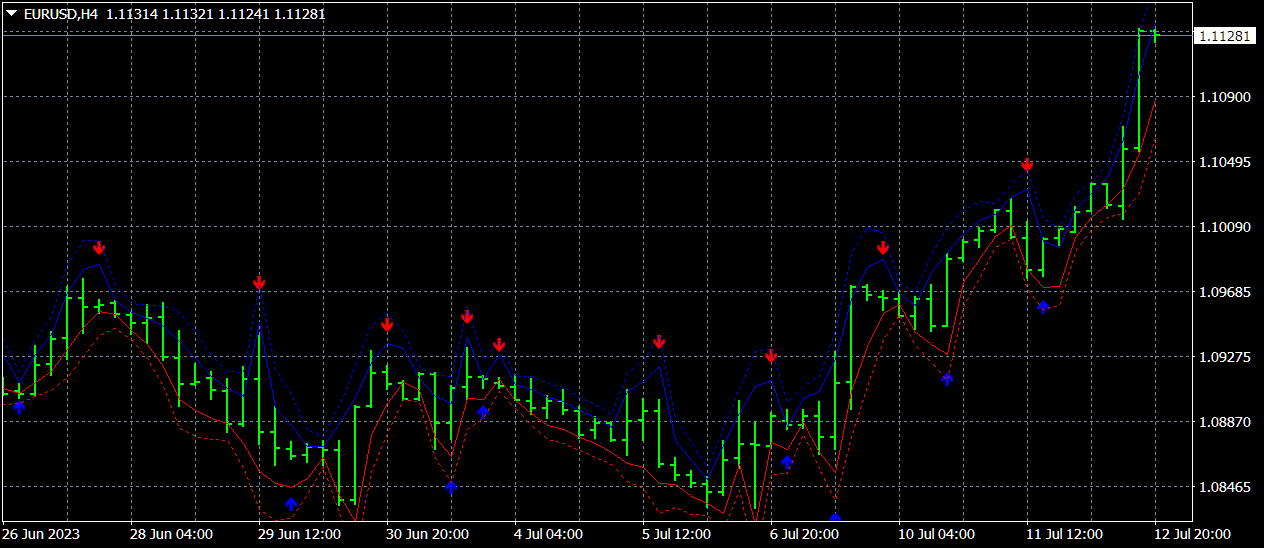
3) 🏆 Market research indicators (to clarify the microstructure of prices, build channels, identify differences between trend reversals and pullbacks).
----------------------------------------------------------------------------------------
☛ More information in the blog https://www.mql5.com/en/blogs/post/741637
----------------------------------------------------------------------------------------
💰 Presented products:
1) 🏆 Indicators with optimal filtering of market noises (for choosing points of opening and closing positions).
2) 🏆 Statistical indicators (to determine the global trend).
3) 🏆 Market research indicators (to clarify the microstructure of prices, build channels, identify differences between trend reversals and pullbacks).
----------------------------------------------------------------------------------------
☛ More information in the blog https://www.mql5.com/en/blogs/post/741637