Forum on trading, automated trading systems and testing trading strategies
Sergey Golubev, 2014.02.26 13:23
Multi currency EA may be based on some other systems. The only thing to do (except the system itself) is 'account protection feature'. Because those kind of EAs may be risky, and this risk is for whole the account (just my opinion sorry). But it also depends on how it will be coded for example.
============
As to correlation so I found the following
Video
MT5 CodeBase
Forum on trading, automated trading systems and testing trading strategies
Indicators: MFCS Currency Correlation Chart
Sergey Golubev, 2013.10.26 09:29
Currency Pairs Correlation in Forex Market: Cross Currency Pairs
As a forex trader, if you check several different currency pairs to find the trade setups, you should be aware of the currency pairs correlation, because of two main reasons:
1- You avoid taking the same position with several correlated currency pairs at the same time and so you do not multiply your risk. Additionally, you avoid taking the positions with the currency pairs that move against each other, at the same time. 2- If you know the currency pairs correlations, it may help you to predict the direction and movement of a currency pair, through the signals that you see on the other correlated currency pairs.
Now I explain how currency pairs correlation helps. Lets start with the 4 major currency pairs: EURUSD ; GBPUSD ; USDJPY and USDCHF.
In both of the first two currency pairs (EURUSD and GBPUSD), USD works as the money. As you know, the first currency in currency pairs is known as the commodity and the second one is the money. So when you buy EURUSD, it means you pay USD to buy Euro. In EURUSD and GBPUSD, the currency that works as the money is the same (USD). The commodity of these pairs are both related to two big European economies. These two currencies are highly connected and related to each other and in 99% of the cases they move on the same direction and form the same buy/sell signals. Just recently, because of the economy crisis, they moved a little differently but their main bias is still the same.
What does it mean? It means if EURUSD shows a buy signal, GBPUSD should also show a buy signal with minor differences in the strength and shape of the signal. If you analyze the market and you come to this conclusion that you should go short with EURUSD and at the same time you decided to go long with GBPUSD, it means something is wrong with your analysis and one of your analysis is wrong. So you should not take any position until you see the same signal in both of these pairs. Of course, when these pairs really show two different direction (which rarely happens), it will be a signal to trade EUR-GBP. I will tell you how.
Accordingly, USD-CHF and USDJPY behave so similar but not as similar as EURUSD and GBPUSD, because in USD-CHF and USDJPY, money is different. Swiss Franc and Japanese Yen have some similarities because both of them belong to oil consumer countries but the volume of industrial trades in Japan, makes JPY different.
Generally, when you analyze the four major currency pairs, if you see buy signals in EURUSD and GBPUSD, you should see sell signals in USDJPY. If you also see a sell signal in USD-CHF, then your analysis is more reliable. Otherwise, you have to revise and redo your analysis.
EURUSD, GBPUSD, AUDUSD, NZDUSD, GBPJPY, EURJPY, AUDJPY and NZDJPY usually have the same direction. Just their movement pattern sometimes becomes more similar to each other and sometimes less.
What do I prefer?
If I find a sell signal with EURUSD and GBPUSD and a buy signal with USDJPY, I prefer to take the short position with one of the EURUSD or GBPUSD because downward movements are usually stronger. I will not take the short position with EURUSD or GBPUSD and the long position with USDJPY at the same time, because if any of these positions goes against me, the other one will do the same. So I don’t double my risk by taking two opposite positions with two currency pairs that move against each other.
How to use the currency pairs correlation to predict the direction of the market?
When I have a signal with a pair, but I need confirmation to take the position, I refer to the correlated currency pairs or cross currency pairs and look for the confirmation. For example I see a MACD Divergence in USDCAD four hours chart but there is no close support breakout in USDCAD four hours or one hour chart. I want to take a short position but I just need a confirmation. If I wait for the confirmation, it can become too late and I may miss the chance. I check a correlated currency pair like USDSGD and if I see a support breakout in it, I take the short position with USDCAD. Now the question is why I don’t take the short position with USDSGD and I use its support breakout to go short with USDCAD? I do it because USDCAD movements are stronger and more profitable. I use USDSGD just as an indicator to trade USCAD.
It happens that you take a position with a currency pair, but it doesn’t work properly and you don’t know if it was a good decision or not. On the other hand, you don’t see any sharp signal on that currency pair to help you decide if you want to keep the position or close it. In such cases, you can check a correlated currency pair and look for a continuation or reversal signal. It helps you to decide about the position you have.
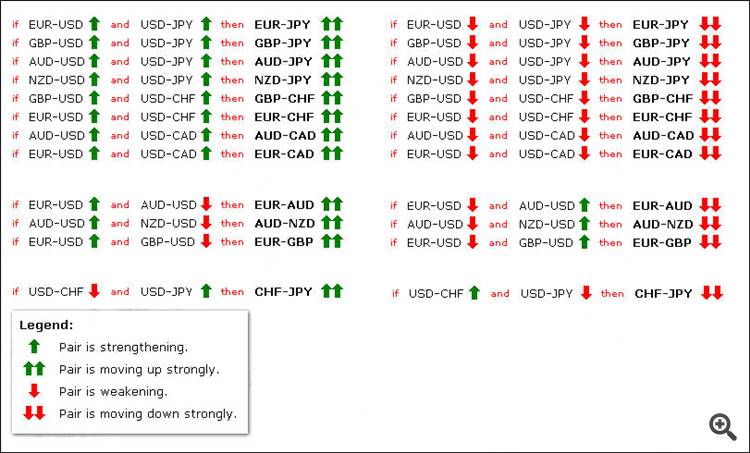
Sometimes, some correlated currency pairs don’t move in the way that they are supposed to move. For example EURUSD and USDJPY go up at the same time, whereas they usually move against each other. It can happen when Euro value goes up and USD value doesn’t have a significant change, but at the same time JPY value goes down, because of some reason. In these cases, you can use the below table to find and trade the currency pair that its movement is intensified by an unusual movement in two other currency pairs. In this example, if EURUSD and USDJPY go up at the same time, EURJPY will go up much stronger (see the below chart).
Or if EURUSD goes up and AUDUSD goes down at the same time, EUR-AUD goes up strongly.
Another important example: If EURUSD goes up and GBPUSD goes down at the same time, EURGBP goes up strongly. Maybe this is the most important case that we can trade based on this rule. It happens many times that EURUSD and GBPUSD move against each other and that is the best time to trade EURGBP. Now you know why EURGBP doesn’t move strongly most of the time. It is because EURUSD and GBPUSD move in the same direction most of the time. For example they go up at the same time and so EURGBP doesn’t show any significant movement because when both of the currencies of a currency pair go up or down at the same time, that currency pair doesn’t show any strong movement and direction (I hope you know why a currency pair goes up or down. It goes up when the first currency value goes up OR the second currency value goes down. For example EURUSD goes up, if Euro value goes up or USD value goes down. If this happens at the same time, then EURUSD goes up much stronger).
The below chart includes almost all of these unusual movements and their results on the third currency pair.
if EURUSD and USDJPY then EURJPY means if EURUSD and USDJPY go up at the same time, then EURJPY goes up much stronger.
Forum on trading, automated trading systems and testing trading strategies
Indicators: MFCS Currency Correlation Chart
Sergey Golubev, 2014.02.04 08:27
Trade Gold Using Currency Correlations (based on dailyfx article)
Talking Points:
- Correlations are useful to find direction for a variety of markets.
- Gold and the AUDUSD have a positive correlation.
- Once direction is found, plan your trading strategy for another asset.
Let’s get started!
Golds Correlation
When someone mentions Gold, the AUDUSD should immediately come to mind as a correlating asset. These assets are positively correlated, meaning they can be seen generally moving in the same direction. First this correlation works because both assets are priced in US Dollars. The AUD/USD pair represents Aussie Dollars priced in US Dollars. While gold is XAU/USD or gold priced in US Dollars per oz. When the US dollar gains strength, both assets tend to depreciate in value.
Secondly, the AUD has a high correlation to gold due to Australia’s extensive gold mining operations. As gold prices fluctuate, this increases or decreases the amount of funds transferred into AUD to make purchases of the metal. These transfers essentially change demand for the currency and can directly cause changes in the AUDUSD currency pair as well.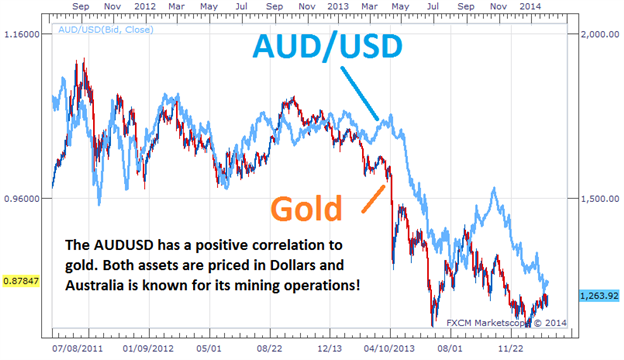
Trading the Correlation
The key to trading positively correlated assets, is finding a direction from one of the underlying assets before making a trading decision. If traders are seeing the AUDUSD push to lower lows, this could easily be the catalyst for a bearish bias on Gold. Conversely if gold is trending upwards, this can also be a signal of a new uptrend on the AUDUSD.
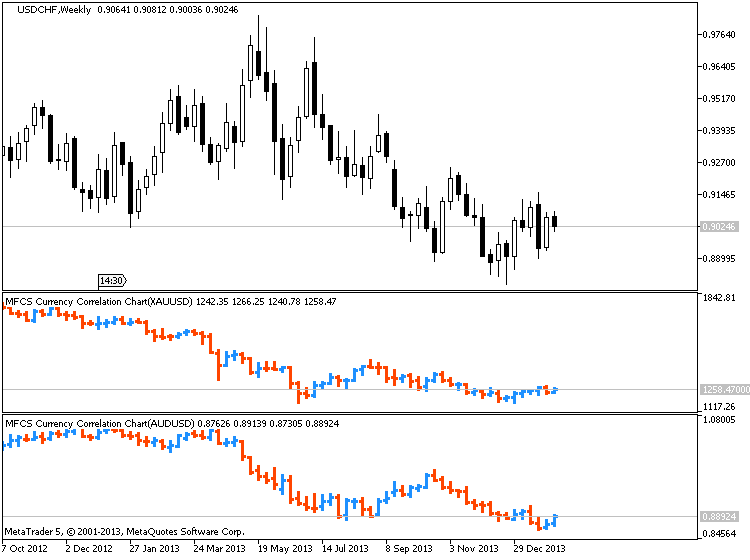
As you can see, this information is very useful to traders that have a general fundamental view of the market. If you have an opinion on Gold or the US Dollar this can be relayed into a trade idea. Often traders that are bullish on Gold choose to trade the AUDUSD instead of the metal itself. The Aussie Dollar carries a 2.50% banking rate, meaning traders can earn additional interest while executing a buy order on a positively correlated opinion of Gold. If a trader is bearish on the AUDUSD currency pair, traders can in turn sell gold to avoid accumulating interest on their trading balance.
Forum on trading, automated trading systems and testing trading strategies
Indicators: MFCS Currency Correlation Chart
Sergey Golubev, 2014.02.04 09:27
Australian Dollar Strongly Correlated to Gold, Silver, Steel Prices (based on this article)
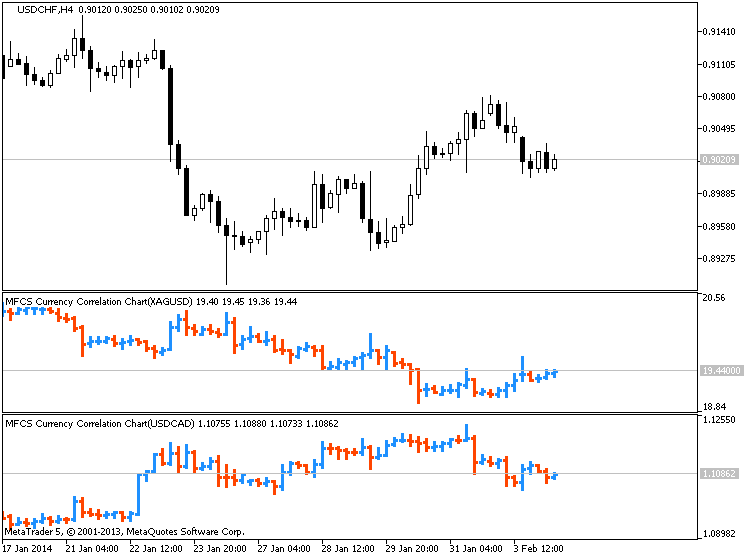
View forex correlations to the SPDR Gold ETF Trust (GLD), United States Oil Fund ETF (USO), SPDR Dow Jones Industrial Average ETF Trust (DIA), UK FTSE 100 Index, and IShares Silver Trust ETF (SLV) prices:
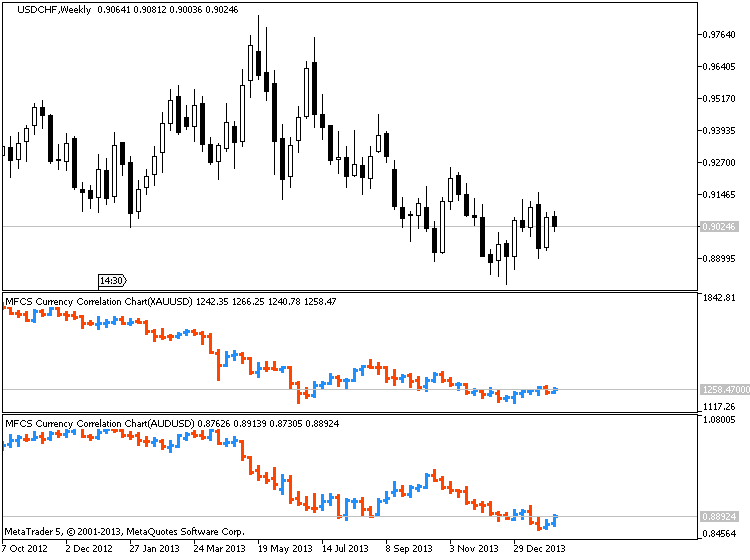
XAUUSD/AUDUSD :
XAGUSD/EURUSD :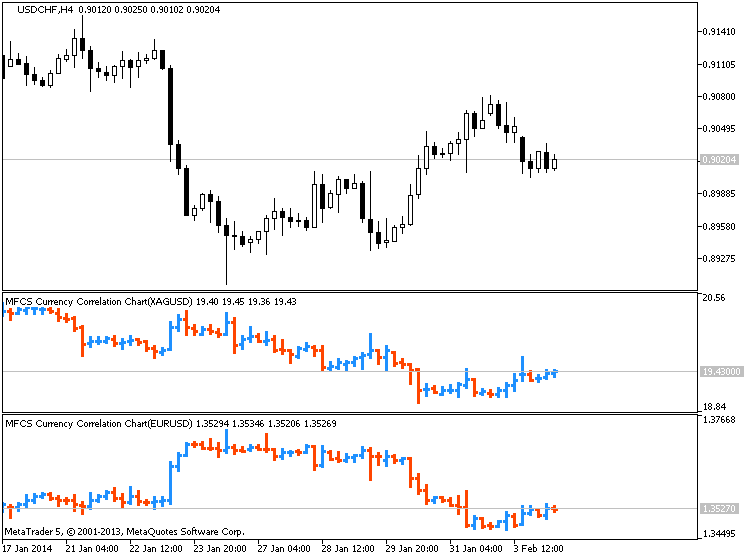
XAGUSD/USDCAD :
Hello,
Thanks for the very informative topic. I just started with correlations and feel this is a very important subject to master.
I don't get it completely when it is to avoid false breakouts or confirming an entry. Do I have simply to find an instrument that is usually correlated and verify the move is the same? Is it better to make this verification on more correlated instruments?
Heres some quick examples:
EURAUD * AUDUSD = EURUSD
1.4065 * 0.9335 = 1.3130
EURCAD / USDCAD = EURUSD
1.4273 / 1.0870 = 1.3130
EURCHF / USDCHF = EURUSD
1.2070 / 0.9192 = 1.3130
EURGBP * GBPUSD = EURUSD
0.7903 * 1.6613 = 1.3130
EURJPY / USDJPY = EURUSD
137.01 / 104.34 = 1.3130
Look guys, I spent 5 years developing EA strategies based on merely all types of correlations.., and would be very surprised if it can generate any reasonable sustainable profits in a long run.
Free advice - don't waste your time.
Look guys, I spent 5 years developing EA strategies based on merely all types of correlations.., and would be very surprised if it can generate any reasonable sustainable profits in a long run.
Free advice - don't waste your time.
are you sure you tried all the way's and there is no another ?!
- Free trading apps
- Over 8,000 signals for copying
- Economic news for exploring financial markets
You agree to website policy and terms of use
PRACTICAL USE of the Correlation Theory
This article is focused on explaining how currency correlations can be used in a very practical way. Our goal is not to dive into theory or theoretical models but show how correlations can help solve practical trading-related decisions.
The Forex Correlation Theory has many practical advantages such as confirming an entry, avoiding false break out, filtering worse setups, identifying which currency is trending, and reviewing crosses for a dynamic view. This article reviews the perfect correlation setup.
FILTERING OUT & CONFIRMING FOREX TRADES
The forex correlation theory can be used as a method to filter out trade setups which have a worse probability versus reward-risk ratio. The process how a trader can utilize the concept tool is as follows:
EUR/USD – long
GPB/USD – long
NZD/USD – long
AUD/USD – long
USD/CAD – short
USD/JPY – long
5 of the six are going in the same direction, the USD/JPY in this case is in negative correlation to the other five.
For this trade – USP/JPY long with a stop loss of 40 pips and a limit of 60 pips.