Indicators: Correlate
You are a genious coder.
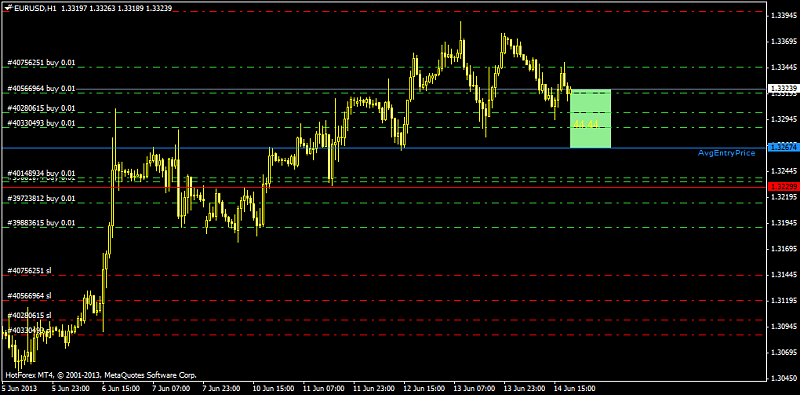
Similar to this curve can you please code an manual indicator which can print on the chart as well as create a curve like price, averaged prices, breakeven point, stop loss, all input by a user.
The idea is to get a table for breakeven points either printed on the chart or as trend lines in sub-window
(a) position/lots averaging to reduce breakeven and cut loss
(b) position/lots pyramiding to increase gains
I have found the following code which works in real-time.
extern bool ShowMarketPrice = true;
extern color   ColorMarketPrice     = OrangeRed;

extern bool    ShowAvgEntryPrice    = true;
extern color   ColorAvgBuyEntry     = LimeGreen;
extern color   ColorAvgSellEntry    = Orange;

extern bool    ShowStopLoss         = true;
extern double  RiskFactor           = 5;           // Risk Factor(in %) for StopLoss calculation
extern color   ColorBuyStopLoss     = DeepSkyBlue;
extern color   ColorSellStopLoss    = LightCoral;

extern color   SwapColorLong        = Lime;
extern color   SwapColorShort       = Red;

extern bool    ShowProfit           = true;
extern string  FontName             = "Arial Black";
extern int     FontSize             = 10;
extern color   ColorProfit          = DarkSalmon;

extern bool    ShowLineLabels       = true;
extern bool ShowSwapInfo = true;
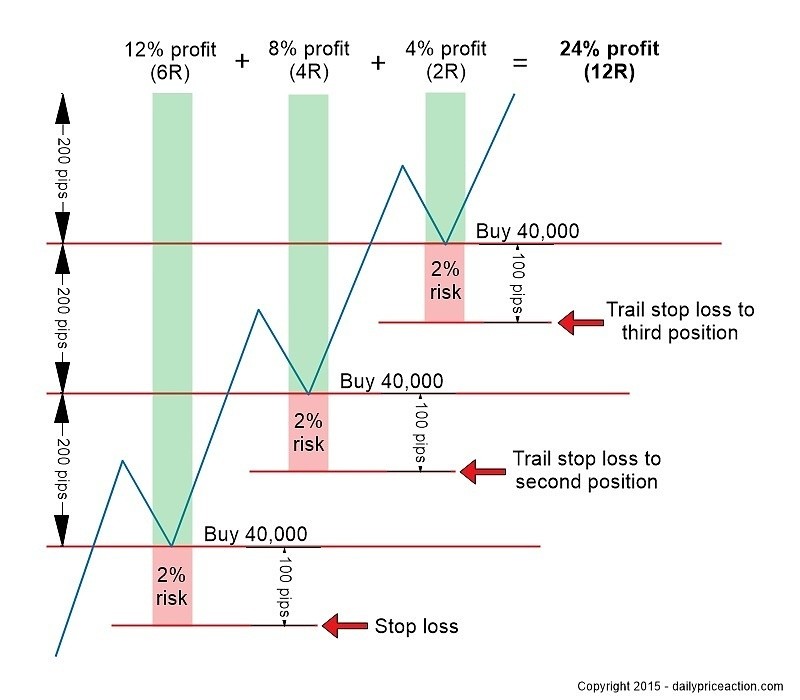
An excellent article on vertical grids in trending markets.
<Deleted>
They are a play on dollar cost averaging as they aim to achieve an average entry price over a certain time interval. Thereby the trader has a higher chance of being able to profit from a rising (falling trend) which in the short term may be highly volatile.
This indicator has issues. I am not able to get the backward values for it. I try to gather data for my analysis, but I got zeroes in the buffer output. Even the graph is not completed. Please check the following image:

What a great indicator... Don't understand why it has 4 stars. Thanks very much, Ernst! :)
Just curious whether you consider doing HTF version of it? (to make it more simple, HTF version isn't needed for all currencies simultaneously displayed, only for the current chart currencies)
In any case, you have done super job, and it needs to be rewarded.
Best Regards,
Andrei.
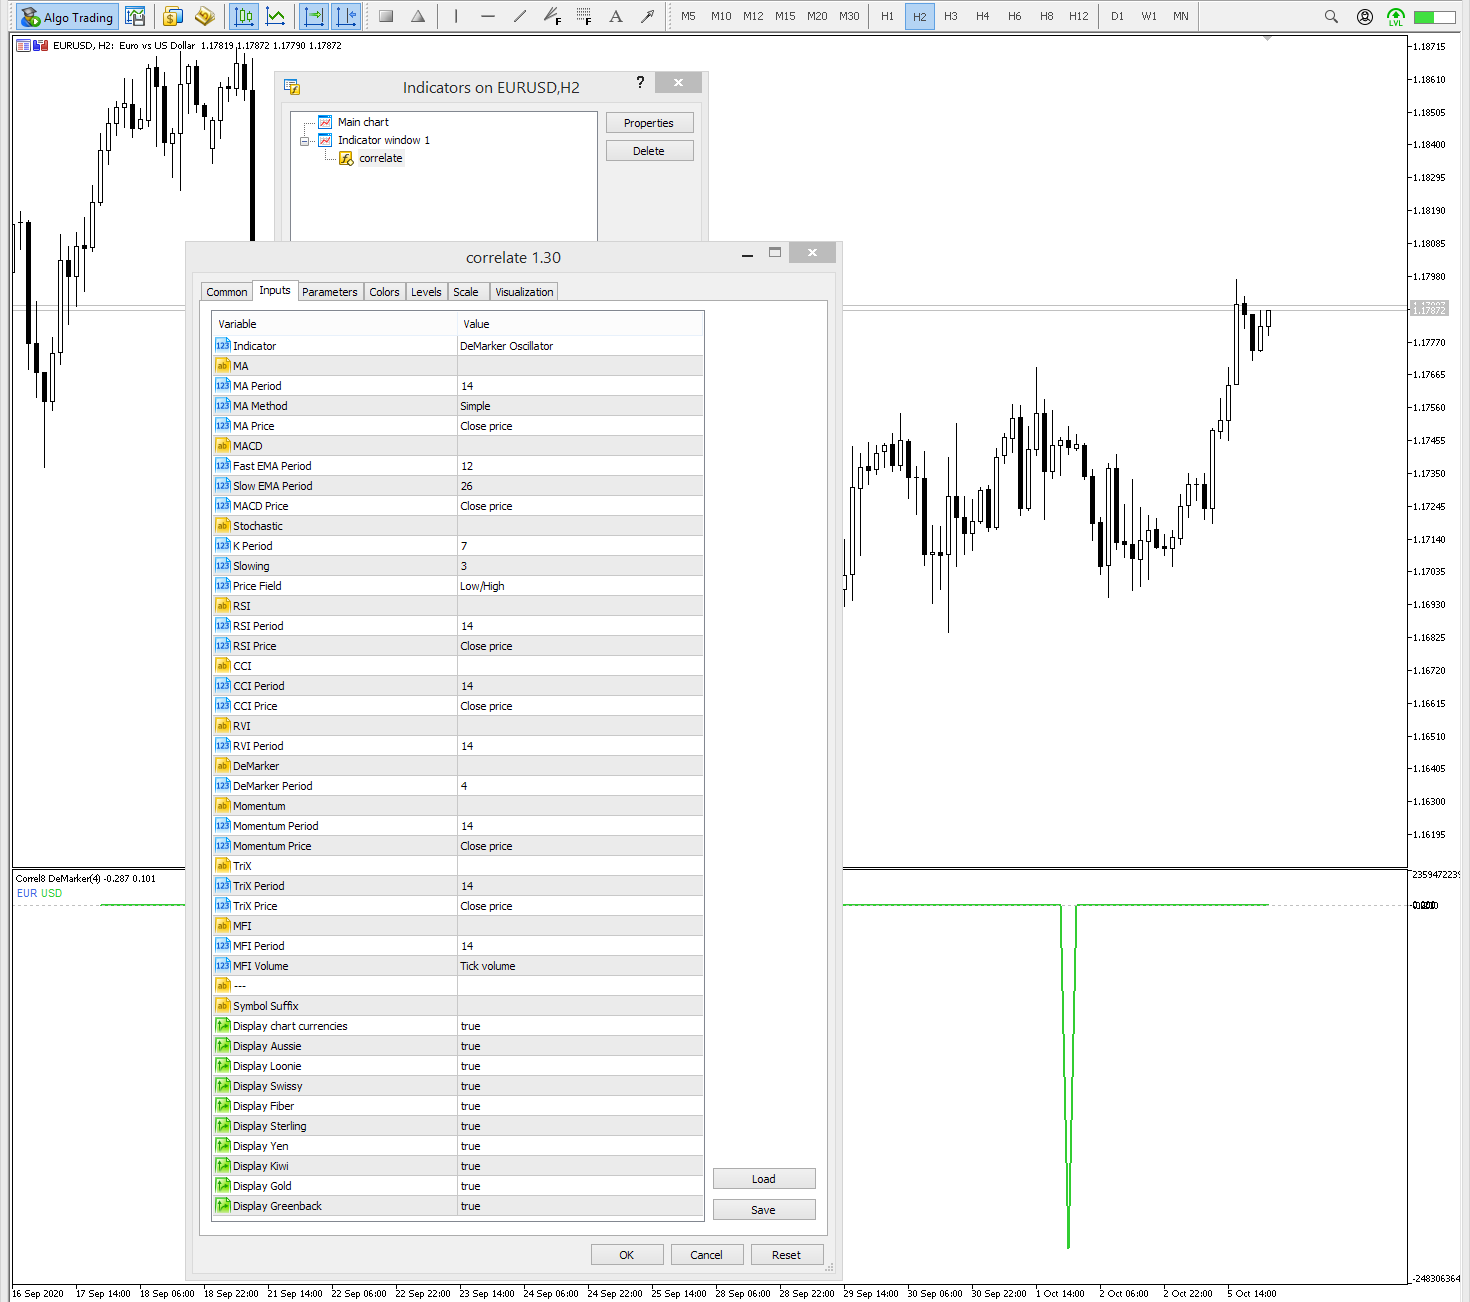
When DeMarker Osc selected and period 4 used, indicator isn't displaying on H2. Though, it's fine on all other timeframes. Thank you.
- Free trading apps
- Over 8,000 signals for copying
- Economic news for exploring financial markets
You agree to website policy and terms of use
Correlate:
The indicator shows correlation between currencies.
Author: pipPod