Discussing the article: "Hilbert-Schmidt Independence Criterion (HSIC)"
Please explain my stumbling block. It turns out that HSIC will show the dependence for any classical function Y=F(X1, X2, ...)?
Probably not for any of them, because the dependence may be very weak (due to strong noise, for example) and then it may not catch it. But in general, if there is something significant in the data, the test detects it.
I took data of a different nature.
// Y is the bars of the symbol, X1 is the bars before Y, X2 is the bars before X1.
bool Fill( double &X1[], double &X2[], double &Y[], const int Size = 1000,
          const datetime Time = 0, const string Symb = NULL )
{
  int Pos = iBarShift(Symb, PERIOD_CURRENT, Time ? Time : TimeCurrent());

  return((CopyClose(Symb, PERIOD_CURRENT, Pos, Size, Y) == Size) &&
         (CopyClose(Symb, PERIOD_CURRENT, Pos += Size, Size, X1) == Size) &&
         (CopyClose(Symb, PERIOD_CURRENT, Pos += Size, Size, X2) == Size));
}
In the proposed rearrangement script I made this substitution.
if (SData == Nonlinear_dependence){
/*
double x1 [];
MathRandomUniform(-5,5,data_,x1);
double x2 [];
MathRandomUniform(-5,5,data_,x2);
double NormD[];
MathRandomNormal(0,0.1,data_,NormD);
double y[];
ArrayResize(y,data_);
for (int i=0;i<data_;i++){
y[i] = pow(x1[i],2)*cos(M_PI*x2[i]) + NormD[i]; // Y = X1^2 * cos(pi*X2) + Noise
}
*/

double x1[], x2[], y[];

Fill(x1, x2, y, data_);
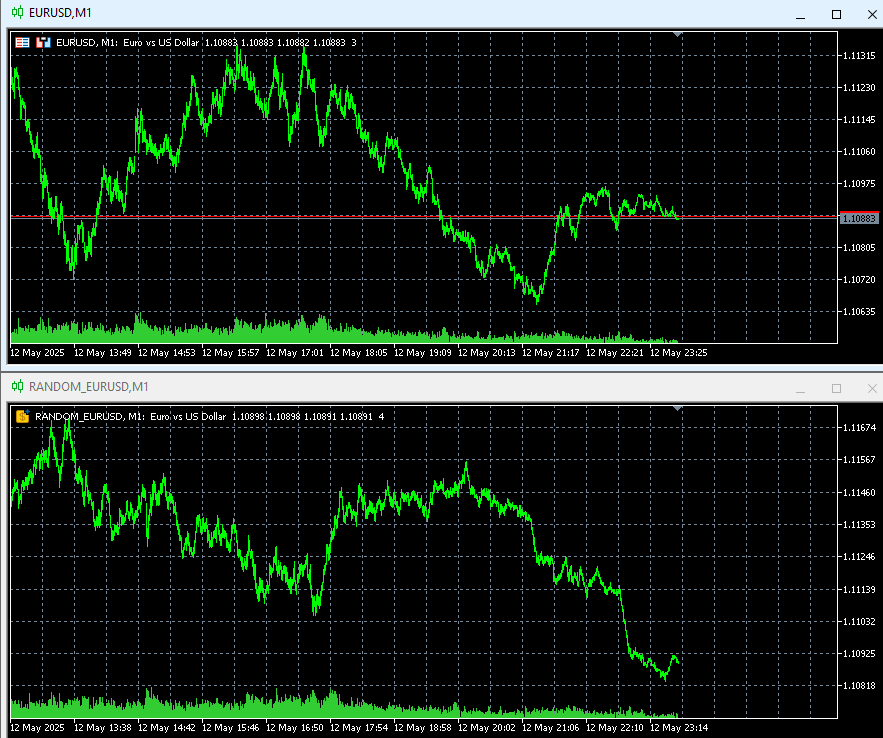
The results are for EURUSD.
Test6 (EURUSD,M1)       Коэффициент корреляции (X1, Y) = 0.3757
Test6 (EURUSD,M1)       Коэффициент корреляции (X2, Y) = -0.4280
Test6 (EURUSD,M1)       ----------------Nonlinear_dependence-------------
Test6 (EURUSD,M1)       Время выполнения: 12.688 seconds
Test6 (EURUSD,M1)       -----------------------------------
Test6 (EURUSD,M1)       Number observations 1000
Test6 (EURUSD,M1)       HSIC: 0.01050641
Test6 (EURUSD,M1)       p-value: 0.0000
Test6 (EURUSD,M1)       Critical value: 0.0010
Test6 (EURUSD,M1)       Отвергаем H0: Наблюдения зависимы
Then I created a custom symbol on the basis of random increments and ran it on it.
Test6 (RANDOM_EURUSD,M1)        Коэффициент корреляции (X1, Y) = -0.6103
Test6 (RANDOM_EURUSD,M1)        Коэффициент корреляции (X2, Y) = -0.4954
Test6 (RANDOM_EURUSD,M1)        ----------------Nonlinear_dependence-------------
Test6 (RANDOM_EURUSD,M1)        Время выполнения: 12.656 seconds
Test6 (RANDOM_EURUSD,M1)        -----------------------------------
Test6 (RANDOM_EURUSD,M1)        Number observations 1000
Test6 (RANDOM_EURUSD,M1)        HSIC: 0.00900188
Test6 (RANDOM_EURUSD,M1)        p-value: 0.0000
Test6 (RANDOM_EURUSD,M1)        Critical value: 0.0009
Test6 (RANDOM_EURUSD,M1)        Отвергаем H0: Наблюдения зависимы
Why is there dependence in the second case? Roughly speaking, there is supposedly a dependence between three vectors, which are cumulative sums of a random variable.
...
Why is there a dependence in the second case? Roughly speaking, there is supposedly a dependence between three vectors that are cumulative sums of a random variable.
It (dependence) is definitely there, because a rather simple PRNG is used (I assume you use a standard one, you can check it with Mersenne vortex, for example).
Another question is how strong the dependence is, I am not clear with this, I ask the author to explain how to interpret the obtained metrics correctly.
Took data of a different nature.
In the proposed rearrangement script I made this substitution.
Results on EURUSD.
Next, I created a custom symbol based on random increments and ran it on it.
Why is there a dependence in the second case? Roughly speaking, there is supposedly a dependence between three vectors, which are cumulative sums of a random variable.
It (the dependence) is definitely there, as it uses a fairly simple PRNG (I assume you use a standard one, you can check it on Mersenne's Vortex, for example).
Another question is how strong the dependence is, I have some confusion with it, I ask the author to explain how to interpret the obtained metrics correctly.
- Free trading apps
- Over 8,000 signals for copying
- Economic news for exploring financial markets
You agree to website policy and terms of use
Check out the new article: Hilbert-Schmidt Independence Criterion (HSIC).
The main task of a trader when working with financial instrument quotes is to create a trading system (EA) with a positive mathematical expectation. When designing such systems, it is often assumed that there are hidden dependencies in the data used for training and subsequent trading. However, the question of statistical testing of this assumption is usually not considered. It is believed that an indirect answer can be obtained through testing results on out-of-sample data.
Meanwhile, a statistically sound answer to the question of whether there is a relationship between the features and the target variable is of key importance. A positive answer supports the use of predictive models, while a negative answer makes one wonder: what exactly is the algorithm trying to predict?
In mathematical statistics, the question of whether a probabilistic dependence exists between random variables is answered by independence tests. One such criterion is the HSIC statistical test, a powerful non-parametric method developed in 2005 by statistician Arthur Gretton.
Unlike the correlation coefficient, which only identifies linear relationships, HSIC is capable of detecting both linear and non-linear relationships. Due to this, it is widely used in machine learning for feature selection, causal analysis, and other tasks. In this article, we will analyze the operating principle of HSIC and implement it in the MQL5 environment.
Author: Evgeniy Chernish