Is there a pattern to the chaos? Let's try to find it! Machine learning on the example of a specific sample. - page 21
You are missing trading opportunities:
- Free trading apps
- Over 8,000 signals for copying
- Economic news for exploring financial markets
Registration
Log in
You agree to website policy and terms of use
If you do not have an account, please register
I cut two more years from this sample and the average on Exam has already become -485 (it was 1214) and the number of models that passed the 3000 point limit has become 884 (it was 277 last time).
However, the results on the test sample deteriorated from an average of 2115 to 186 points, i.e. significantly. What is this - are there fewer examples in the train sample similar to the test sample?
The average number of trees decreased to 7 from 10.
The zero break on the graph has shifted the balance distribution to the centre.
What is the basis for the statement that the result should be similar to the test? I assume that the samples are not homogeneous - there is no comparable number of similar examples in them, and I think that the probability distributions over quanta differ a bit.
Traine. I'm talking about data where there are good patterns. If you feed 1000 variants of the multiplication table into training, new variants that never match the traine (but inside the boundaries of the traine) will also compute quite well. 1 tree will give the closest variant, a random forest will average a hundred closest ones and most likely give an answer more accurate than from 1 tree.
If predictors with regularity can be found for the market, then OOS will also be similar to a trace. But not like now more than half of the models are minus and a third are plus. All successful models became that way by chance, from random seed.
Seed should only slightly change the success of the model and in general they should all be successful. Now it turns out that no patterns are found (either overtraining/undertraining).
It is involved only for controlling the stopping of training, i.e. if there is no improvement on test while training on train, then training stops and trees are removed to the point where there was the last improvement on the test model.
It is then clear why tests are also good. It's essentially fitting to the test. I stopped doing that for 1 training. I do valving forwards, glue all the OOCs together, then choose the best model hyperparameters (depth, number of trees, etc) from the many variants of glued OOCs. I assume that the Exam will be about the same as the selected gluing of all OOS. In that variant over 5 years, I have re-training once a week - that's hundreds of OOS training and chunks.
Apparently I didn't clearly indicate the sample I used - this is the sixth (last) sample from the experiment described here, so there are only 61 predictors.
primitive strategies, especially in flat market areas.Well, you picked these 61 out of 5000+. My total number is less and the number of selected ones is less. And when adding 1 at a time, after 3-4 selected ones, further addition of signs only worsens the result on the OOS.
In general, I can add more predictors, because now only with 3 TFs they are used, with a few exceptions - I think a couple of thousand more can be added, but whether all will be used properly in training is doubtful, given that 10000 variants of seed for 61 predictors give such a spread....
And of course you need to pre-screen the predictors, which will speed up the training.
If they are all about the same, it is unlikely that something seriously improving the result will be found. You can try completely new data or unique indicators.
Preliminary screening is also a long job, adding one at a time is many times longer, even up to 3 features, and if up to 10, it is many days. But there is no sense in it, after 3-4 features there is usually no improvement. But occasionally there are, but the increase is small. Breakthroughs were not found there (in my experiments, someone may find).
It is logical that outliers are outliers, I just think that these are inefficiencies, which should be learnt by removing white noise. In other areas, simple primitive strategies often work, especially in flat market areas.
The bottom picture is profitable, but in 5 years there were only 2 periods in 2017 with strong growth (apparently there was a strong predictable trend), the model made the most money on these 2 periods. And it would be nice to have uniform growth over time. I would turn off such a model after a month of inactivity.
You can of course make an EA - waiting for white swans. But I would prefer active trading.
Cut two more years from this sample and the average on Exam has already become -485 (was - 1214), and the number of models breaking the 3000 point limit has become 884 (was 277 last time).
However, the results on the test sample deteriorated from an average of 2115 to 186 points, i.e. significantly. What is this - are there fewer examples in the train sample similar to the test sample?
The average number of trees decreased to 7 from 10.
The zero break on the graph has shifted the balance distribution to the centre.
Can you post the files from the first post, I also want to try one idea.
Traine. I'm talking about data where there are good patterns. If you submit 1000 variants of multiplication table for training, new variants that never coincide with the traine (but inside the boundaries of the traine) will also be well computed. 1 tree will give the closest variant, a random forest will average a hundred closest ones and most likely give an answer more accurate than from 1 tree.
If predictors with regularity can be found for the market, then OOS will also be similar to a trace. But not like now more than half of the models are minus and a third are plus. All successful models became like that by accident, from a random seed.
Seed should only slightly change the success of the model and in general they should all be successful. Now it turns out that no patterns are found (either overtraining/undertraining).
No one is arguing that with good data everything will most likely work perfectly. But, you can't get such data, so you have to think what you can squeeze out of what you have.
The fact that it is possible to get effective models randomly, which will be effective on new data, makes me wonder how to reduce this randomness, i.e. whether there are any regular metrics for quantum segments, on which the model was consistently built. I.e. we are talking about additional metrics other than greed on the target. If such dependencies can be established, then models can also be built with a higher probability of success. Of course, this should work on different samples.
Then I can see why the tests are good too. It's essentially fitting to the test. I've stopped doing that for 1 study. I do valving forwards, glue all the OOCs together, then choose the best model hyperparameters (depth, number of trees, etc) from the many variants of glued OOCs. I assume that the Exam will be about the same as the selected gluing of all OOS. In that variant over 5 years, I have retrained once a week - that's hundreds of OOS training and chunks.
The main thing is not to separate the last exam section.
Fitting hyperparameters and evaluating the result on what? I think it is the same fitting with an element of averaging, if we follow your logic.
The logic in CatBoost is that if it is impossible to improve the model (by Logloss), then there is no point in further training. In this case there are no guarantees that the model turned out to be good, of course.
Well those 61 you picked out of 5000+. I have both the total number and the number of selected ones. And when adding 1 at a time, after 3-4 selected ones, further addition of features only worsens the result on OOS.
No, I didn't choose them - I took them from the model when training on all predictors.
Look, I generally consider the predictor as a set of quantum segments. And, for this reason I select quantum segments, in general I can even decompose all predictors into binary ones - the result is slightly worse, but comparable. Perhaps for binary discharged predictors a special method of training is required.
If they are all about the same, it is unlikely that anything seriously improving the result can be found already. You can try completely new data, or unique indicators.
What do you mean by "about the same", I assume you are talking about metrics or what? Of course, you can try different data, take a different tool for example.
Pre-screening is also a long job, adding one by one takes many times longer, even up to 3 features, and if up to 10 it takes many days. but there is no point, after 3-4 features there is usually no improvement. But occasionally there are, but the increase is small. Breakthroughs were not found there (in my experiments, someone may find).
The variant you are talking about is a long game, that's why I don't play it (well, I don't have full automation). But, I do not agree that there is no effect - I have done dropouts in groups, with the reduction of groups - the result was positive. But I still attribute these actions to fitting or randomness - there is no justification for the choice of predictors.
The bottom figure is profitable, but in 5 years there were only 2 periods in 2017 with strong growth (apparently there was a strong predictable trend), the model made the most money on these 2 periods. And it would be nice to have uniform growth over time. I would switch off such a model after a month of inactivity.
Of course, you can make an Expert Advisor - waiting for white swans. But I would prefer active trading.
That's why I am in favour of using sets of models, as I understand that each can catch its own not frequent patterns.
Well in general, the aim is for the error on the traine and test to be about the same. Here your Exam is moving towards the traine and test i.e. up, and they are towards the test i.e. down. Overtraining goes down.
And by what metric are they similar?
Look, for example, we take the Precision metric, subtract this indicator on the test sample from train, - we get delta (y-axis), and by x we look at the profit on the exam sample.
There is no special dependence, or what?
Below are two metrics for each sample - the data are taken as new trees are added to the model.
Here are the characteristics of this model
And here are the metrics of another model, with losses on two samples
Here are the characteristics of the model
It is inconvenient to reply in forum style, clicking reply many times. Below my answers are highlighted in colour.
Факт того, что возможно получить эффективные модели случайным образом, которые будут эффективны на новых данных, меня заставляет задуматься - как снизить эту случайность, т.е. есть ли какие то закономерные метрики у квантовых отрезков, по которым была последовательна построена модель. Т.е. речь о дополнительных метриках, кроме жадности по целевой. Если удастся установить такие зависимости, то и модели можно строить с большей вероятностью успешными. Конечно, это должно работать на разных выборках.
> Watched a long time ago how quanta are built, basic variants. First, the column is sorted.
1) by range, even step (e.g. from 0 to 1 with value step exactly through 0.1 totalling 10 quanta 0.1, 0.2, 0.3 ... 0.9)
2) percentile - i.e. by the number of examples. If we divide by 10 quanta, then in each quantum we put 10% of the number of all rows, if there are many doubles, then some quanta will be more than 10%, because the doubles should not fall into other quanta, for example, if the doubles are 30% of the sample, then in this quantum they will all fall. Depending on the number of samples in each quantum, the distribution could be 0.001, 0.12,0.45,0.51,0.74, .... 0.98.
3) there is a combination of both types
So there is nothing super clever about constructing quanta. I've made both of these quantisation methods for myself. And as always I did something the way I think is better. Maybe I made a mistake. And I usually do calculations without quantisation, but on float data.
If you make all predictors binary, there will be only 2 quantums, one has all 0's and the other has all 1's.
You fit hyperparameters and evaluate the result on what? I think it's the same fitting with an averaging element, if you follow your logic.
> I look at balance charts and drawdowns. I haven't been able to automate the selection yet. Yes the fit is for better OOS gluing. But not the model itself (i.e. not the trace), but the selection of the best hyperparameters of the model.
What do you mean "about the same", I assume you are talking about some metrics or what? Of course, you can try other data, take another tool for example.
> All of which are made on prices and mashups.
On an old question.
What is the basis for the statement that the result should be similar to the train? I'm assuming that the samples are not homogeneous - there is no comparable number of similar examples, and I think that the probability distributions of the quanta are slightly different.
> Examples here https://www.mql5.com/ru/articles/3473
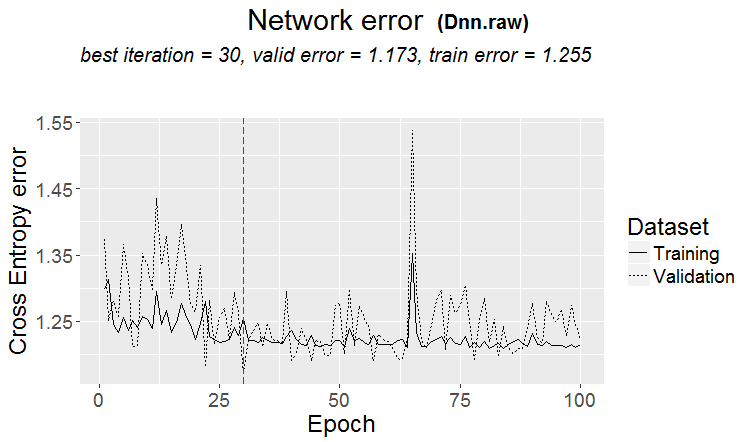
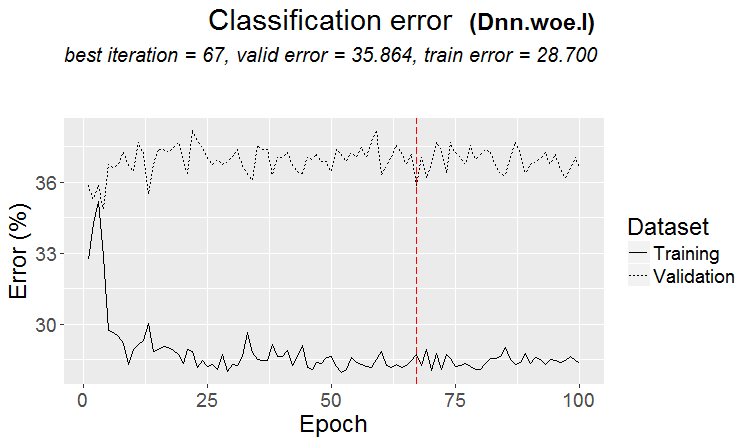
A good variant is when a pattern is found: ternary and test have almost the same error
On the markets more often something like this happens: a good test, but after some step of training (in the figure after the 3rd step) retraining starts and the test error starts to grow. The pictures refer to neural networks, but there is also something like this with forests and boosts, when the model becomes overtrained.
What metric are they similar by?
But that doesn't mean your metrics are bad.
So there is nothing super clever in quantum construction. I have made both these quantisation methods for myself. And as always I did something the way I think is better. Maybe I made a mistake. And I usually make calculations without quantisation, but using float data.
Of course there are different methods, I use about 900 quantum tables now.
The point is not in the method, but in choosing the range of predictor on which the average value of binary target is higher than on the sample (now I put a minimum of 5% plus criteria on the number of examples - also a minimum of 5%), which indicates useful information in the predictor. If there is no such information, you can hope that it will appear in a few splits, but I think it is less likely.
In fact, it happens that there are 1-2 such plots, rarely there are really many. And here you can either take only these plots, or just take predictors with such plots, choosing the best quantum table.
Personally, I saw that predictors, at least mine, do not have smooth transitions of probability, but rather it happens discontinuously and changes to the opposite deviation, i.e. it was +5 and immediately became -5. I even think that if these probabilities are ordered, the model will be easier to train, as they are trained on ranges. This is the reason why it makes sense to exclude uninformative areas and separate the conflicting ones.
If you make all predictors binary, there will only be 2 quanta, one has all 0's and one has all 1's.
Actually there will be one - 0,5 :) But, this way you can decompose the predictor into useful (containing potentially useful information) ranges.
> Looking at balance charts and drawdowns. Automating the selection hasn't worked out yet. Yes fitting - for the best OOS gluing. But not the model itself (i.e. not the trace), but the selection of the best hyperparameters of the model.
Well, it's understandable, but not canonical - model metrics are also important, I think.
> All which are done on prices and mashups.
In theory yes, and that if you use neural networks, but in fact - no - too complex dependencies should be searched with different calculations, for this simply do not have the computing power of ordinary users.
On an old question.
> Examples here https://www.mql5.com/ru/articles/3473
A good variant is when a pattern is found: ternary and test have almost the same error
On the markets more often something like this happens: a good test, but after some training step (in the figure after the 3rd one) retraining starts and the test error starts to grow. The pictures refer to neural networks, but there is also something like this with forests and boosts, when the model becomes overtrained.
The regularity is always found - that's the principle - the question is whether this regularity will continue to appear or not.
I don't know what kind of sample you had. I have had cases when test learns faster than train, but more often it happens the other way round and there is a noticeable delta between them. In ideal conditions the difference will be small, of course.
I can say for sure that the models are undertrained just because the samples are not very similar and training stops when there is no improvement.
One day I will show you how the retrained sample looks graphically - it is two bulges separated by corners....
Cut the training sample in half more.
There are only 306 models, the average profit by exam is -2791 points.
But I got this model
With these characteristics
Mat expectation has certainly fallen, but Recall has grown twice - due to this and such a graph with a large number of deals.
Such predictors were used:
And there are 9 less of them than in the sample - I will try to take only them and train on the whole sample (on all train lines).
Splits are made only up to the quantum. Everything inside the quantum is considered to be the same values and are not split further. I don't understand why you are looking for something in quantum, its main purpose is to speed up calculations (secondary purpose is to load/generalise the model so that there is no further splitting, but you can just limit the depth of float data) I don't use it, I just make models on float data. I did quantisation on 65000 parts - the result is absolutely the same as the model without quantisation.
Personally, I saw that predictors, at least mine, do not have smooth transitions of probability, but rather it happens abruptly and changes to the opposite deviation, i.e. it was +5 and immediately became -5.
Also noticed something like this. Increasing the depth by 1 dramatically changes the profitability, sometimes in + sometimes in -.
In fact, there will be one - 0.5 :) But, this way it will be possible to split the predictor into useful (containing potentially useful information) ranges.
There will be 1 split that will divide the data into 2 sectors - one has all 0's, the other has all 1's. I don't know what is called quanta, I think that quanta is the number of sectors obtained after quantisation. Perhaps it is the number of splits, as you mean.