Discussing the article: "Creating a mean-reversion strategy based on machine learning"
Not critical at all, but still would like to have no wargaming out of the box.
The main difference between the Savitsky-Golei filter and the usual moving average is that it does not lag relative to prices.
It is a mistake to use this filter online on non-stationary time series, as the last values may be redrawn, but it is quite suitable for marking trades on existing data.
Why not ZZ?
True, I found a small explanation.
This markup has its own peculiarities:
- not all marked trades are profitable, because further price changes, after crossing the ribbons, do not always go in the opposite direction. Therefore, there may be examples that are falsely marked as buy or sell.
- In theory, this disadvantage is compensated by the fact that the markup is homogeneous and non-random, and therefore falsely marked examples can be considered as errors in training or in the trading system as a whole, which may result in less retraining at the output.
Maybe I'm superficially seeing things, but isn't clustering by slope a peek into the future?
I thought that market clustering should be done by real-time features: time, sliding, etc.
Does the appropriate cluster include what is to the right of these 10 bars or these very bars?
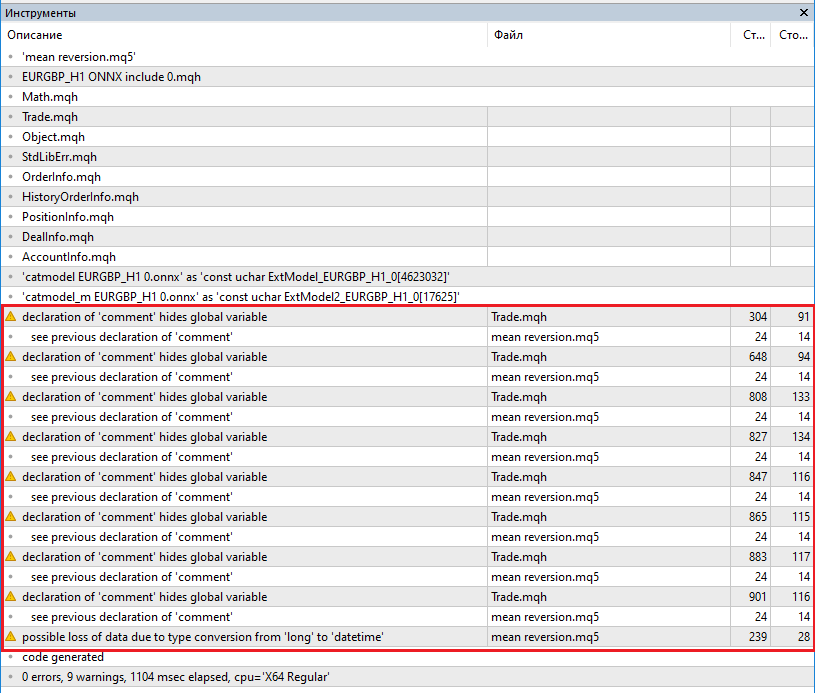
- catmodel EURGBP_H1 0.onnx — основная модель, которая дает сигналы на покупку и продажу
- catmodel_m EURGBP_H1 0.onnx — дополнительная модель, которая разрешает или запрещает торговлю
Finished reading to this point and didn't understand where the origin.
- Free trading apps
- Over 8,000 signals for copying
- Economic news for exploring financial markets
You agree to website policy and terms of use
Check out the new article: Creating a mean-reversion strategy based on machine learning.
Before clustering anything, we need to decide why we need to do it at all. Let's imagine a price chart that has a trend, a flat, periods of high and low volatility, various patterns, and other features. That is, the price chart is not something uniform, where the same patterns are present. One could even say that at different periods of time there are or may be different patterns that disappear at other time intervals.
Clustering allows you to divide the original time series into several states based on certain characteristics, so that each of these states describes similar observations. This can make the task of building a trading system easier, since training will occur on more homogeneous, similar data. At least, that is how one can imagine it. Naturally, the trading system will no longer operate over the entire historical period, but rather over a selected portion of it, made up of different points in time, the values of which fall within a given cluster.
After clustering, only selected examples can be labeled, that is, assigned unique class labels, to build the final model. If a cluster contains homogeneous data with similar observations, then its labeling should become more homogeneous and, subsequently, more predictable. You can take multiple clusters of data, label each of them separately, then train machine learning models on the data from each cluster and test them on the training and test data. If a cluster is found that allows the model to learn well, that is, to generalize and predict on new data, the task of building a trading system can be considered practically completed.
Author: dmitrievsky