Indicators: Bull Bear Volume
The code that is uploaded is a bit messy. But I don't care now because of the fact that it was difficult to upload this (due to the validator).
If you want to make the total volume (white histogram) on multi-timeframe, then set MTF to true and turn these into inputs:
bool use_multi_timeframe = false;  // Enable multitimeframe mode
ENUM_TIMEFRAMES timeframe  = PERIOD_D1; // Timeframe to examine
and use this for the number of bars to copy:
int barsToUse = (use_multi_timeframe) ? iBars(_Symbol, timeframe) : rates_total - prev_calculated + 1;
or
int barsToUse = (use_multi_timeframe) ? rates_total / (PeriodSeconds(timeframe) / PeriodSeconds()) + 2 : rates_total - prev_calculated + 1;
i would like to say thank you to the author or developer of this indicator, i manage to turn it into an Expert Advisor in MT5 and i am doing back testing for it in strategy tester.. even though its going downwards, i am using 1:3 risk ratio with fixed 21 pips of stop loss and 7 pips take profit on GOLD. I am using multiple time frame analysis for entering the market.
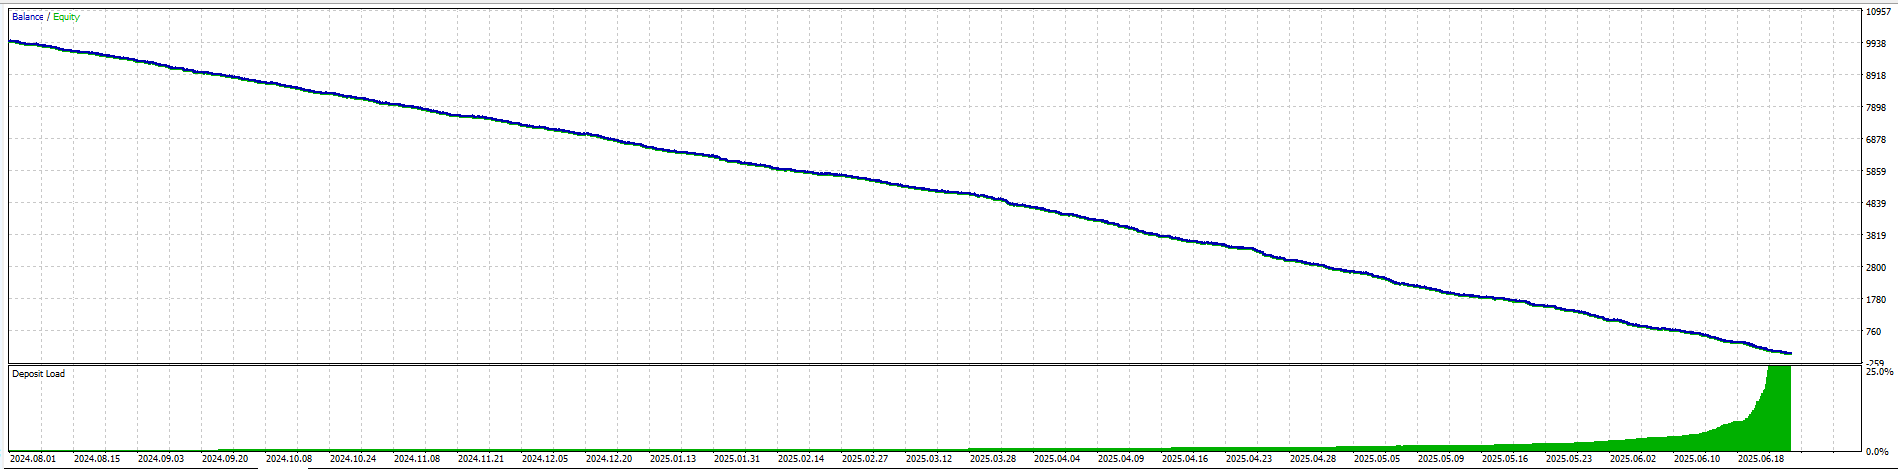
i am hoping this 100% back test modelling data will provide profits when i reverse the signal using the same risk ratio which is 1:3 , 7 pips SL and 21 pips TP on real account
Wish me luck...
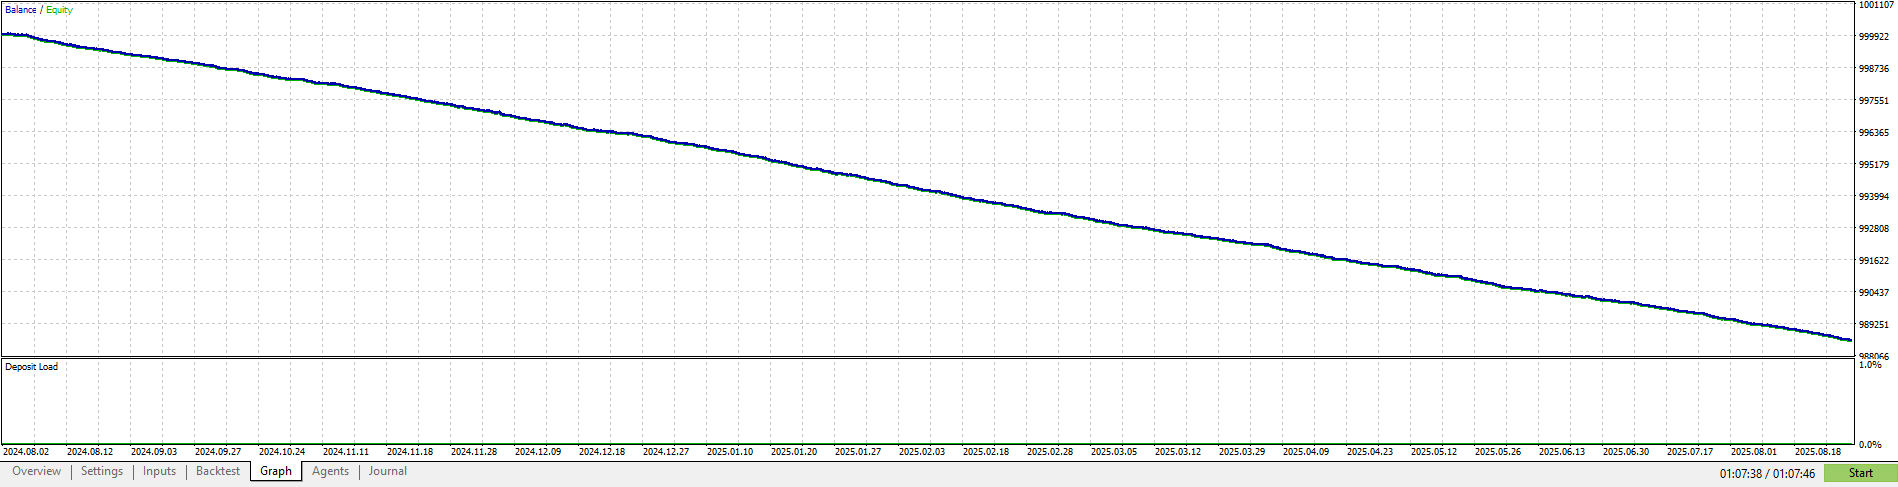
and this is for bitcoin using 1:3 risk ratio (fixed sl tp)
i would like to say thank you to the author or developer of this indicator, i manage to turn it into an Expert Advisor in MT5 and i am doing back testing for it in strategy tester.. even though its going downwards, i am using 1:3 risk ratio with fixed 21 pips of stop loss and 7 pips take profit on GOLD. I am using multiple time frame analysis for entering the market.
i am hoping this 100% back test modelling data will provide profits when i reverse the signal using the same risk ratio which is 1:3 , 7 pips SL and 21 pips TP on real account
Wish me luck...
Simply reversing the signals does not usually fix the problem. A losing system is not losing just for being "the wrong way around" but because its entries lack a positive edge.
In addition, spread, commissions, and the SL/TP asymmetry make inverted rules almost always unprofitable. The solution is not to flip the logic but to redesign the strategy from the ground up.
- Free trading apps
- Over 8,000 signals for copying
- Economic news for exploring financial markets
You agree to website policy and terms of use
Bull Bear Volume:
An indicator that provides a clear visualization of volume pressure on each side of the market
Author: Conor Mcnamara