Indicators: Angle and Speed
There is no angle from 2 anchor points. An angle requires distance divided by distance; a unit-less number. A chart has price and time. What is the angle of going 30 miles in 45 minutes? Meaningless!
You can get the slope from a trendline: m=ΔPrice÷ΔTime or m=ΔPrice÷Δ(bar index). Changing the price scale, bar width, or window size, changes the apparent angle, the slope is constant. Angle is meaningless.
Impossible to do.
There is no angle between two points of support. An angle is distance divided by distance; a number without a unit. There is a price and a time on the graph. What is the angle if you drive 30 miles in 45 minutes? It doesn't make sense!
You can get the slope from the trend line: m=ΔPrice÷ΔTime or m=ΔPrice÷Δ(bar index). Changing the price scale, bar width or window size changes the apparent angle, while the slope remains constant. The angle has no meaning.
You are wrong.
And specifically.
By changing the scale, you move both coordinates. By flattening vertically, you flatten the scale vertically as well, and therefore the angle stays the same at all times. This is a constant.
Visually there is a distortion, not a transformation.
As a result, there is a length on the time scale (number of seconds/minutes/hours/bars/candles), and there is a length on the vertical scale.
Two lengths and we get an angle, which is meaningfully tied to two points.
And for convenience, the two coordinates are adjusted relative to each other in such a way that the number of the angle at the average trend gets the number 45 or 0.45, or any other, as convenient.
It is not necessary to fix in 0/90 or 0/(-90) degrees, the numbers (scale!) can be adjusted any. But it will work as an angle calculation.
For example, if the price grows evenly and the angle shows 45 degrees, this is information about the chart, not meaninglessness. Information of this original type.
Further the trader himself decides to which points (correction, trend, zigzag) to bind the scale and how to conduct further calculations with the received information: he tries himself or throws it to the input of the neural network.
I agree with you and in the description I indicated that the indicator is useless.
Although a trader I know has been trading on the indicator derived from this indicator for a long time and it is not bad.
Then why now claim it's useless? I can see a use, a sudden large angle compared to a smaller angle from a few bars previous could be a time to avoid trading, it could indicate overly volatile price action from news impact
So why now claim it is useless? I can see the use, a sudden large angle compared to a smaller angle a few bars earlier could be a time to avoid trading, it could indicate overly volatile price action from news exposure.
Why useless. Well if only because nowadays to see the angle, all you have to do to see the angle is take a trendline, pull it and you will see the angle, without using an indicator.
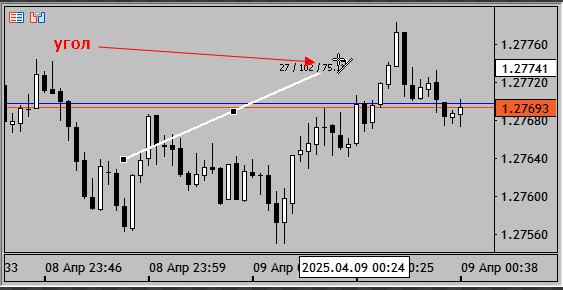
Why useless. Well if only because nowadays to see the angle, all you have to do to see the angle is take a trendline, pull it and you will see the angle, without using an indicator.
- Free trading apps
- Over 8,000 signals for copying
- Economic news for exploring financial markets
You agree to website policy and terms of use
Angle and Speed:
The indicator shows the angle or average speed of price change.
Author: Aleksandr Slavskii