Discussion of article "Alan Andrews and his methods of time series analysis"
The material about Andrews Fork is useful.
I will try to add a little bit to fully understand the possibilities of Andrews Pitchfork.
To begin with, a picture of the current situation on GBPUSD. And then additional possibilities.
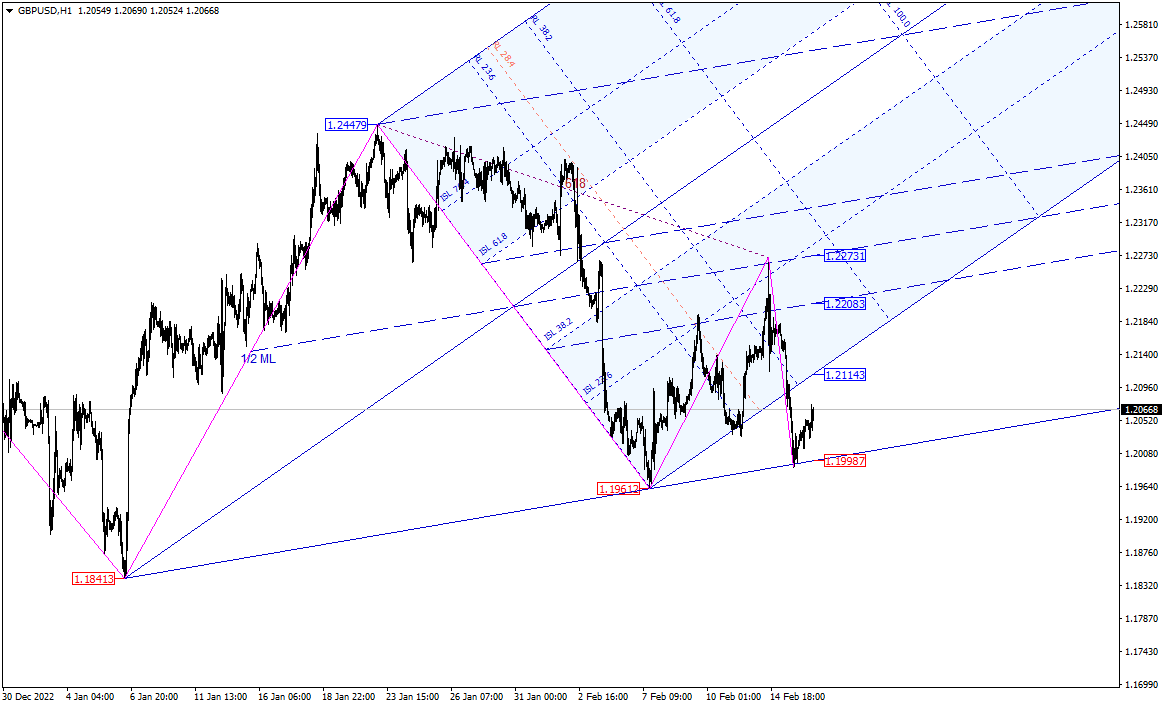
Here is a complex of Andrews Pitchfork and Schiff lines. With the complex use of these two tools, you can immediately see the lines from which reversals or corrections can occur.
The names of some lines are given in the article. Further I will give my own names, which have been used in the set of pitchforks shown in the picture for more than 17 years.
The stuff about Andrews' pitchfork is useful.
I will try to add a little bit to fully understand the possibilities of Andrews Fork.
To begin with, a picture of the current situation on GBPUSD. And then additional possibilities.
Here is a complex of Andrews Pitchfork and Schiff lines. When using these two tools in combination, you can immediately see the lines from which reversals or corrections can occur.
The names of some lines are given in the article. Further I will give my names, which have been used in the set of pitchforks shown in the picture for more than 17 years.
Take and draw now the lines in the future without being attached to anything.
Certainly and 100% there will be reversals or corrections from these lines. 100%
Under any circumstances, there is only one open question: "Which way to trade?".
Names of lines in Andrews forks.
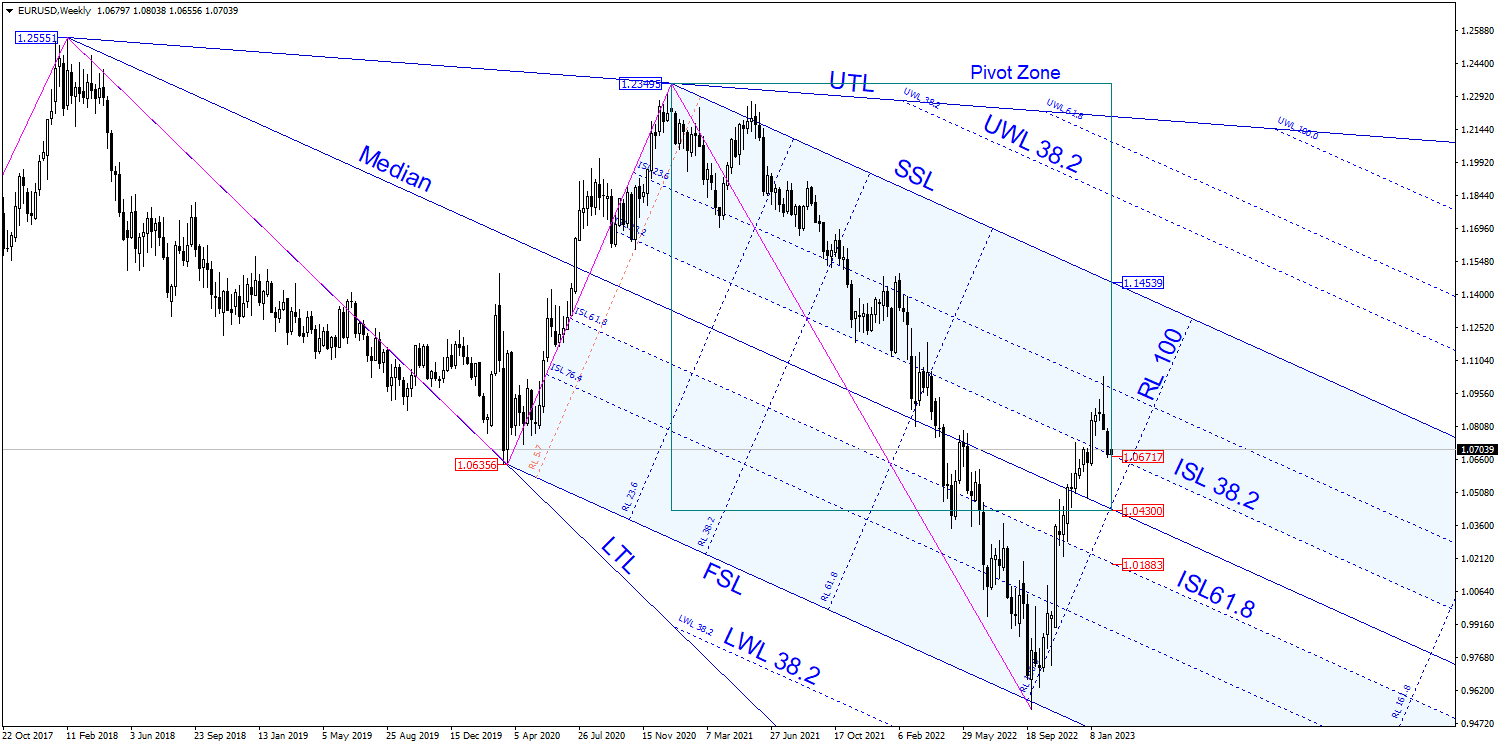
SSL - initial signal line. All letters are abbreviations. Consists of the first letters of English words. Single signal line - approximately like this.
Median - the median of the Andrews Fork
FSL - final signal line.
ISL - internal signal lines. ISL 38.2 - the internal signal line is at the level of 38.2% between SSL and FSL.
RL - reaction lines.
Pivot Zone - the zone within which the market is predicted to reach the median line.
In Schiff lines the line names are the same as for Andrews pitchfork lines with a slight difference.
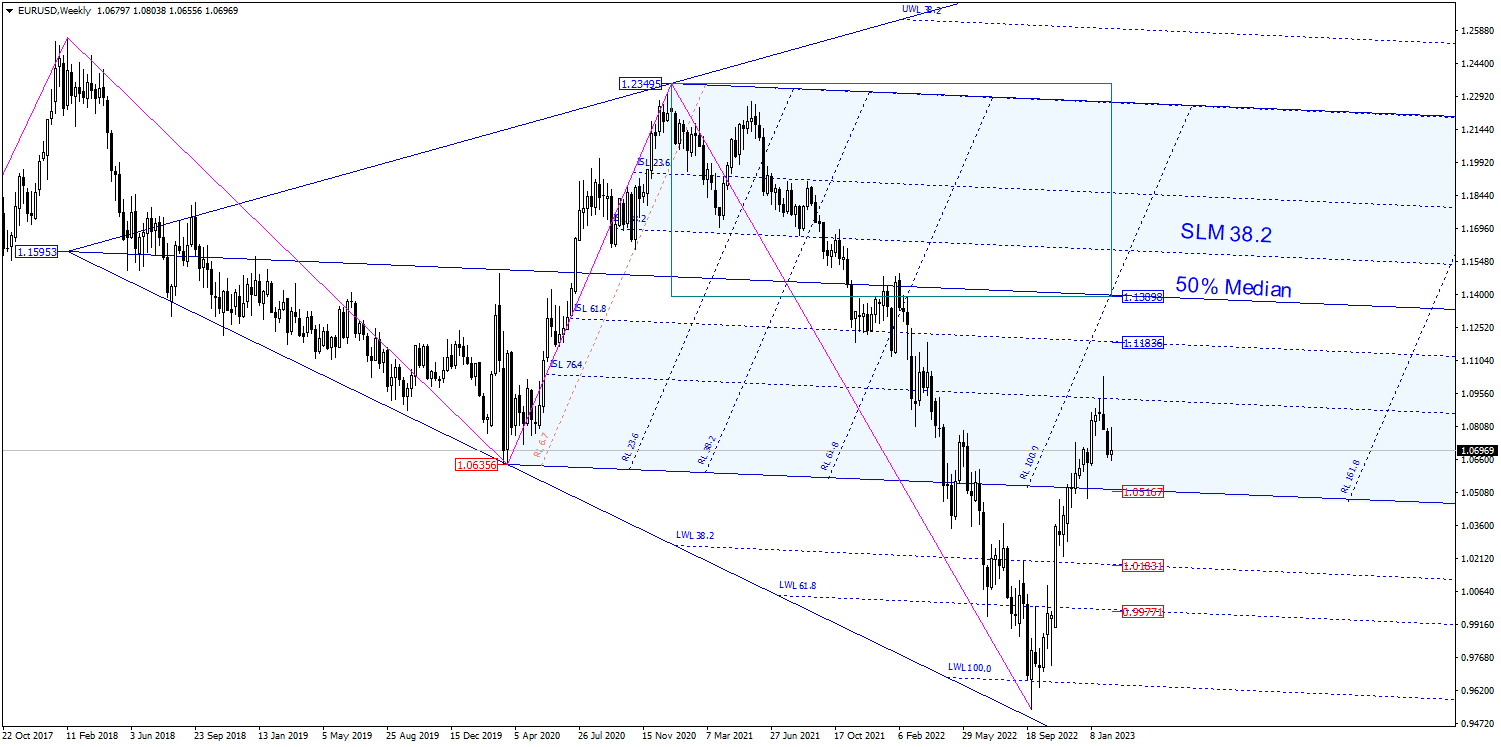
50% Median - 50% of the median.
SLM - signal lines of 50% median.
Take and draw lines now into the future with no attachment to anything.
Obligatorily and 100% from these lines there will be reversals or corrections. 100%
Under any circumstances, there is only one open question: "Which way to trade?".
What does it mean "without being tied to anything"?
In the market, no one makes any commitments to anyone. But look at the picture:
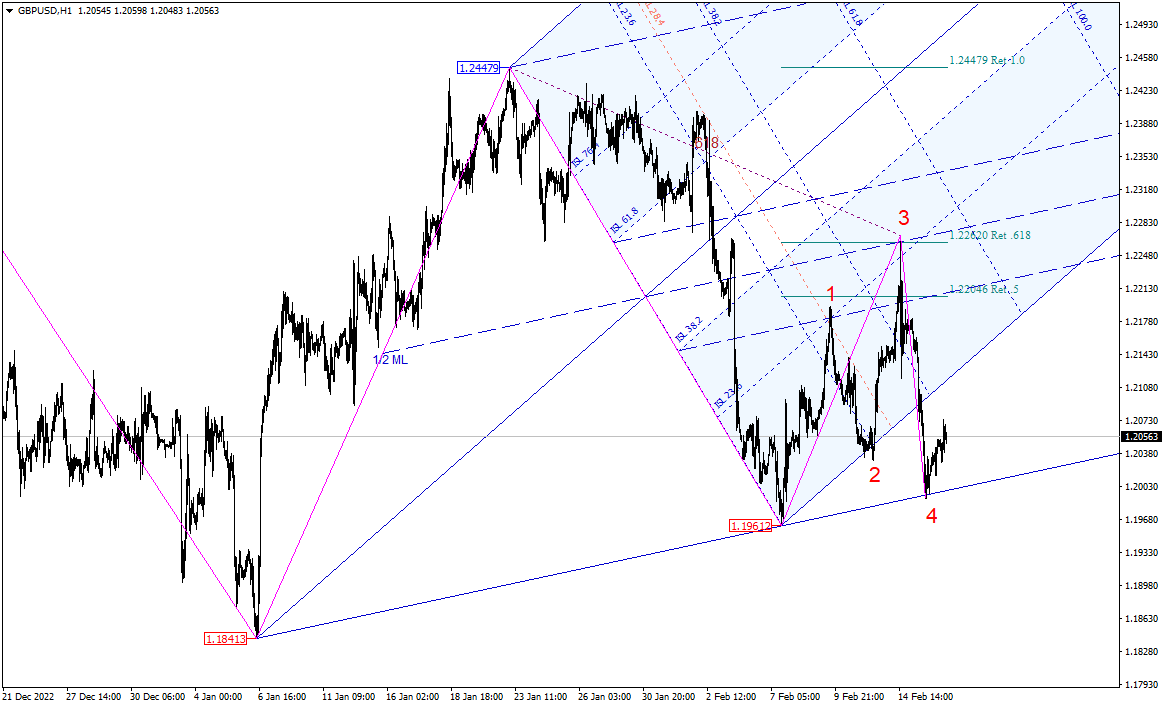
Point 1 - SLM 38.2 line - the reversal was predicted. Between the lines SLM 38.2 and SLM 50 is the zone where the end of the first wave is predicted.
Point 2 - near the SSL line of the initial signal line the end of the second wave is expected.
Point 3 - crossing of the Fibo level 61.8 and 50% of the median. It often happens that on such crossings a reversal occurs. But in this case we got a triple. The triple ended in the end zone of the first wave.
So far it is predicted that the first wave turned out to be a triple.
The correction after the first wave also in the form of a triple ended exactly on the LTL line. It coincides with the trend line.
The second wave should end between the starting point of the first wave and below the end of wave B in the first wave.
The future will show how the market will develop further. But for intraday trading what we have got is enough.
Everything is beautiful on this picture. We can say - everything is perfect. The statistics is accumulated during the long work with Andrews' pitchforks. The market behaviour near the lines as on this picture is predicted. But we should not think that it always happens like this.
There are many lines, market dynamics is different. "Work" of the lines also depends on what wave (according to Elliott) the market is in.
That's what I'm saying, if you draw lines in the future "from nothing", it will be exactly the same beautiful picture when the price gets there.
You think the Andrews pitchfork is an unnecessary tool?
You can shit all over anything with that approach.....
They're not used out of thin air, by the way. They are tied to pivot points. And then market forecasting takes place.
All drawing creators say it works, sometimes show a couple of successful inputs to elevate personal ego.
When they ask to show the state for at least a month of trading, there is nothing but new pictures of the same kind.
There are, as you said, picture creators who trade quietly. And do not stick out on forums with those who like to criticise.
Now I am making another indicator with pictures. According to the results of "peeking" at the results of trading of " drawing creator".
The results are excellent. Monitoring for several years is excellent.
======================
The pictures were posted here to discuss the Andrews pitchfork. As it turns out, the Andrews Fork is the result of the work of one of the figure-creators....
Shame on Alan Andrews!!!!!!!!!!!!!!!!!!!!!
There is Rena in the neighbouring thread, he also has excellent results, almost 100% profit per day with zero drawdown.
He also sits and keeps his head down, sometimes he will throw a couple of clever phrases, look in my previous posts. And there is nothing there except flooding, as well as 100% and zero drawdown.
You see, people like "YOU" are sitting there keeping their heads down, because they have nothing to share but pictures.
Well, keep drawing, Mozart :)
This is a thread to discuss VIL Andrews. And how one uses them is a personal matter.
If there is a tool, there are variants of realisation of the tool.
Don't be scathing. Here is an example of a trading strategy using Andrews Pitchfork: https: //redtrader.ru.
The variant with the pictures shown above is used there. My business was to make a programme. Something was made to order, something was added as a result of joint work.
The business of programmers is to programme. Traders' business is to trade. Everyone should do his own business. What he does best. And do not meddle in someone else's monastery with your own charter.
Good luck to you, critic Salieri....
=============
The link uses two programmes. Mine and Elliott Wave Maker by another programmer. In both programmes Andrews' pitchfork variant, as on the pictures above.

- Игорь Бебешин (Putnik)
- redtrader.ru
- Free trading apps
- Over 8,000 signals for copying
- Economic news for exploring financial markets
You agree to website policy and terms of use
New article Alan Andrews and his methods of time series analysis has been published:
Alan Andrews is one of the most famous "educators" of the modern world in the field of trading. His "pitchfork" is included in almost all modern quote analysis programs. But most traders do not use even a fraction of the opportunities that this tool provides. Besides, Andrews' original training course includes a description not only of the pitchfork (although it remains the main tool), but also of some other useful constructions. The article provides an insight into the marvelous chart analysis methods that Andrews taught in his original course. Beware, there will be a lot of images.
I believe, all modern chart analysis applications include Andrews Pitchfork. In advanced systems, some additional lines are added to the three main lines (for example, "side" levels are added in MetaTrader 5 for more convenience). Some developers include "Schiff pitchfork", "modified Schiff pitchfork" or even "inward pitchfork" in their programs.
The simplicity of these lines encourages developers to be creative.
However, those who have not read Alan Andrews' original course often ask "Why do we need so many different pitchforks? How to use them in trading? What additional indicators should I add to make my trading better, more precise and more pleasant?"
The original course answers all these questions. Ii is even available for free. However, its style might seem too heavy and incomprehensible to some readers.
That is why I decided to write this article. I think it is time to reveal the truth to those who did not know it. :-)
Author: Oleh Fedorov