You are missing trading opportunities:
- Free trading apps
- Over 8,000 signals for copying
- Economic news for exploring financial markets
Registration
Log in
You agree to website policy and terms of use
If you do not have an account, please register
Yes! It's going to 1741 and then only your prediction will work out to 1670
I don't know what to do. I'll be looking for a way out.
---------
I'm re-shooting the top.
Hi. Put your emotions in the back of the closet. They're in your way.
Hi. Lock your emotions away in a distant cupboard. They're in your way.
Hey! Today's levels, once again confirming upward movement
Hi! Levels today, again confirming upward movement
I am not asserting or pushing anything. Just a question.
Is this situation likely to happen again?
I am not asserting or pushing anything. Just a question.
Could this situation happen again?
It could, I don't argue - you can quickly switch to the opposite side, I have the utility set up from levels and when the movement moves sharply downwards, the utility will reverse the position
maybe, I don't argue - you can quickly switch to the opposite side, I have the utility set up from the levels and when the movement moves sharply downwards, the utility will flip the position
Do these reversals affect the size of the deposit?
Do these rollovers affect the size of the deposit?
Yes! for the better - sometimes I earn nothing, but the main thing is that I don't lose
Yeah, for the better - sometimes I don't make any money, but the important thing is that it doesn't leak.
Well, that's fine, then.
Well, that's OK then.
I'm testing modestly now, I'm getting my hands on it. Yesterday modestly, but most importantly not in deficit.
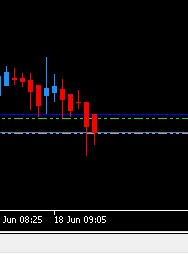
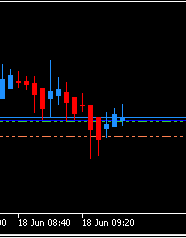
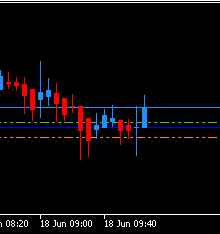
I would like to share this indicator, it shows the direction every day, as horizontal lines are set every day to a new level
And when the blue line comes out of the zone, that's where the direction will be
------------------------------
It is better to enter the market closer to the zone ---- as during the day the price comes back to this point - in a pinch you stand firm
I'll add -
breakout is when the blue line goes out of the zone. Best results at 30 min.
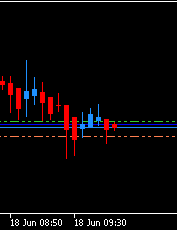
for 5 min. to show ------ > Here you can get ready to go up
  -- cheated back into the zone
time in 10 hours - after this time the exit from the zone, determines the daily movement
I would like to share this indicator, it shows the direction every day, as horizontal lines are set every day to a new level
And when the blue line comes out of the zone, that's where the direction will be
------------------------------
It is better to enter the market closer to the zone ---- as during the day the price comes back to this point - in a pinch you stand firm
I'll add -
breakout is when the blue line goes out of the zone. Best results at 30 min.
for 5 min. to show ------ > Here you can get ready to go up -- cheated back into the zone
time in 10 hours - after this time leaving the zone, determines the daily movement
This is how this whole construction looks like on the 30mi. Chart