How do I programmatically define a martingale in my account?
You can download the file with the trading history from the signal and write a script to work with it.
How to determine whether there is a martingale on the account or not?
Not to look through the trading history with my eyes.
What are your ideas?
Without a long analysis - look at automatic parameters and draw a conclusion - there are two or three parameters in the account:
1) maximum deposit load -- 80% and higher -- if higher than 100%, it means that additional capitalization is needed
2) small, for example, up to 10 per cent monthly growth (may be higher or lower, but it is in sharp contrast with the deposit load)
3) we can check the drawdown to be sure and it is higher than 50%
In 99% of cases, an account with these parameters will be martingale
Without a long analysis - look at automatic parameters and draw a conclusion - there are two or three parameters in the account:
1) maximum deposit load -- 80% and higher -- if higher than 100%, it means that additional capitalization is needed
2) small, for example, up to 10 per cent monthly growth (may be higher or lower, but it is in sharp contrast with the deposit load)
3) we can check the drawdown to be sure and it is higher than 50%
in 99% of cases -- an account with these parameters will be martingale
I agree with the first point. With the third, too, by 80 percent. I can't do the second. I used to deal with Martins and I've never got less than 40%.
wrote:
2) small, e.g. up to 10% gain per month (could be higher or lower, but it's in stark contrast to the deposit load)
We proceed from the main feature of martingale -- see Wiki:"When a player wins, even after a long losing streak, he recoups all of his losses and still makesa profit equal to the starting bet".
The starting bet is minimum -- so the monthly gain is minimum -- and there, its value depends on how often the martin is triggered.
The problem was to determine a martin without analyzing the history of trades.
p.s. there are a lot of variations -- not all cases can be understood without analyzing the transaction history:
-- the balance may be huge, so the drawdown and deposit load may not be high
-- Martin may be cut by the filter by the number of knees, for example, 4-5 knees and all
-- martin may be different -- one closes every trade -- the other accumulates until the final trade
You can download the file with the trading history from the signal and write a script to work with it.
How can you determine programmatically that a martingale is used in the account?
Not to look through the trading history with my eyes.
Who has any ideas?
Hi!
If you have a history file, you can output a price chart and close trades on Exsel.
At least for a couple of days of trading history.
Or manually make on the MT4 chart the course of the trade.
all robots with profits above 200% use the martingale and grid principle in one way or another.
you cannot take large gains and risk a small one. the risk will be inevitable.
all strategies with such returns have one common denominator - risks.
Most of them are netters, if not all of them.
Just analyze the % return per month/week and that's it.
This method is effective and reliable in all aspects.
But if you want to trade your time for the wind a little, you can go for it.)
You can download a file with the trading history from the signal and write a script to work with it.
How can I programmatically determine if a martingale is being used in my account?
So you don't have to look at the trading history with your eyes.
What are your ideas?
Without analyzing the history of trades with your eyes.
I usually look at trade history with my eyes: if there are trades with increasing lot size, it's a martingale.
how do you teach a program to do this?
This is good for simple martins.
I need it for all)
There is a suggestion. Compare the "Drawdown" and "Deposit Load" charts.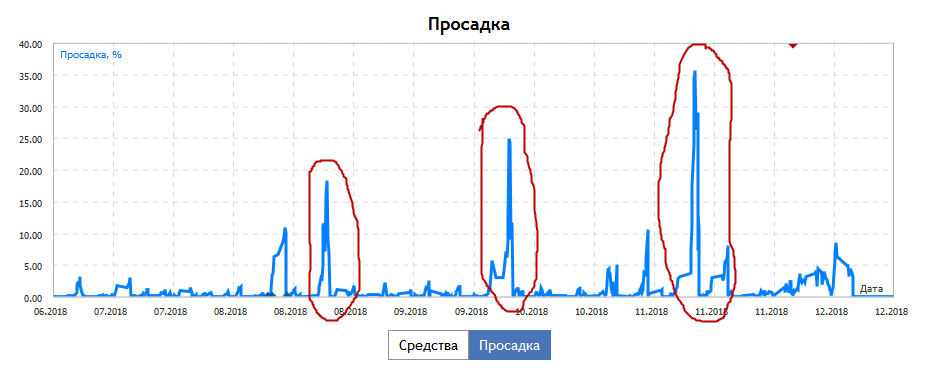
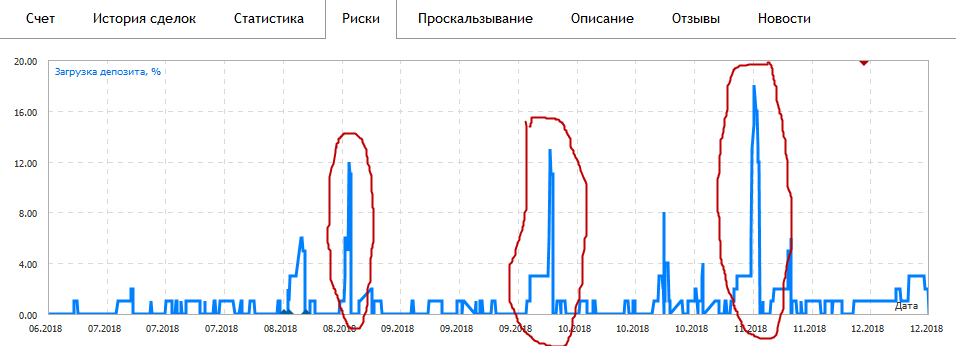
It is logical, because in martingale, when there is a drawdown, there is an increase in deposit load.
Calculate the correlation coefficient between these two charts. If the CC is greater than a certain value - the test result is positive.
But the "Deposit Load" chart should be shifted to the right (probably by 1 bar). Because, firstly, the person goes into drawdown, and then increases the lot size.
The problem is that the drawdown and deposit load charts cannot be loaded into the script.
It would be better if these charts were attached to each other in the signals service. So that at least they could be visually compared.
Volumes directly depend on the drawdown. The greater (longer) the drawdown, the greater the volume in the market.
Programmatically, you can calculate the correlation, volume vs equity drop
- Free trading apps
- Over 8,000 signals for copying
- Economic news for exploring financial markets
You agree to website policy and terms of use
How can I programmatically detect if a martingale is being used in my account?
So you don't have to look at the trading history with your eyes.
Who has any ideas?