ZigZags Shepherds - page 14
You are missing trading opportunities:
- Free trading apps
- Over 8,000 signals for copying
- Economic news for exploring financial markets
Registration
Log in
You agree to website policy and terms of use
If you do not have an account, please register
Oh my goodness. I didn't think it would happen like this.))
Oh my goodness. I didn't think it would happen like this)))
No. I don't believe these indicators.
They lie.
Don't believe the indicators. Trust ME.
No. I don't trust these indicators.
They lie.
Don't believe the indicators. Trust ME.
That's not what Müller said: You can't trust anyone... I can.)
That's not how Müller put it: you can't trust anyone... I can.)
You've managed to make me laugh for the eleventh time today.)) Ten times when reading the next thread.
But I can certainly be trusted. I'm not Mueller))
This is the result of determining the difference between the extremes as a function of the change in the threshold value for Kagi's ZZ. Figure b)-cumulative curve.
Same for Renko's ZZ.
I notice an interesting feature: the Chi-square distribution:
See, at k=1, there is a similarity to Kagi's ZZ, at k=2, exponent, exactly the same as in Renko's ZZ graph.
The Chi-square distribution tends to normal as k increases.
Well, I don't know...
The feature is interesting, but how to take advantage of it? It's hard to suggest anything, given that I'm not good at Kagi or Renko from the word "at all".
But, I'll give it a shot.
1. One has to give up the desire to achieve a normal distribution and search for centuries to find it. Working with the patterns already found is already a very, very big deal.
2.https://en.wikipedia.org/wiki/Generalized_normal_distribution
3. Simply put, xy-squared with k=1 is the sum of squares of normally distributed NAs, xy-squared with k=2 is the sum of NAs with a Laplace distribution
4. I was interested in the case with k=2, because studies show that the market is dominated by the Laplace distribution (double geometric to be precise)
5. It is not clear here - in these Renko's what counts? The sum of differences (High-Low)?
6. If so - then difference (High-Low) in Renko is SV belonging to Laplace distribution - it should be confirmed experimentally.
7. Then sum of differences (High-Low) in sliding window (for certain sample volume) forms xy-square with k=2 with known quantile function
https://keisan.casio.com/exec/system/1180573197
8. We wait for the exit (High-Low) in the moving window beyond the limits of a confidence interval for a certain quantile and enter the trade.
Well, this is just a rough sketch of the algorithm, just to develop the subject and nothing more :)))
5. This is where it's not clear - in these Renko's, what counts? The sum of the differences (High-Low)?
7. Then the sum of differences (High-Low) in a sliding window (for a certain sample size) forms a xy-square with k=2 with a known quantile function
https://keisan.casio.com/exec/system/1180573197
8. Waiting for exit (High-Low) in the sliding window beyond the boundaries of confidence interval for a certain quantile and enter the trade.
5. Renko considers break through the range set by "Renko brick" on the value of 1 "brick", besides break through should be on the value of "brick", i.e. "brick" 10 points, to draw a new Renko brick, the price should pass above the already formed Renko bar 10п+1п (or below on 10п+1п) and then a new "brick" will be drawn. I.e. in essence, the price is discretised without time by the value of the "Renko brick". Renko removes the noise components of the price but like any filter there is a lag, to draw a new Renko bar the price should pass through 2 ranges = 2 heights of Renko brick
7,8 is an ATR indicator, what you write is usually called a volatility breakdown, but there is an eternal problem - the period of the ATR, if the period is small, there will be noise, if the period is long, there will be lag
Here
Forum on trading, automated trading systems and testing trading strategies
ZigZags Shepherds
Novaja, 2018.08.26 23:22
This is the result of determining the difference between extrema as a function of the change in the threshold for ZZ Kagi. Figure b)-cumulative curve.
Same for Renko ZZ.
I notice an interesting feature: the Chi-square distribution:
See, at k=1, there is a similarity to Kagi's ZZ, at k=2, exponent, exactly the same as in Renko's ZZ graph.
The Chi-square distribution tends to normal with increasing k.
Novaja talks about some difference between the extremes... About the spread (High-Low) or something? I can't understand it... It's too dry and concisely written...
But, it looks like a xy-square - that's why I'm interested. Finding clear patterns is very rare.
I don't know...
The feature is interesting, but how do you take advantage of it? It's hard to suggest anything, considering I'm no good at either Kagi or Renko from the word "at all".
But, I'll give it a shot.
1. One has to give up the desire to achieve a normal distribution and search for centuries to find it. Working with the patterns already found is already a very, very big deal.
2.https://en.wikipedia.org/wiki/Generalized_normal_distribution
3. Simply put, xy-squared with k=1 is the sum of squares of normally distributed NAs, xy-squared with k=2 is the sum of NAs with a Laplace distribution
4. I was interested in the case with k=2, because studies show that the market is dominated by the Laplace distribution (double geometric to be precise)
5. It is not clear here - in these Renko's what counts? The sum of differences (High-Low)?
6. If so - then difference (High-Low) in Renko is SV belonging to Laplace distribution - it should be confirmed experimentally.
7. Then sum of differences (High-Low) in sliding window (for certain sample volume) forms xy-square with k=2 with known quantile function
https://keisan.casio.com/exec/system/1180573197
8. We wait for the exit (High-Low) in the moving window beyond the limits of a confidence interval for a certain quantile and enter the trade.
Well, this is just a rough algorithm, just to develop the subject and nothing more :)Cgfcb,j
Thanks a lot, great comment.
A few words on the construction of the zz. Kagi's variant.
Blue shows the tick chart, threshold is 3p. If the opposite is greater than 3 pips an extremum is drawn, if not, we go further. I.e. swings may contain 2.66; 3.66; n number of such thresholds (segments) with fractional values. This fractional value is discarded in Renko type construction, but the principle is the same. I.e. whole values 2,3, etc. So we see how fractional vertexes are not taken into account in construction. In the picture below is a variant of Renko.
Now I think the difference is clear. So, frequency of appearance of the ratio of the swing length to the threshold value (segment of 3p) for Kagi: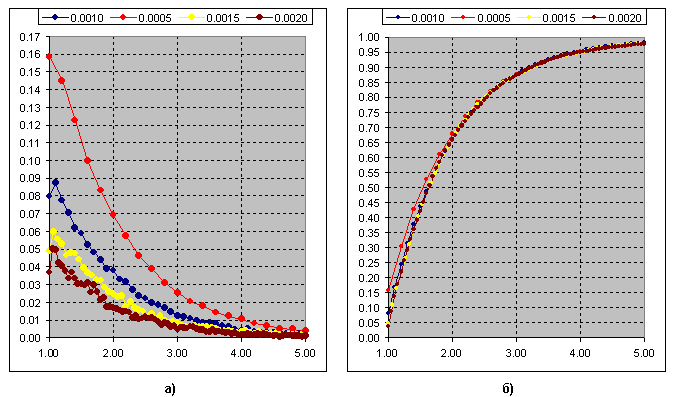
Fig.b) Cumulative sum of curves. The Chi-squared distribution at k=1 fits this curve.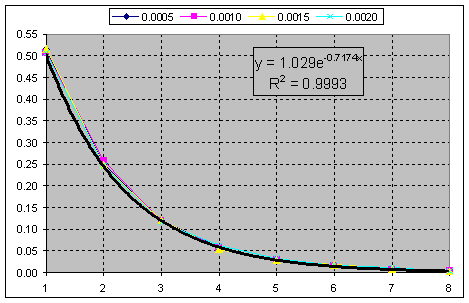
And this is the cumulative sum of the frequency of occurrence of the swing ratio to the threshold(segment) for the Renko construction. Chi-squared at k=2.
I.e. we just have to discard the fractional parts and get a pure exponent.
Thank you very much, great comment.
A few words on the construction of the zz. Kagi's variant.
Blue shows the tick chart, threshold - 3p. If the opposite is greater than 3 pips an extremum is drawn, if not, we go further. I.e. swings may contain 2.66; 3.66; n number of such thresholds (segments) with fractional values. This fractional value is discarded in Renko type construction, but the principle is the same. I.e. whole values 2,3, etc. So we see how fractional vertexes are not taken into account in construction. In the picture below is a variant of Renko.
Now I think the difference is clear. So, frequency of appearance of the ratio of the swing length to the threshold value (segment of 3p) for Kagi:
Fig.b) Cumulative sum of curves. Chi-squared distribution at k=1 fits this curve.
And this is the cumulative sum of the frequency of occurrence of the swing ratio to the threshold(segment) for the Renko construction. Chi-squared at k=2.
I.e. you just need to discard the fractional parts as you get a pure exponent.
Swings... Eh-mah... :)))
OK. I won't go deep into the terminology. No time.
We have the purest exponent on anything.
The sum of these components will be a negative binomial distribution (the Erlang distribution for continuous NE) again, I emphasise, with of the famous dispersion. In the limit, it is the normal distribution you are looking for.