From theory to practice - page 622
You are missing trading opportunities:
- Free trading apps
- Over 8,000 signals for copying
- Economic news for exploring financial markets
Registration
Log in
You agree to website policy and terms of use
If you do not have an account, please register
Kolmogorov is a smarter man than most of those who stare into the monitor. And his requirements to BP prediction are simple: expectation = const and periodic ACF.
Now here's the thing to say.
I look at incremental distributions and how they change their statistical moments depending on quotation reading intervals, and I realise that market prices do NOT have the property of self-similarity. This property is unique to processes with stable, infinitely divisible (e.g. normal) distributions of increments - such as Brownian motion. This is not the case in the market.
Obviously, Mandelbrot and his fellows, who have no knowledge of physics (and even worse - they have knowledge, but hide it carefully), intentionally deceived the desperate people, so that they would go to scalping on tick data and small timeframes, and fill their bottom pockets by losing their deposits.
Well, there you go!
Research on
http://tpq.io/p/rough_volatility_with_python.html
same https://hal.inria.fr/hal-01350915/documentNow here's the thing to say.
I look at incremental distributions and how they change their statistical moments depending on quotation reading intervals, and I realise that market prices do NOT have the property of self-similarity. This property is unique to processes with stable, infinitely divisible (e.g. normal) distributions of increments - such as Brownian motion. This is not the case in the market.
Obviously, Mandelbrot and his fellows, who have no knowledge of physics (and even worse - they have knowledge, but hide it carefully), intentionally deceived the desperate people, so that they would go to scalping on tick data and small timeframes, and fill their bottom pockets by losing their deposits.
That's it!
You've already brought conspiracy theories into the mix... another load of crap.
Read the subject:
http://inis.jinr.ru/sl/vol2/Physics/Динамические%20системы%20и%20Хаос/Федер%20Е.,%20Фракталы,%201991.pdf
Just to make it clear what I'm aiming for.
I have just started working in Erlang's 60th order flow (reading tick quotes, on average, once per minute).
We have the following histogram for the EURJPY pair increments, for example:
Statistics:
This is practically a Laplace distribution.
The sum of increments (~price) and increment moduli (~dispersion) have normal distribution at rather large sample volume (a day - for M1 or a week - for M5) of such SP.
So the goal is to get to a pure Laplace distribution, then we will really have a direct analog of the Ornstein-Uhlenbeck process with a return to the mean.
I would also like to guess which sections of history he uses to build his charts, there are trending sections for several months, and there are sideways
As well as the principle of "jumping" from M1 to M5 is not clear, he needs consistency or at least a justification. He would be invaluable there with such talents, they also successfully add months, then quarters, then seasons = we get the required statistical data
)))
Just to make it clear what I'm aiming for.
I have just started working in Erlang's 60th order flow (reading tick quotes, on average, once per minute).
We have the following histogram for the EURJPY pair increments, for example:
Statistics:
This is practically a Laplace distribution.
The sum of increments (~price) and increment moduli (~dispersion) have normal distribution at rather large sample volume (a day - for M1 or a week - for M5) of such SP.
So the goal is to get to a pure Laplace distribution, then we will really have a direct analog of the Ornstein-Uhlenbeck process with a return to the mean.
In general I see, the kurtosis is reduced, the tails are picked up ---> from Laplace to normal, from normal to uniform. Then what's at the beginning? Not Laplace? What? Because it is easily described by an exponent, if you take one side.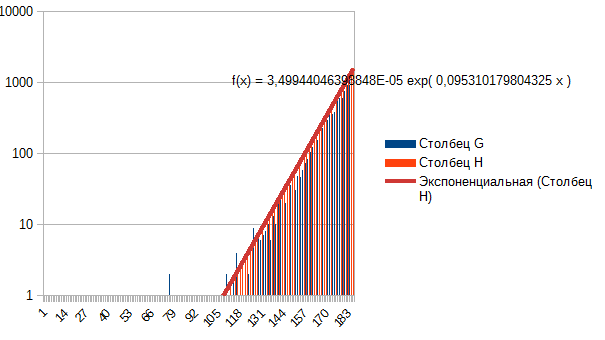 This is the EURUSD minute-month window.