From theory to practice - page 1276
You are missing trading opportunities:
- Free trading apps
- Over 8,000 signals for copying
- Economic news for exploring financial markets
Registration
Log in
You agree to website policy and terms of use
If you do not have an account, please register
So what was the advice? Don't be too long now that you've started.
So what was the advice? Don't be too long now that you've started.
Yeah, I didn't write about advice. Something was glimpsed, and it was already suggested by association. But what he said exactly, I don't remember, and it doesn't matter.
I know what you do, you just forgot to answer, how does a dandelion know there's wind on Earth?!
I know what you're doing, you just forgot to answer, how does a dandelion know there's wind on Earth?!
+++
Lucky.))
I know what you're doing, you just forgot to answer, how does a dandelion know there's wind on Earth?!
A breakdown indicator - no, it has to work here and now. Instantaneous speed as an example.
it often happens that price has travelled a lot in a second bar, i.e. moved at high speed, but that does not mean that it is trending now. such big second bars appear from time to time.
I think that there is no indicator that can show here and now (on the second bar or on the one-minute bar) what phase the market is in now.
If there were such an indicator, the market could be decomposed into states
When the market is in a trend - switch on the trend EA, when it's in flat - switch on the flat EA.
There is no instantaneous indicator, we will have to watch the last time interval for several bars.
There is no instantaneous indicator, you will always have to look at some recent time span over several bars.
Alexander_K:
So it would be interesting for me to look at a summary table of Hearst values, autocorrelation, etc. on different periods - to make sure that independent studies have resulted in the same periodic market structure as I have, where the deviation indicators show correct values with at least 80% probability.
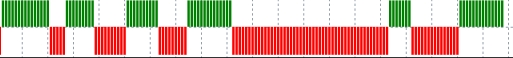
I used to check it once. But I did not look at the whole period, but at the period of deviation, in the figure - red.

autocorrelation was calculated for this piece of the chart. and then, depending on the indicator value, I made a decision whether to enter or not to enter the trade. this piece of the chart is a trend or a flat.
(I also tried something similar to Hurst.)
it changed the system results.
did your results change much after introducing such an indicator?
I disagree. There is such an indicator - otherwiseDmitriy Skub would not have kept his modified Hearst method of calculation in the greatest secret.
have your results changed much since the introduction of such an indicator?
Sure. But, I'll be 100% sure after 3 months of real-life practice. Let's see.