Catching a reversal or correction
- From theory to practice
- Neural network in the form of a script
- Geometric approach in price forecasting
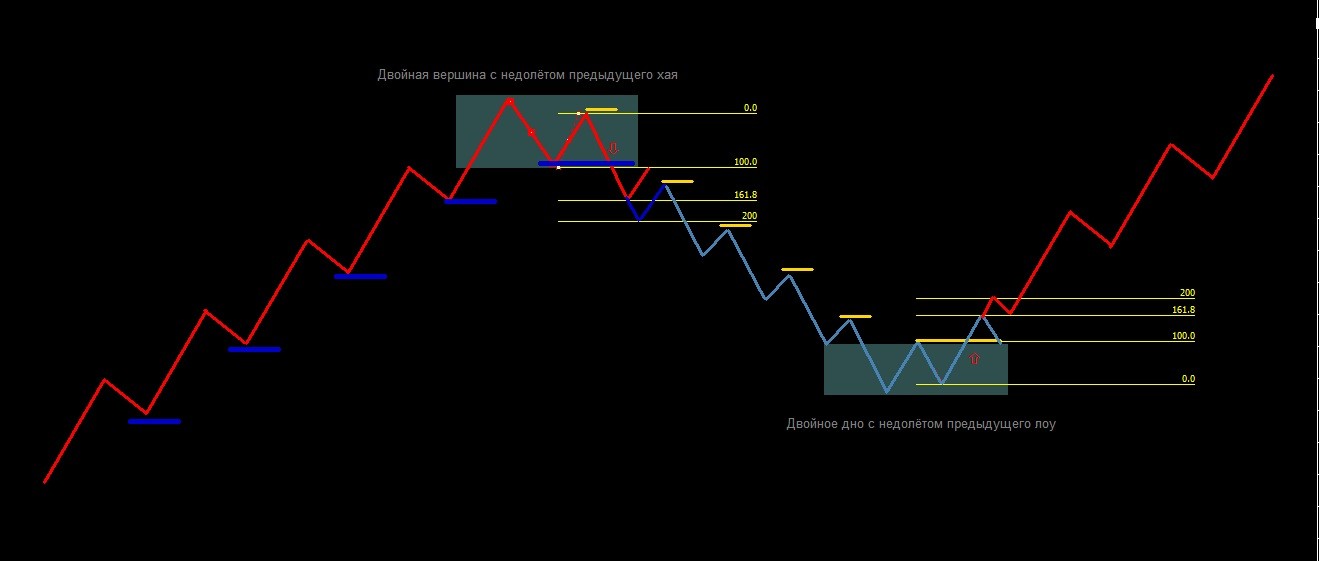
I would like to suggest that you consider one of the many quite working patterns that portend a reversal or correction.Everything looks quite clear and simple.We observe some movement accompanied by constantly going down or up in zigzags.But is it possible to calculate this level? I have seen many mechanics but have not found any hint. The system promises to be quite adequate, there are several options for its processing. My eyes are getting tired, however... In principle it is nothing more than a doublet or a top, but their configuration must correspond to certain criteria. The picture shows the general conception of cp, but the base is the moment of "neck" breakthrough and further move to 161 or 200% of the last swing.
So the question is - what direction to go to identify this moment by the robot? Of course there are rejections, but this can be filtered by finding a way.
That's a hell of a mix! You've got the zig-zag and the Fibonacci levels...
Although the idea of going in might be good... in some places...
I will have to look at it - I was thinking about doing something similar to check the breakdown of L.Williams' zigzag extremums.
Yes.
it's a 1-2-3 pattern, look for indicators on this topic
I'll have a look...but I'll attach the pound. I didn't find many stops in a decent amount of time by eye. I was racing in the simulator, not looking for static.
DAROV.
it's a 1-2-3 pattern, look for indicators on that theme
That's me being a loon :o)... I found out my wife's name five years after the wedding :o)... Yes, I have it. Thanks again. But do you have mechanics on this subject?
Gerasimm won't be too upset
I would like to propose an idea I just came up with, reading the post about zigzags
In the zigzag, we can observe two types of movements, one fading and another rising (no matter whether the price goes up or down).
For example, the news was followed by the rising wave and after it - by the fading wave, according to my estimations the fading is about 30%
and then it may happen again, or it may fade again after the fade.
So it goes like this
we take a pips zigzag and set the number of minimum waves, for example 40 pips.
we take the last two extremums of maximum and minimum.
Suppose the trend goes downward and the minimum extremum is 40 pips from the high.
40/ 3 = approximately 13 pips
place a buy order +13 pips from the low, the profit 13 pips Stop loss may also be 13 pips.
If the trend continues, it means a new recalculation and the pause is modified.
I can draw it if you are interested.
here you go.
it's one of the 10 inductors i left behind after deleting the whole collection of indicators:)
I would like to suggest that you consider one of the many quite working patterns that portend a reversal or correction.Everything looks quite clear and simple.We observe some movement accompanied by constantly going down or up in zigzags.But is it possible to calculate this level? I have seen many mechanics but have not found any hint. The system promises to be quite adequate, there are several options for its processing. My eyes are getting tired, however... In principle it is nothing more than a doublet or a top, but their configuration should correspond to certain criteria. The picture shows the general conception of Ace, but the base is the moment of breaking through the "neck" and further going to 161 or 200% of the last swing.
- Free trading apps
- Over 8,000 signals for copying
- Economic news for exploring financial markets
You agree to website policy and terms of use